

Is RVOL 2x Enough for a Stock Breakout? How to Compare Volume at the Same Time of Day and Spot False Breakouts
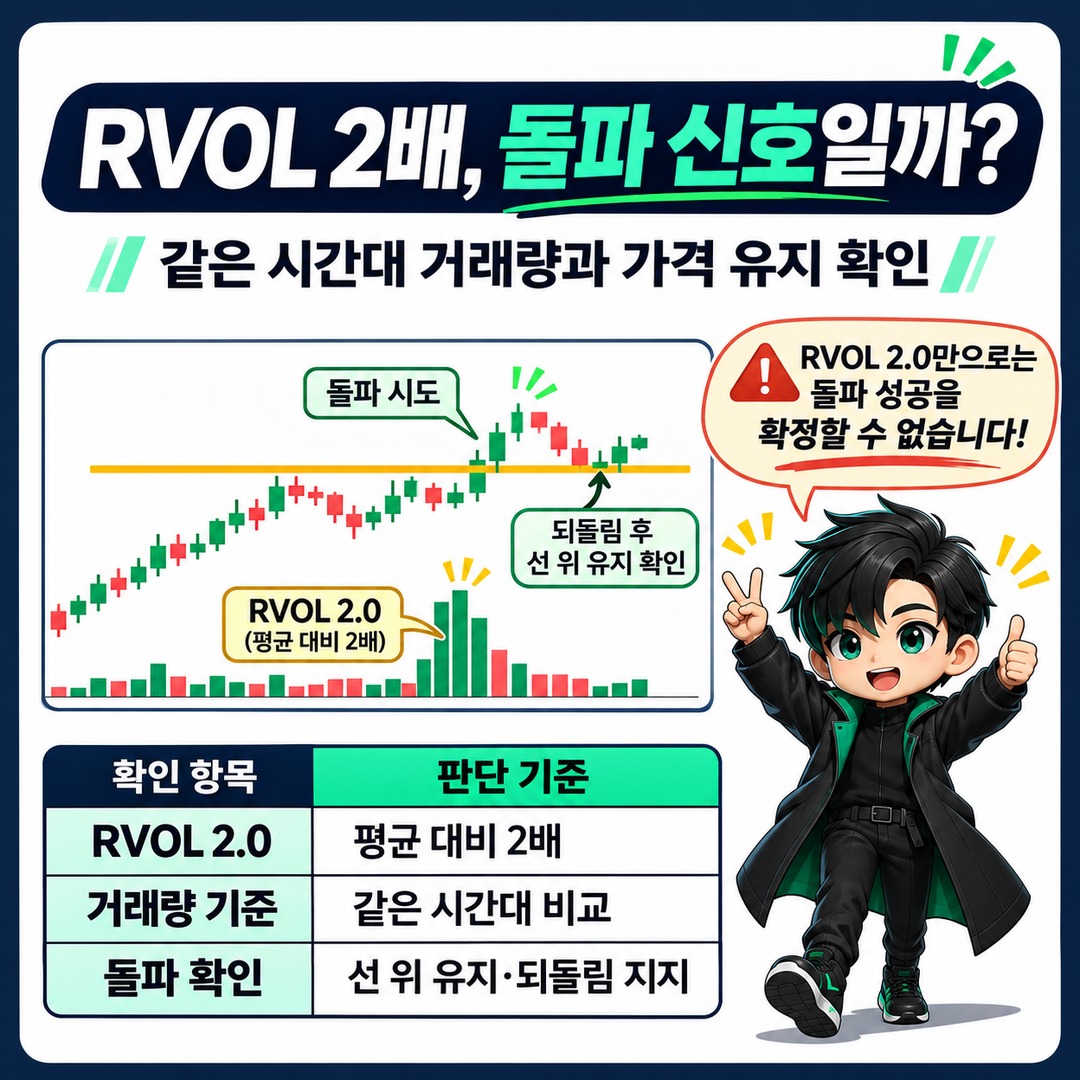
An RVOL (Relative Volume) of 2.0 means volume is 2x the selected average. But that alone is not enough to conclude that a stock has successfully broken through resistance. Because volume patterns differ between the morning and afternoon, especially during the trading day, compare volume with past readings from the same time of day and check whether the price holds above the breakout level.
As of 2026-11-12, there are three key things to check: how RVOL is calculated, whether the price holds above resistance, and whether the breakout level acts as support during a pullback after the breakout.
What Exactly Does RVOL 2.0 Mean?
RVOL is a relative volume indicator calculated by dividing current volume by average volume from the past.

RVOL = Current Volume / Benchmark Average Volume. For example, if the average volume is 10 million shares and current volume is 20 million shares, RVOL is 2.0.
There is one important issue, however: an RVOL value for the same stock can vary depending on which average volume is used as the benchmark.
TradingView's RVOL calculation formulas show that Relative Volume and Relative Volume at Time use different benchmarks for comparison.
| Category | Standard RVOL | RVOL at Time |
|---|---|---|
| Comparison benchmark | Average of recent past bars | Same time of day in the past |
| Main comparison | Against recent volume | Against typical volume for that time of day |
| Use | Spotting volume surges | Checking for unusual intraday volume |
| Caution | Limited adjustment for time-of-day effects | Check the comparison period and settings |
A common approach is to calculate standard RVOL using the average volume of the most recent 10 bars. By contrast, TradingView's Relative Volume at Time compares bars from the same time of day over a set historical period.
So when you see RVOL 2.0, the first things to check are the indicator's name and settings.
The denominator used to calculate RVOL 2.0 matters more than the number itself.
Why Should Intraday Volume Be Compared at the Same Time of Day?
Intraday volume does not occur at a steady pace throughout the day.
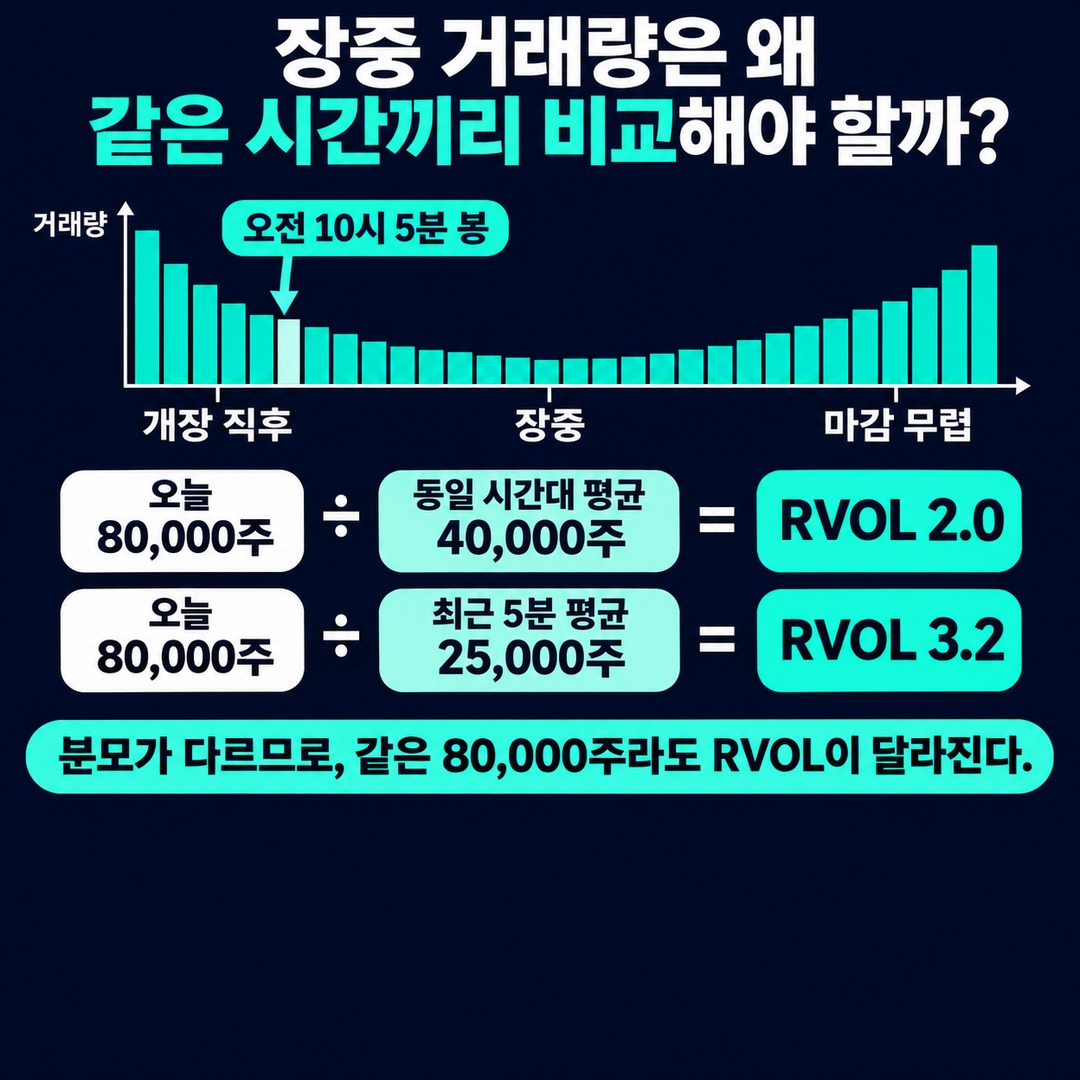
Typical volume levels can differ just after the market opens, in the middle of the session, and near the close.
So the benchmark may not match if you compare morning volume with the midday average, or compare cumulative volume so far with the historical average for a specific 5-minute bar.
TradingView explains that Relative Volume at Time compares the current bar with bars at the same time position over a historical period.
chartguys.com### How Do You Calculate It Directly Using 5-Minute Bars?
The following is a hypothetical example to explain the calculation.
Suppose you compare the volume of the 10-hour 5-minute bar in the morning with the average for the same time of day over the past 10 trading days.
| Category | Volume |
|---|---|
| Historical average for the same time of day | 40,000 shares |
| Today's 5-minute bar | 80,000 shares |
| RVOL | 2.0 |
The calculation is as follows.
80,000 ÷ 40,000 = 2.0. This result means volume during that 5-minute interval was 2x higher than usual.
But if you compare the same 8 shares with the average for recent 5-minute bars of 2 ten-thousand 5 thousand shares, the result changes as follows.
80,000 ÷ 25,000 = 3.2. Even with the same volume, RVOL changes from 2.0 to 3.2.
This is a common difference that arises when interpreting intraday RVOL.
Distinguish cumulative volume comparisons from individual-bar comparisons
There are two main ways to approach RVOL at Time.
Individual-bar comparison: Compare the current 5-minute bar with the 5-minute bar from the same time in the past.
Cumulative-volume comparison: Compare volume from today's market open through the current time with cumulative volume through the same elapsed time in the past.
For example, if cumulative volume through 10 a.m. is 60 ten-thousand shares, and the average through the same time over the past 10 trading days is 30 ten-thousand shares, cumulative RVOL is 2.0.
600,000 ÷ 300,000 = 2.0. Both calculations are useful, but they answer different questions.
An individual-bar comparison shows whether trading was concentrated at a particular moment. A cumulative comparison shows whether the day's total volume is building faster than usual.
TradingView's official explanation of Relative Volume at Time also distinguishes between the Cumulative and Regular calculation modes.
A bar that is still forming has not finished trading, so its final volume and value may differ. It's best not to make a definitive judgment based only on RVOL before the bar is complete.
Why Can a Breakout Fail Even When RVOL Is 2x?
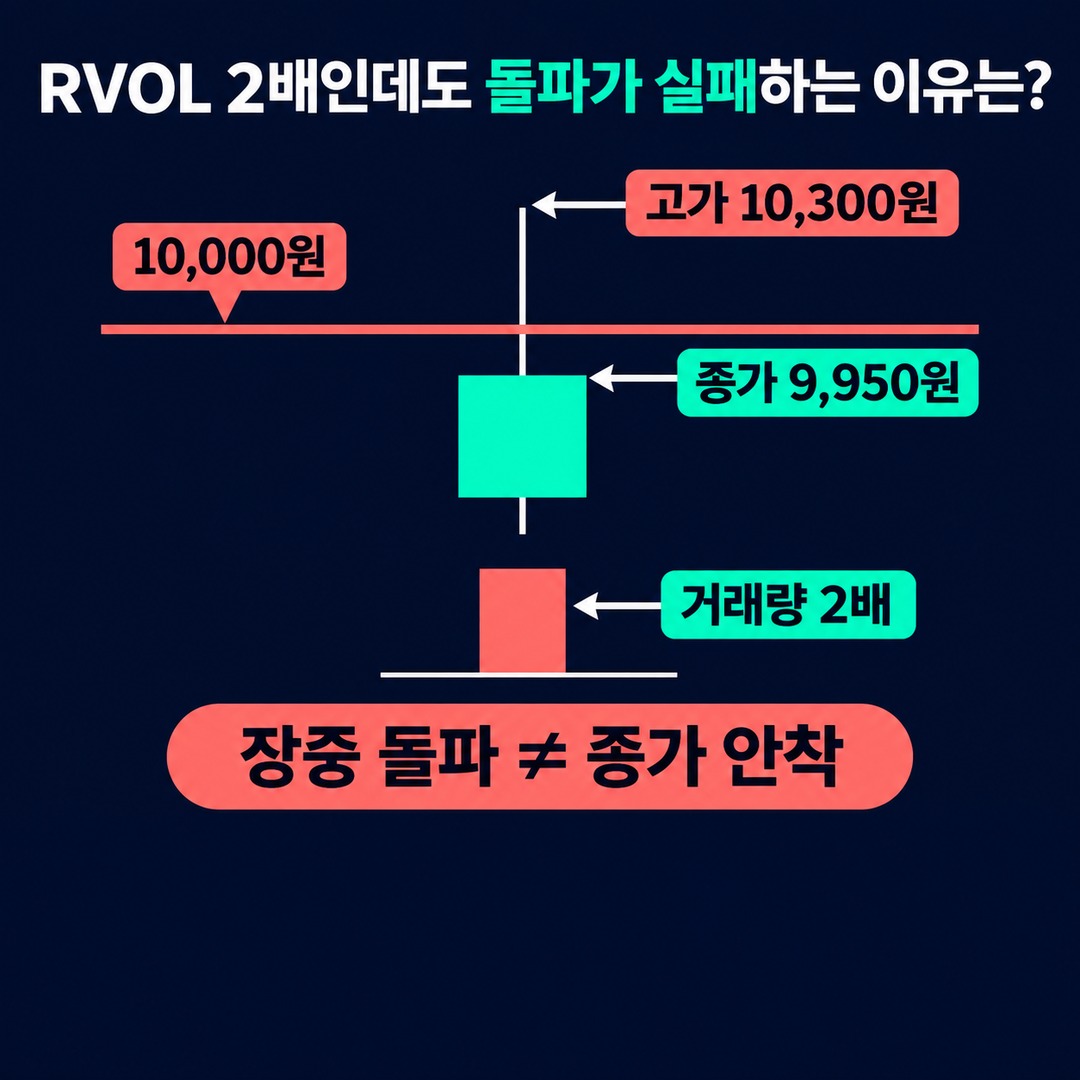
An increase in volume and a price holding above resistance are two different things.
Volume represents the number of shares traded, but volume alone cannot confirm that buying pressure was stronger than selling pressure.
So when volume surges, also look at where the price actually closes.
in.tradingview.com### 1. When Price Briefly Breaks Above Resistance and Then Falls Back
The first thing to check is the breakout bar's closing price.
Even if the price moves above resistance during the session, it is difficult to say the breakout held if the bar closes back below resistance.
For example, consider the following hypothetical situation:
Previous resistance: KRW 10,000
Intraday high: KRW 10,300
Close of that bar: KRW 9,950
The price moved above resistance by 3% intraday, but closed KRW 50 below it.
In this case, the price failed to remain above resistance.
Even if volume was 2x, there is not enough price confirmation to verify the breakout.
2. High Volume, but the Close Is Far Below the High
It's also worth checking whether a surge in volume coincides with a long upper wick.
For example, if volume rises sharply as the price breaks above resistance but the bar closes near its low, that shows the price was pushed down from its high.
That alone is not enough to conclude that accumulation or distribution is taking place.
However, because the price failed to sustain its rise despite the increase in volume, the situation calls for further checks.
3. When Price Fails to Hold Above Former Resistance During a Pullback After the Breakout
After a breakout above resistance, check whether the former resistance level acts as support.
For example, suppose the price breaks above KRW 10,000 and then falls back toward KRW 10,000.
If the price finds support above resistance and rises again, that suggests it is holding its ground after the breakout.
Conversely, if a bar closes below KRW 10,000 and the price still fails to reclaim resistance afterward, there is stronger reason to consider the breakout a failure.
The key is not simply that a pullback occurred, but where the price settled afterward.
4 Checks for Assessing a Genuine Breakout
StockCharts' guide to consolidations and breakout scans recommends considering the prior trend, the consolidation range, the price breakout, and an increase in volume together when assessing a breakout.
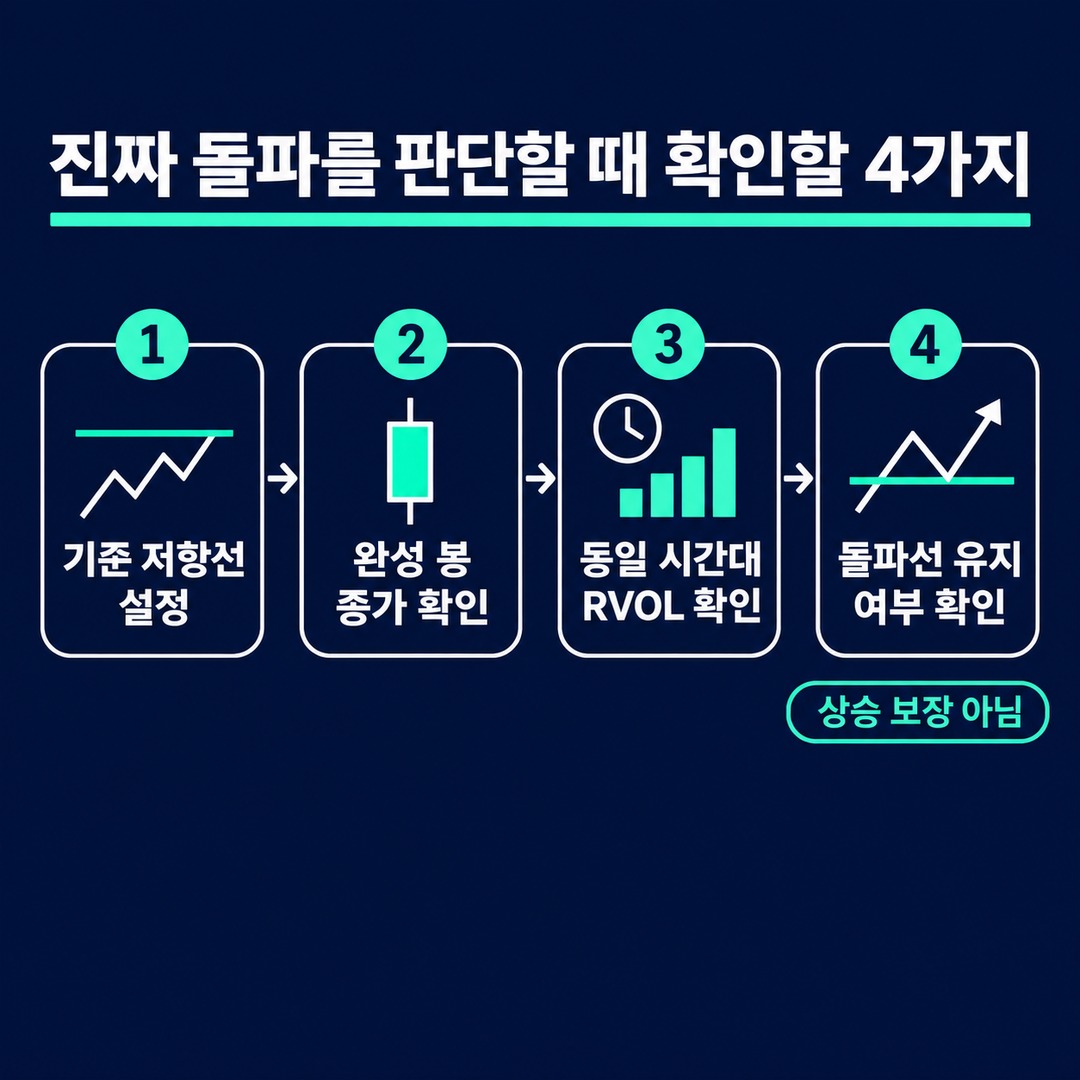
Here is a practical sequence for checking a chart:
Breakout Confirmation Steps
1. Set the reference resistance level. Before a breakout occurs, mark the previous high or the top of the consolidation range.
2. Check the close of a completed bar. Distinguish between a price that only moved above resistance intraday and one that is still above resistance when the bar closes.
3. Check RVOL for the same time of day. Compare the current bar or cumulative volume with the historical benchmark for the same time of day.
4. Check whether price holds above the breakout level. See whether resistance acts as support during subsequent price movements.
Even if all four conditions are confirmed, that does not guarantee future gains. However, it lets you assess price and trading activity together instead of judging a breakout by a single volume figure.

A Checklist for Spotting False Breakouts on an Actual Chart
When looking at a chart, check the following items in order.
Breakout Confirmation Checklist
0/7 Check: Did you identify a meaningful resistance level before the breakout? Did you confirm whether the current RVOL is standard RVOL or RVOL at Time? Did you compare volume using the same time of day and bar interval? Did you check a completed bar rather than one still in progress? Did the bar close above resistance? Did a long upper wick and price pullback appear despite the increase in volume? Did the breakout level hold during the subsequent pullback? These checklist items are for chart observation; they do not represent a buy or sell signal or a probability of success.
Should You Use RVOL 2x as a Fixed Trading Rule?
RVOL 2.0 can be used as a reference point for checking whether volume has increased substantially compared with usual levels.

However, there is no official breakout confirmation threshold that applies equally to every stock and every time of day.
StockCharts' explanation of RVOL notes that some short-term traders use 2.0 or higher as a reference, while also stating that what counts as significant volume can vary from one investor to another.
The figure of 2x can be misleading in situations such as these:
The ratio surges after just a few trades in a low-volume stock
The calculation does not account for volume patterns at a particular time of day
Only the reading from a bar still in progress is checked
The price fails to break above resistance and then pulls back
The price fails to continue rising after volume increases
So the RVOL benchmark should be set to suit the stock's liquidity, trading hours, and chart interval, and then tested separately against historical data.

How often stocks meeting RVOL 2.0 actually hold their breakouts must be measured separately by defining the stock group, market, time period, and breakout criteria. That is why this article does not give a specific success rate.
The Key Criteria to Remember
RVOL 2x is not a figure that confirms a successful breakout; it signals that trading activity was higher than usual.
To confirm an intraday breakout, first compare volume with historical volume from the same time of day. Then check whether the close of the completed bar is above resistance and whether resistance continues to hold during a subsequent pullback.
Volume shows the degree of participation in the breakout, while price shows whether that level holds afterward.
Checking both is a more reasonable approach than judging a breakout by the RVOL figure alone.
In actual trading, decide in advance how you will handle a failed breakout and what level of loss you can tolerate. High volume does not eliminate the risk of loss.
※ This article is for informational purposes to help readers understand market trends. It is not an investment recommendation for any particular stock or asset. You are responsible for your own final decisions and investment outcomes.