

Stock Trading Volume Surged: Accumulation or Selling? How to Tell Using OBV and A/D Indicators

A stock's trading volume rising to 2~3 times its usual level does not necessarily mean large investors are accumulating shares. A surge in volume means buying and selling activity has intensified. To assess the possibility of accumulation, investors need to examine the direction of OBV, the A/D indicator, and where the stock price has moved.
In particular, if a stock's price is rising while OBV is falling, or if trading volume surges but the closing price ends up near the day's low, investors should consider whether the upward trend may be losing strength.
Conversely, if volume-based indicators steadily improve while the stock price moves sideways, buying pressure may be building.
However, no indicator can definitively establish investors' actual intentions to accumulate shares or predict the future direction of a stock's price.
*Information verified as of 2026-10-26, 7 p.m. Korea Standard Time*
1. Why Doesn't a 3-Fold Increase in Volume Automatically Mean Accumulation?
Trading volume is the number of shares traded during a given period. Every completed transaction involves both a buyer and a seller, so volume alone cannot reveal which side was driving the activity.

For example, suppose a stock that normally trades 100 ten-thousand shares per day records 300 ten-thousand shares today. Its relative trading volume would be calculated as follows.
\[
\text{Relative volume}=\frac{300\text{ ten-thousand}}{100\text{ ten-thousand}}=3\text{ times}
\]
This confirms that trading activity was 3 times its usual level. However, determining whether those 300 ten-thousand shares represented accumulation by a particular institution or the absorption of substantial selling volume requires additional data.
| Price and Volume Changes | Possible Interpretation |
|---|---|
| Rising price + increasing volume | Greater participation in the upward move |
| Falling price + increasing volume | Potential increase in selling pressure |
| Sideways price + increasing volume | Large-scale exchange of shares between buyers and sellers |
| Rising price + decreasing volume | Potential weakening of participation in the upward move |
What matters more than the increase in volume itself is how the stock price responded at the price levels where trading was concentrated.
U.S. brokerage Charles Schwab also describes volume as a tool for confirming price movements. Its guidance suggests that a breakout accompanied by increasing volume may be meaningful, but price and volume should be analyzed together.
2. How Can OBV Help Distinguish Accumulation From Distribution?
On-Balance Volume (OBV) is a cumulative indicator that adds the day's trading volume when a stock closes higher than the previous day and subtracts it when the stock closes lower.
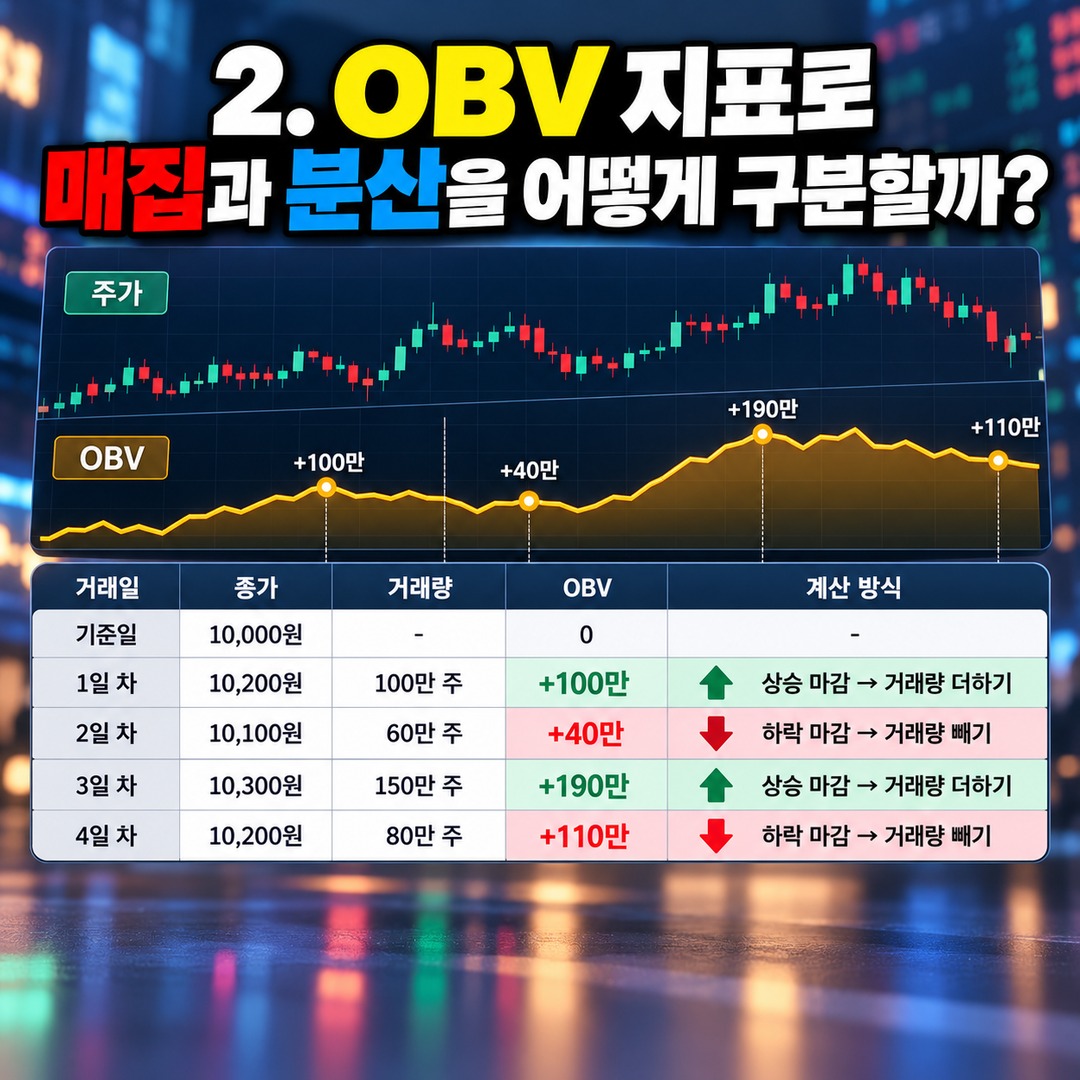
It combines price movements and trading volume to help assess changes in buying and selling pressure.
The calculation is straightforward.
If today's closing price is higher than the previous day's, add the trading volume.
If today's closing price is lower than the previous day's, subtract the trading volume.
If today's closing price is unchanged from the previous day, leave OBV unchanged.
How Does the Calculation Work With Actual Numbers?
The following is a hypothetical stock used to illustrate the calculation. The starting OBV is assumed to be 0.
| Trading Day | Closing Price | Trading Volume | OBV |
|---|---|---|---|
| Reference day | KRW 10,000 | - | 0 |
| Day 1 | KRW 10,200 | 100 ten-thousand shares | +100 ten-thousand |
| Day 2 | KRW 10,100 | 60 ten-thousand shares | +40 ten-thousand |
| Day 3 | KRW 10,300 | 150 ten-thousand shares | +190 ten-thousand |
| Day 4 | KRW 10,200 | 80 ten-thousand shares | +110 ten-thousand |
Author's calculation. This example assumes a reference-day OBV of 0 and does not represent actual stock data.
On day 4, the closing price is KRW 10,200, the same as on day 1. However, OBV has increased by 110 ten-thousand from its starting level.
When a stock trades around similar price levels while OBV rises, it means relatively more trading volume occurred on days when the stock closed higher.
In technical analysis, this pattern is used as a clue when evaluating the possibility of accumulation.
Conversely, if the stock price rises but OBV fails to exceed its previous high, the pattern may be interpreted as a bearish divergence, suggesting that the volume trend is not confirming the price increase.
However, OBV assigns an entire day's trading volume to one direction based solely on whether the closing price rose or fell. It does not distinguish actual buy-side executions from sell-side executions or track the transactions of specific investors.
3. Why Can a Stock Remain Weak Even When OBV Is Rising?
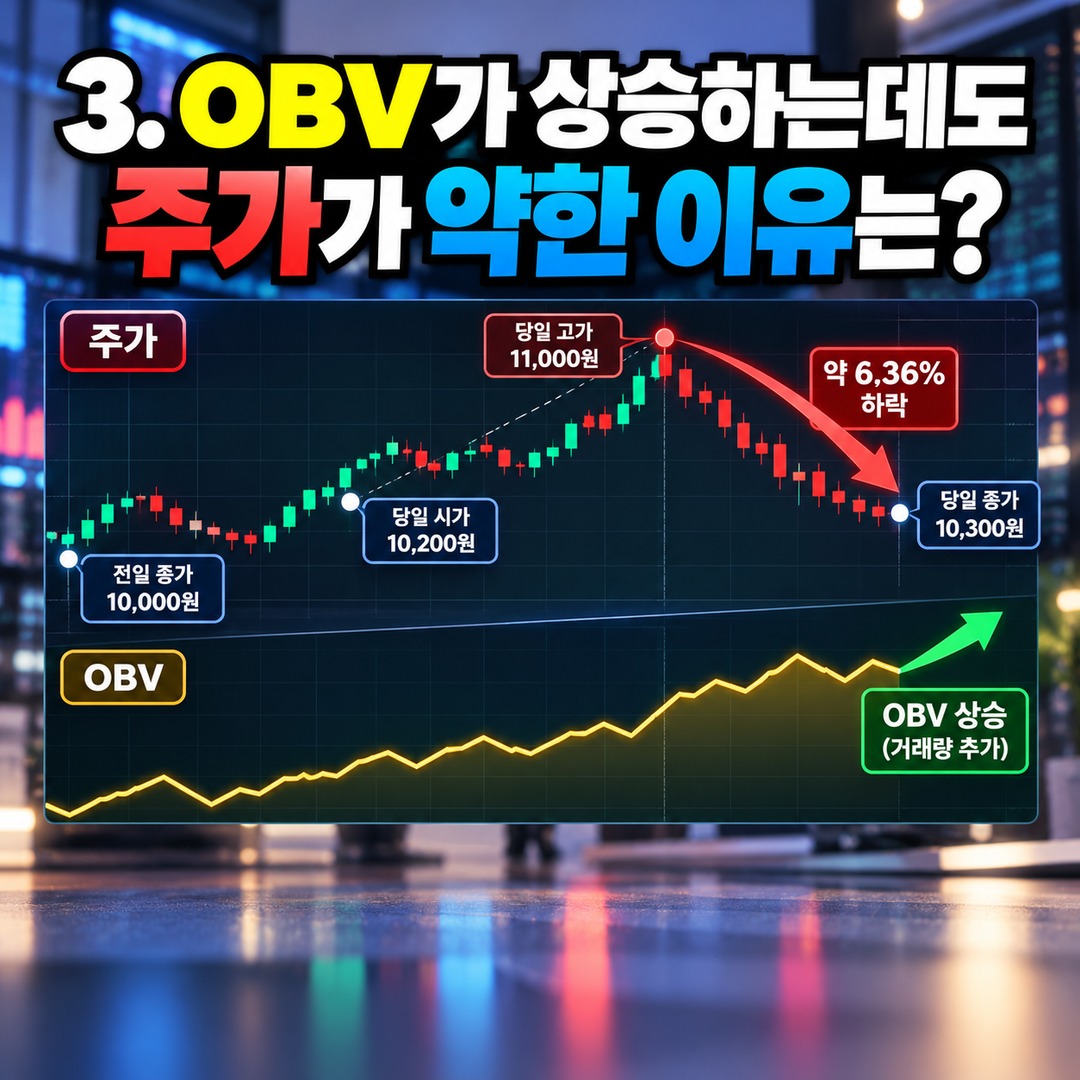
A rising OBV does not necessarily mean the stock price will rise.
OBV increases whenever today's closing price is higher than the previous day's closing price. It does not directly account for how far the price retreated from its intraday high.
Consider the following hypothetical trading session.
| Item | Price |
|---|---|
| Previous day's close | KRW 10,000 |
| Today's opening price | KRW 10,200 |
| Today's high | KRW 11,000 |
| Today's low | KRW 10,100 |
| Today's closing price | KRW 10,300 |
The stock closed 3% higher than the previous day.
As a result, the entire day's trading volume is added to OBV.
However, the stock fell approximately 6.36% from its intraday high of KRW 11,000 to its closing price of KRW 10,300.
When a stock gives back a substantial portion of its intraday gains, a rising OBV alone is not enough to conclude that buying pressure is strong.
The A/D indicator can provide an additional perspective in this situation.
4. How Is the A/D Indicator Different From OBV?
The Accumulation/Distribution Line (A/D) is an indicator that measures where the closing price falls within the day's high-low range and incorporates trading volume into that calculation.
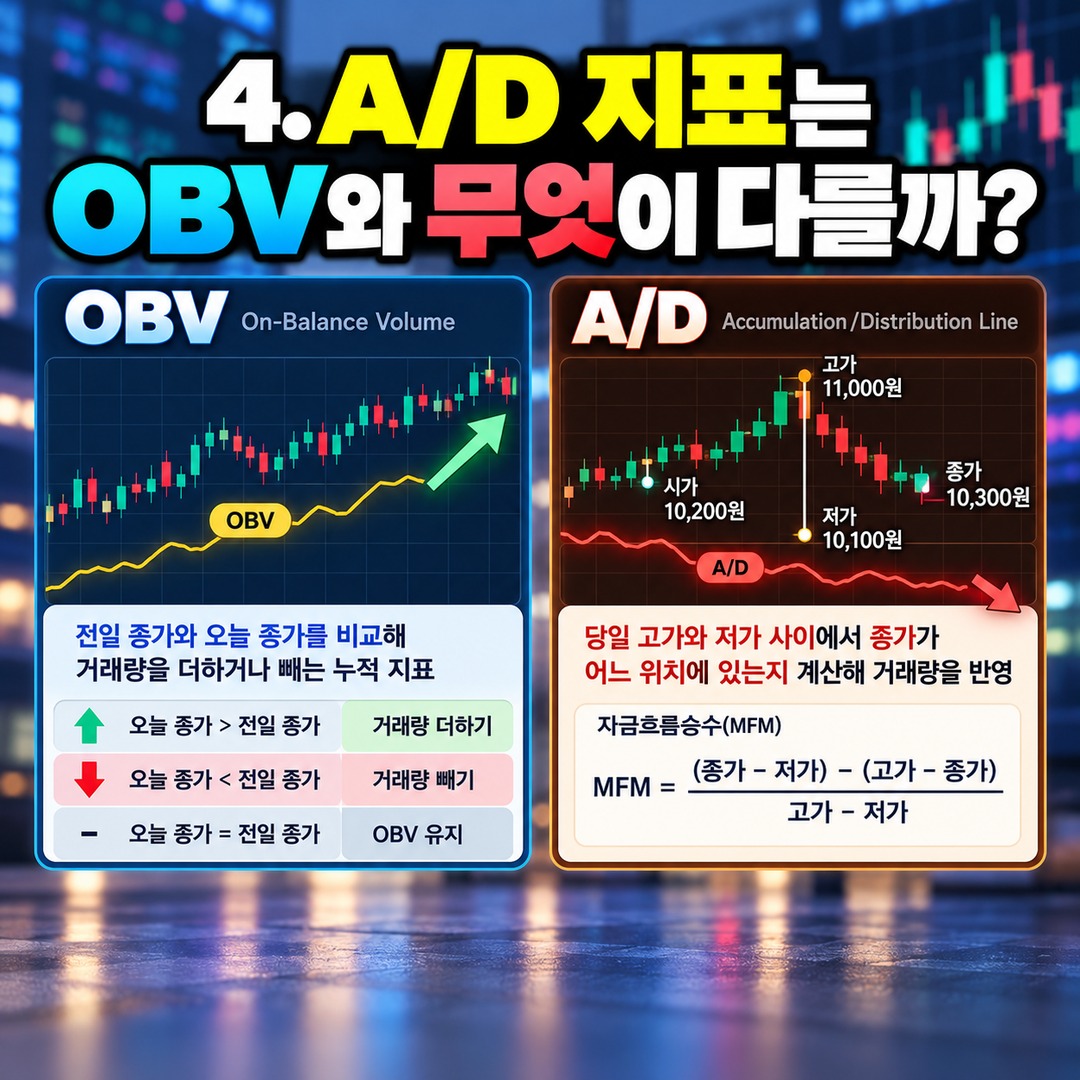
While OBV compares today's closing price with the previous day's, A/D focuses on where the closing price falls within the day's trading range.
The Money Flow Multiplier (MFM) used to calculate A/D is defined as follows.
\[
MFM=\frac{(\text{Close}-\text{Low})-(\text{High}-\text{Close})}{\text{High}-\text{Low}}
\]
Applying the earlier hypothetical example gives the following result.
\[
\frac{(10,300-10,100)-(11,000-10,300)}{11,000-10,100}
=-0.556
\]
Assuming daily trading volume of 300 ten-thousand shares, the money flow volume would be equivalent to approximately -166.7 ten-thousand shares.
This is a volume-weighted figure incorporated into the cumulative A/D value, not the actual number of shares sold on a net basis.
The two indicators can point in opposite directions on the same trading day.
| Indicator | Result | Reason |
|---|---|---|
| OBV | Rising | Closing price higher than the previous day |
| A/D | Falling | Closing price near the day's low |
This distinction matters.
Even if a stock closes higher than the previous day, A/D may indicate weakness when the price has fallen substantially from its intraday high.
However, A/D also does not directly reveal the trading activity of institutional or foreign investors. Another limitation is that its calculation does not account for the opening gap up or down relative to the previous day's price.

5. What Should You Check First When Assessing Possible Accumulation?
When using OBV and A/D together, changes over multiple trading days matter more than whether a single indicator rises or falls.
Following these steps can help distinguish conflicting signals.
First, Check How Much Trading Volume Has Increased Relative to Normal
Compare the day's trading volume with the average volume over the most recent 20 trading days.
However, directly comparing intraday volume with a full-day average can produce misleadingly exaggerated results because the trading periods differ.
During the trading session, it is more appropriate to compare volume with historical volume recorded at the same time of day.
Second, Compare the Highs and Lows of Price and OBV
If the stock price reaches a higher high but OBV fails to exceed its previous high, the upward move may lack confirmation.
Conversely, if the stock price moves sideways while OBV gradually rises, it may be worth examining whether buying pressure is accumulating.
Third, Use the Direction of A/D to Assess the Closing Price's Position
If OBV rises while A/D continues to fall, the stock may be closing higher than the previous day while also finishing weakly within each day's trading range.
Rather than drawing conclusions from a single day's disagreement, compare the trends over several trading sessions.
Fourth, Compare the Indicators With Actual Trading Data by Investor Category
For stocks listed in South Korea, investors can also consult trading data by investor category provided by the Korea Exchange's information data system and securities firms' home trading systems (HTS) and mobile trading systems (MTS).
However, even net buying data for institutional and foreign investors does not establish any particular investor's ultimate holding intentions or guarantee future trading behavior.
Official verification source: Korea Exchange Information Data System
6. Is It Safe to Buy When Both OBV and A/D Are Rising?
Even when both indicators rise together, a successful purchase is not guaranteed.
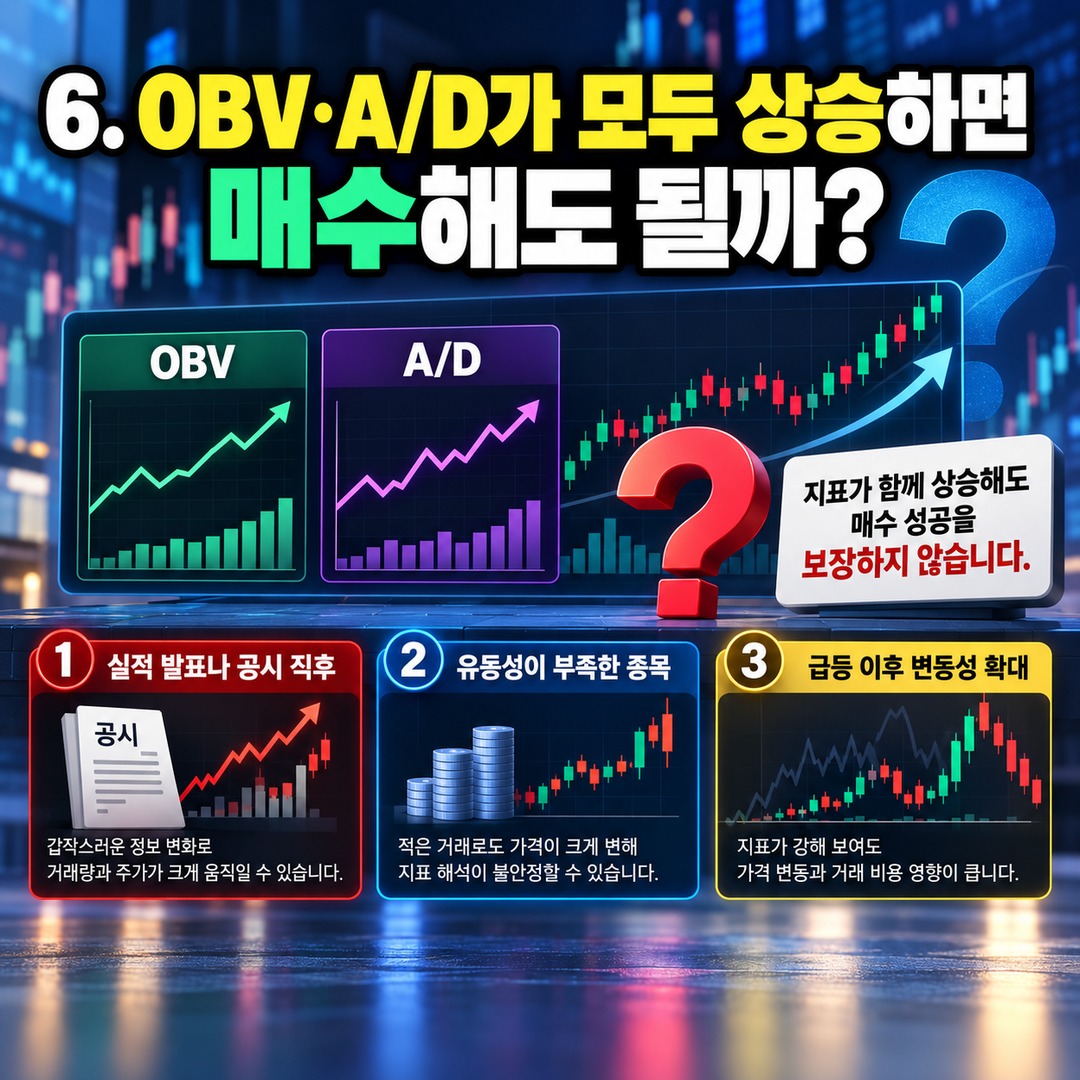
Both indicators are calculated using historical prices and trading volume. Because they process the same trading volume in different ways, they cannot be treated as two completely independent pieces of evidence.
Particular caution is needed in the following situations.
The first is immediately after an earnings announcement or regulatory disclosure. When new information causes sharp movements in trading volume and stock prices, previously established indicator trends can change rapidly.
The second involves stocks with limited liquidity. Even relatively small trades can cause large price movements, making indicator interpretations less reliable.
The third is a period of heightened volatility following a sharp rally. Even when indicators appear strong, price fluctuations and trading costs can lead to very different actual trading results.
To evaluate a strategy based on these indicators, investors must consider not only entry conditions but also exit conditions, commissions, taxes, slippage, the analysis period, and stock selection criteria.
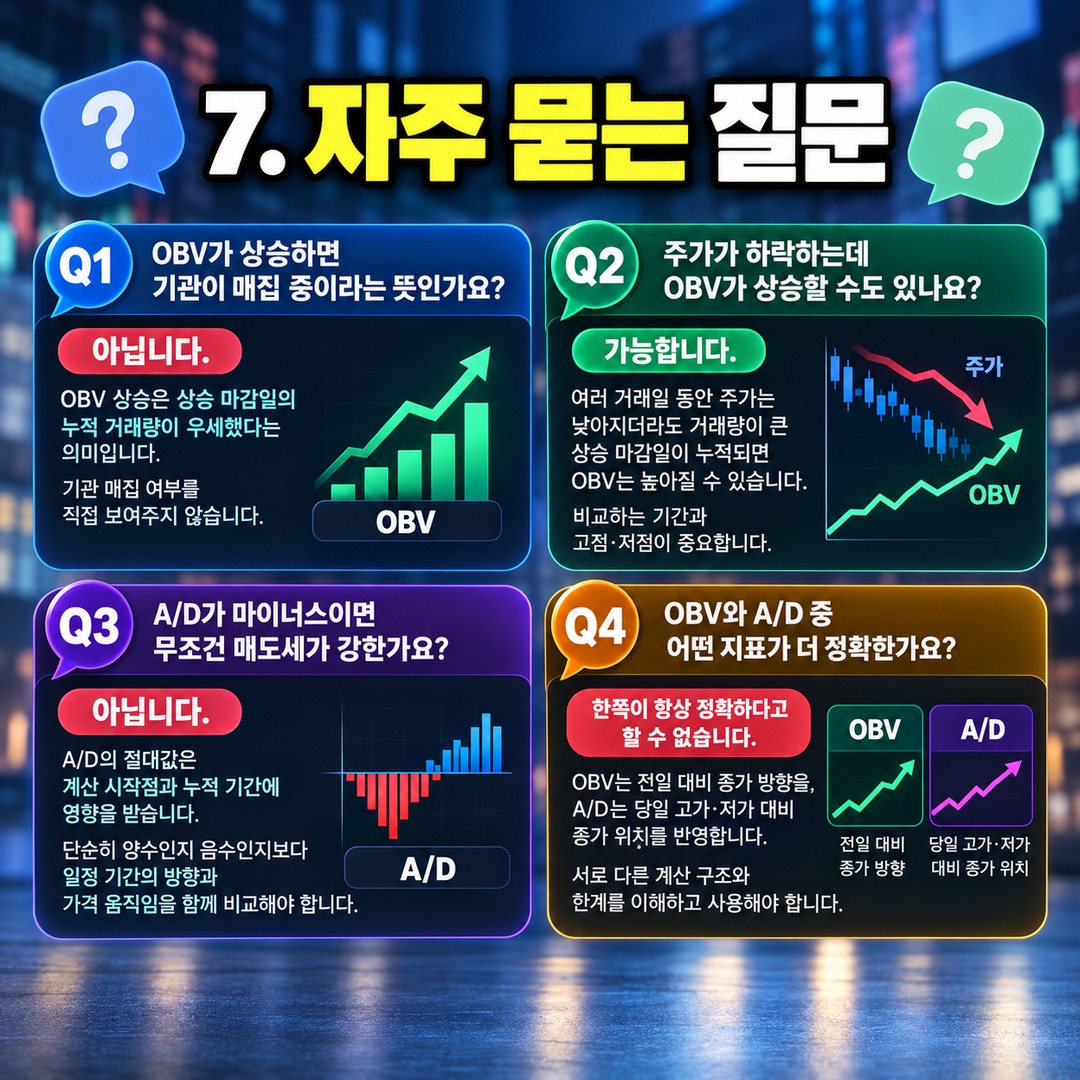
7. Frequently Asked Questions
Q. Does Rising OBV Mean Institutions Are Accumulating Shares?
No. Rising OBV means that cumulative trading volume on up-closing days has outweighed volume on down-closing days. It does not directly show whether institutions are accumulating shares.
Q. Can OBV Rise While the Stock Price Falls?
Yes. Even if a stock's price declines over several trading days, OBV can rise if days with higher closing prices account for larger volumes. The comparison period and the respective highs and lows are important.
Q. Does a Negative A/D Value Always Mean Selling Pressure Is Strong?
No. The absolute value of A/D depends on the starting point of the calculation and the period over which values have accumulated. Rather than focusing simply on whether the value is positive or negative, investors should compare its direction over a given period with the corresponding price movements.
Q. Which Indicator Is More Accurate, OBV or A/D?
Neither indicator is consistently more accurate in every situation. OBV reflects the direction of the closing price relative to the previous day, while A/D reflects the closing price's position relative to the day's high and low. Investors should understand their different calculation methods and limitations before using them.
Conclusion: Agreement Between Price and Volume Indicators Matters More Than Volume Alone
A sharp increase in stock trading volume alone is not enough to conclude that accumulation or large-scale selling is taking place.
OBV shows cumulative trading volume based on changes in the closing price relative to the previous day, while A/D incorporates trading volume according to where the closing price falls within the day's price range.
Therefore, when analyzing a stock experiencing a volume surge, it is reasonable to examine the stock's price trend, OBV highs and lows, the direction of A/D, and actual trading data by investor category together.
In particular, when OBV is rising but A/D is falling, investors should first investigate why the two indicators are producing different signals.
Indicators are supplementary tools for interpreting price movements, not definitive signals for executing trades.
※ This article is provided for informational purposes to help readers understand market movements. It is not an investment recommendation concerning any particular stock or asset. Investors are responsible for their own final decisions and investment outcomes.