

Why a Stock Falls After Trading Volume Surges 2 Times and Breaks Its Previous High: The Difference the Closing Price Makes
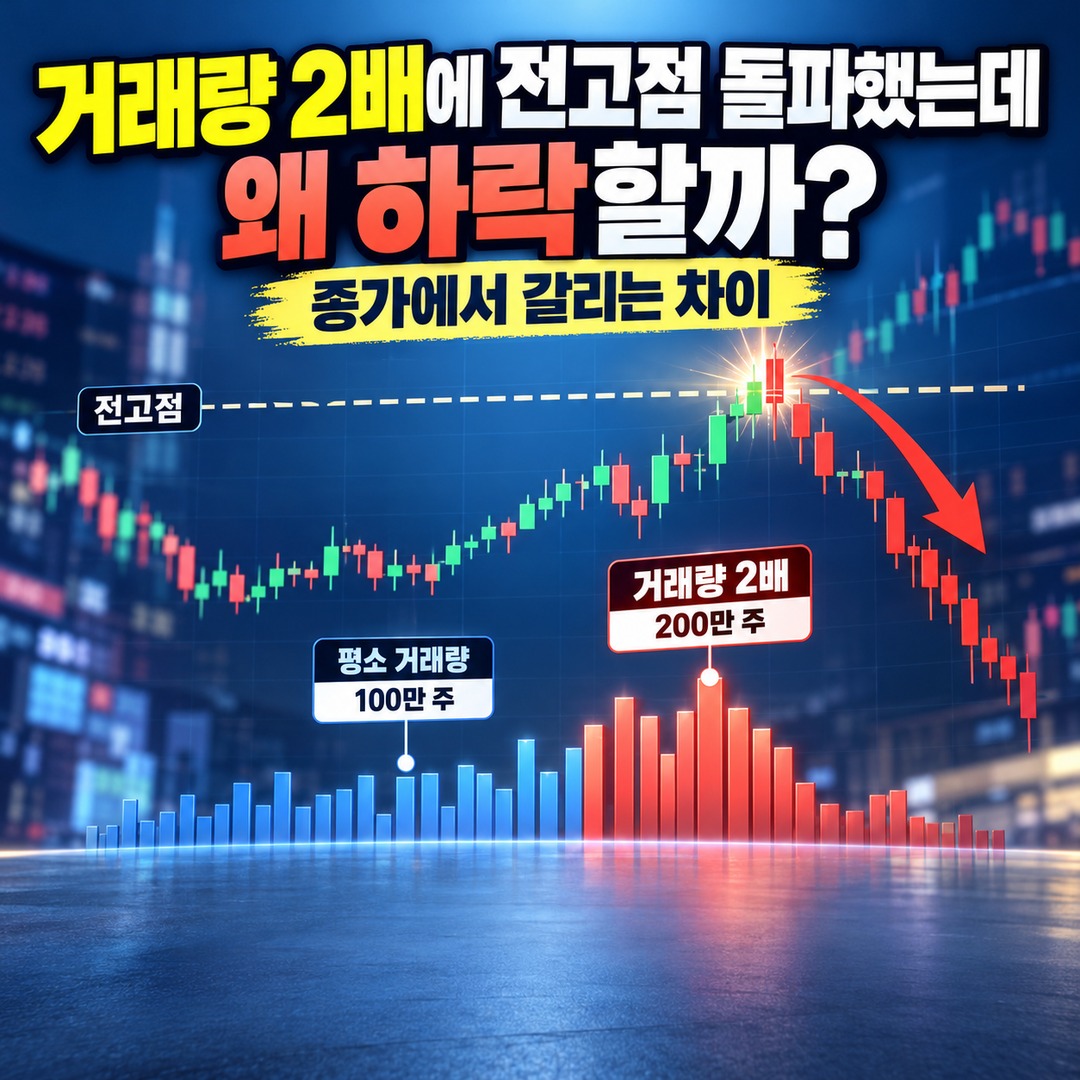
If a stock's trading volume rises to 2 times its usual level and the price breaks above its previous high but then falls, the first thing to check is whether it held the breakout level. Higher volume means more active trading, not necessarily that buyers remained in control. In particular, if the price moves above its previous high during the session but closes back below it, the possibility of a failed breakout deserves attention.
Even when trading volume reaches 2 times its usual level, a stock that closes above its previous high should be interpreted differently from one that closes below it.
Drawing on technical analysis principles available as of 2026-10-26, this article examines what investors should distinguish when a stock falls after a high-volume breakout. It does not analyze the actual price movements of any particular stock.
Why Does a Stock Fall When Trading Volume Increases 2 Times?
Trading volume measures the number of shares traded during a given period. An increase of 2 times in trading volume does not, by itself, establish that buying pressure was stronger than selling pressure.

A stock trade takes place when a buyer's order matches a seller's order. A sharp increase in trading volume simply means that a larger number of shares changed hands.
For example, suppose a stock normally trades 100 ten-thousand shares per day, but 200 ten-thousand shares are traded during a particular session. The increase in trading volume would be 100%.
However, trading 200 ten-thousand shares does not mean that net buying amounted to 200 ten-thousand shares. Every completed transaction involves both a buyer and a seller.
If a stock rises and then falls, the balance between demand from buyers willing to trade at higher prices and the supply of shares offered for sale may have changed.
In trading-volume analysis materials published on 2026-06-05, U.S. brokerage Charles Schwab explains that a surge in volume can support an upward trend but may also occur when a trend is approaching exhaustion.
Therefore, trading volume reaching 2 times its usual level cannot, on its own, confirm either a continuation of the rally or a reversal into a decline.
What Changes When a Stock Breaks Its Previous High but Closes Back Below It?
When evaluating a breakout above a previous high, it is important to distinguish between the intraday high and the closing price.

The previous high is an earlier peak price defined by the period being analyzed. Briefly exceeding that level during a trading session is not the same as maintaining a price above it through the close.
Fidelity's educational materials on technical chart patterns describe a move in which the price breaks through resistance but quickly returns below the breakout level as a false breakout.
Two situations can be compared on an actual price chart.
In the first situation, the stock breaks above its previous high and also closes above that level. Because trading ends above the former resistance level, investors can continue observing whether the breakout holds.
In the second situation, the stock exceeds its previous high intraday but closes back below it. In this case, an intraday breakout alone is not enough to conclude that an upward trend has been established.
However, closing below the previous high does not mean the stock must also decline during the next trading session. The chart may develop differently depending on whether the price recovers the previous high or continues forming lower lows.
A Numerical Comparison Makes a 2-Times Volume Breakout Easier to Understand
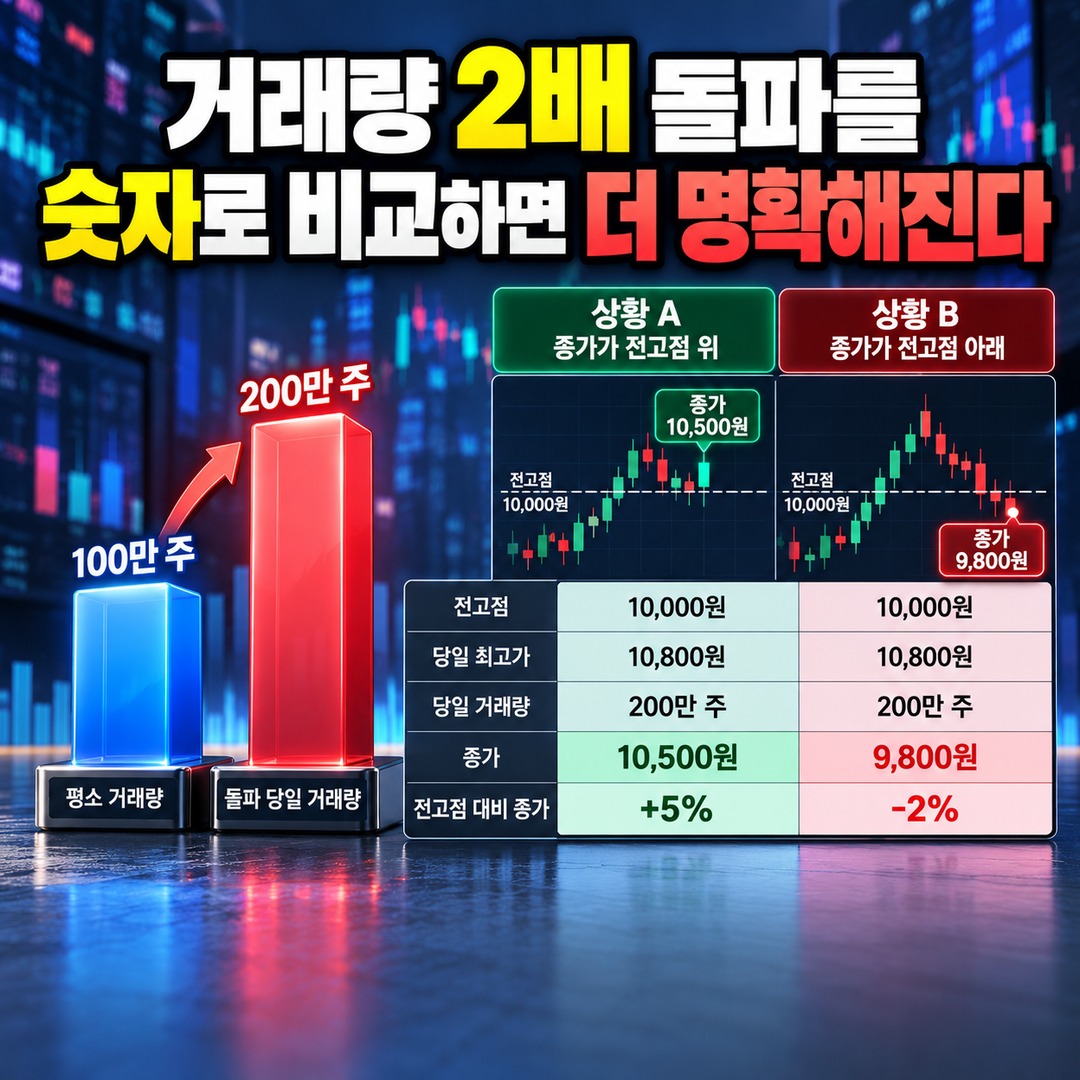
The following is a hypothetical example, not an actual stock's trading record. The calculations compare how different closing prices can change the interpretation of a breakout even when the previous high and trading volume are identical.
Assume hypothetical Stock A has the following characteristics.
Previous high: KRW 10,000
Usual average daily trading volume: 100 ten-thousand shares
Trading volume on the breakout day: 200 ten-thousand shares
Intraday high on the breakout day: KRW 10,800
Trading volume increased by 100% compared with its usual level, while the intraday high was 8% above the previous high.
Now consider two different closing-price scenarios.
| Comparison | Scenario A | Scenario B |
|---|---|---|
| Previous high | KRW 10,000 | KRW 10,000 |
| Intraday high | KRW 10,800 | KRW 10,800 |
| Daily trading volume | 200 ten-thousand shares | 200 ten-thousand shares |
| Closing price | KRW 10,500 | KRW 9,800 |
| Closing price relative to previous high | +5% | -2% |
Hypothetical example; calculations by the author. Trading costs, taxes, and price movements during the following trading session are excluded.
In Scenario A, the stock gives back part of its intraday gains but still closes above its previous high.
In Scenario B, the stock breaks above the previous high by 8% intraday but closes at a price 2% below the previous high.
Trading volume is 2 times its usual level in both scenarios. The difference is that Scenario B fails to hold the breakout level.
The percentage decline from the intraday high to the closing price in Scenario B is calculated as follows.
(KRW 9,800 - KRW 10,800) ÷ KRW 10,800 × 100 = approximately -9.26%
This means there was a difference of approximately 9.26% between the intraday high and the closing price.
This calculation shows how much of the intraday advance was given back. It does not reveal who sold, why they sold, or how far the stock might decline afterward.
Does a Long Upper Wick Mean Selling Pressure Was Strong?
If a long upper wick forms after a stock breaks above its previous high, it means the price reached a higher level during the session but could not maintain that level.
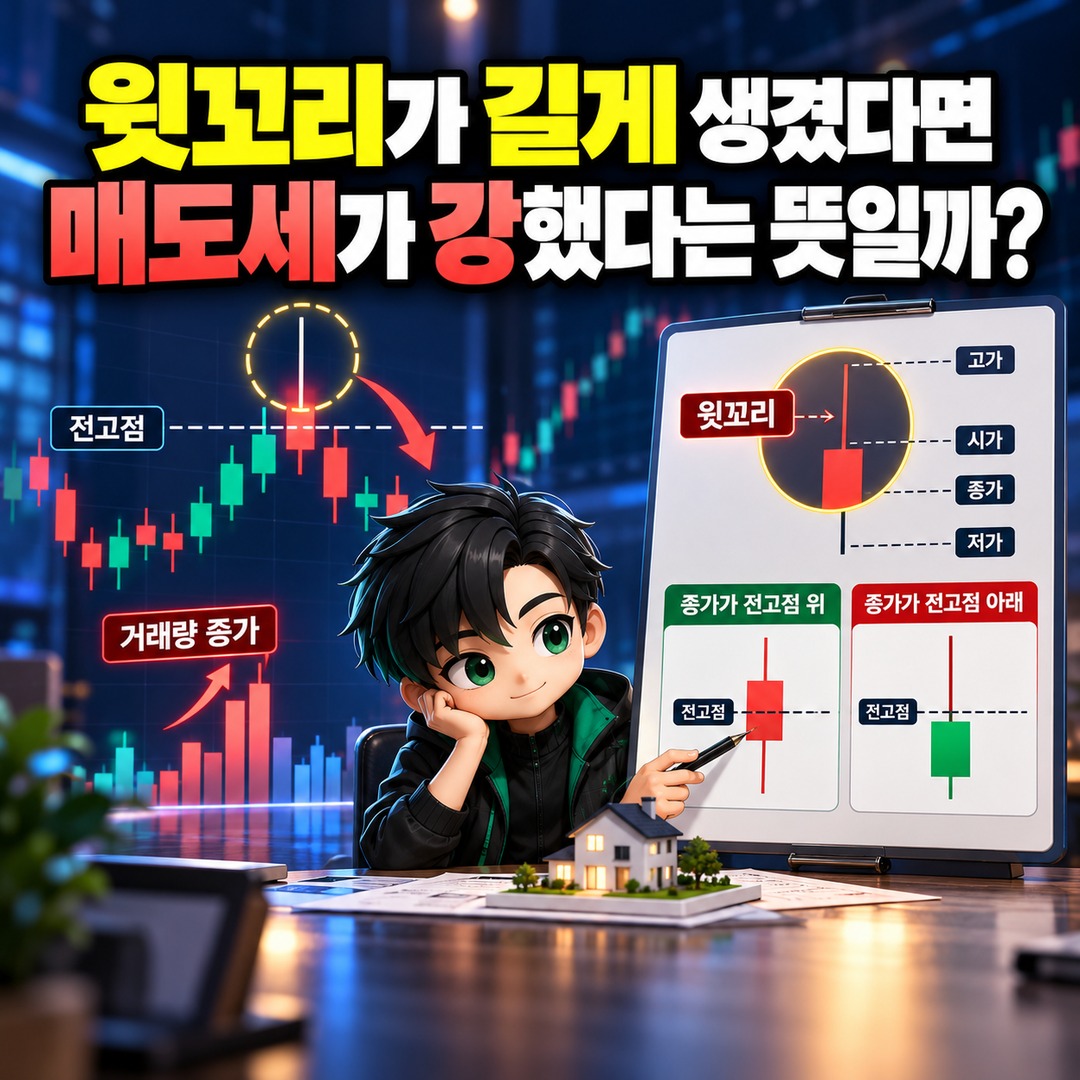
The upper wick of a candlestick represents the distance between the session's high and whichever is higher, the opening price or the closing price.
When a long upper wick appears alongside increased trading volume, it indicates that substantial buying and selling activity took place at higher price levels.
However, a long upper wick alone does not prove that a particular investor sold a large number of shares.
Even with an identical upper wick, the breakout's status differs depending on whether the stock closes above its previous high or falls back below it.
The price movement during the next trading session should also be considered.
A stock that falls below its previous high and subsequently recovers it should not be treated the same as one that fails to reclaim that level while continuing to make lower lows.

Is a Decline on Falling Volume a Healthy Pullback?
A decline accompanied by falling trading volume can be distinguished from one accompanied by rising volume. However, lower volume alone is not enough to confirm that the decline is a healthy pullback.
In its analysis of trading volume and price trends, Charles Schwab describes declines on increasing volume and declines on decreasing volume as different types of trend signals.
In technical analysis, traders sometimes watch for prices pulling back on declining volume after an advance.
Conversely, a move below an important support level accompanied by increasing trading volume may be interpreted as a sign of strengthening downward pressure.
The important consideration is not just trading volume, but the price level at which the decline stops or continues.
If a stock that broke above its previous high subsequently returns to that price area, investors can observe whether the former resistance level begins acting as a new support level.
However, support is not a guaranteed floor that prevents further price declines. A stock may fall below support and then recover, or its decline may deepen.
What to Check, Step by Step, When a Stock Falls After Breaking Its Previous High
Rather than making a buy or sell decision based solely on 2-times trading volume and a breakout above the previous high, it is more useful to establish a sequence of chart observations.

First, identify the reference period used to define the previous high. The relevant price level will differ depending on whether it is the high over the past month, the high over 6 months, or a new 52-week high.
Next, compare the closing price on the breakout day with the previous high. This distinguishes a breakout that occurred only intraday from one that held through the close.
Then, use a consistent basis for comparing trading volume. The meaning of 2-times volume depends on whether the day's trading volume is compared with a single previous session or the average over the most recent 20 trading days.
In particular, directly comparing intraday trading volume with the full-day volume of a previous session uses inconsistent time periods.
Finally, observe price movements and trading volume together after the breakout.
Watch whether the stock reclaims its previous high, remains below the breakout level, and how trading volume changes during the decline.

If you are considering short-term trading, also assess your entry price, the amount of loss you can afford, trading costs, and liquidity. No single technical indicator can eliminate the risk of losses.
Price Action After the Breakout Matters More Than 2-Times Trading Volume
A breakout above a previous high accompanied by increased trading volume can indicate stronger market participation. However, high volume alone does not provide sufficient evidence that the rally will continue.
A stock that closes above its previous high and one that breaks above it intraday but then closes below it display different price behavior, even if they record the same trading volume.
Likewise, closing above the previous high does not guarantee that the stock will rise the following day.
Rather than interpreting 2-times trading volume, a breakout above the previous high, and a long upper wick separately, these signals should be examined together as part of the overall price movement.
The first price level to mark on the chart is the previous high that served as the breakout threshold, rather than the intraday peak. Whether the stock held that level at the close, and whether it subsequently reclaimed or lost it, provides useful information for the next assessment.
※ This article is provided for informational purposes to help readers understand market behavior. It is not a recommendation to invest in any particular stock or asset. All final investment decisions and associated responsibilities rest with the individual investor.