

Richard Dennis’s Turtle Trading: Why the 2N Stop and 1% Position Rule Are Put to the Test in Sideways Markets

Richard Dennis’s Turtle Trading is a trend-following strategy that enters on a 20-day or 55-day price breakout and uses recent volatility, N, to set stop distances and position size. The key is managing 2N stops, risk per account, and consecutive losses during periods without a trend, rather than focusing only on entry signals.
20-day and 55-day breakouts differ in entry speed, while stops and position size vary with volatility. So trading based only on the numbers 20-day and 55-day can make it easy to miss the original system’s risk-management structure.
What is the difference between a 20-day breakout and a 55-day breakout?
A 20-day breakout corresponds to System 1 (System 1), while a 55-day breakout corresponds to System 2 (System 2). Both systems use Donchian channel breakouts: buy when the price rises above the high for the preceding period, and sell when it falls below the low.
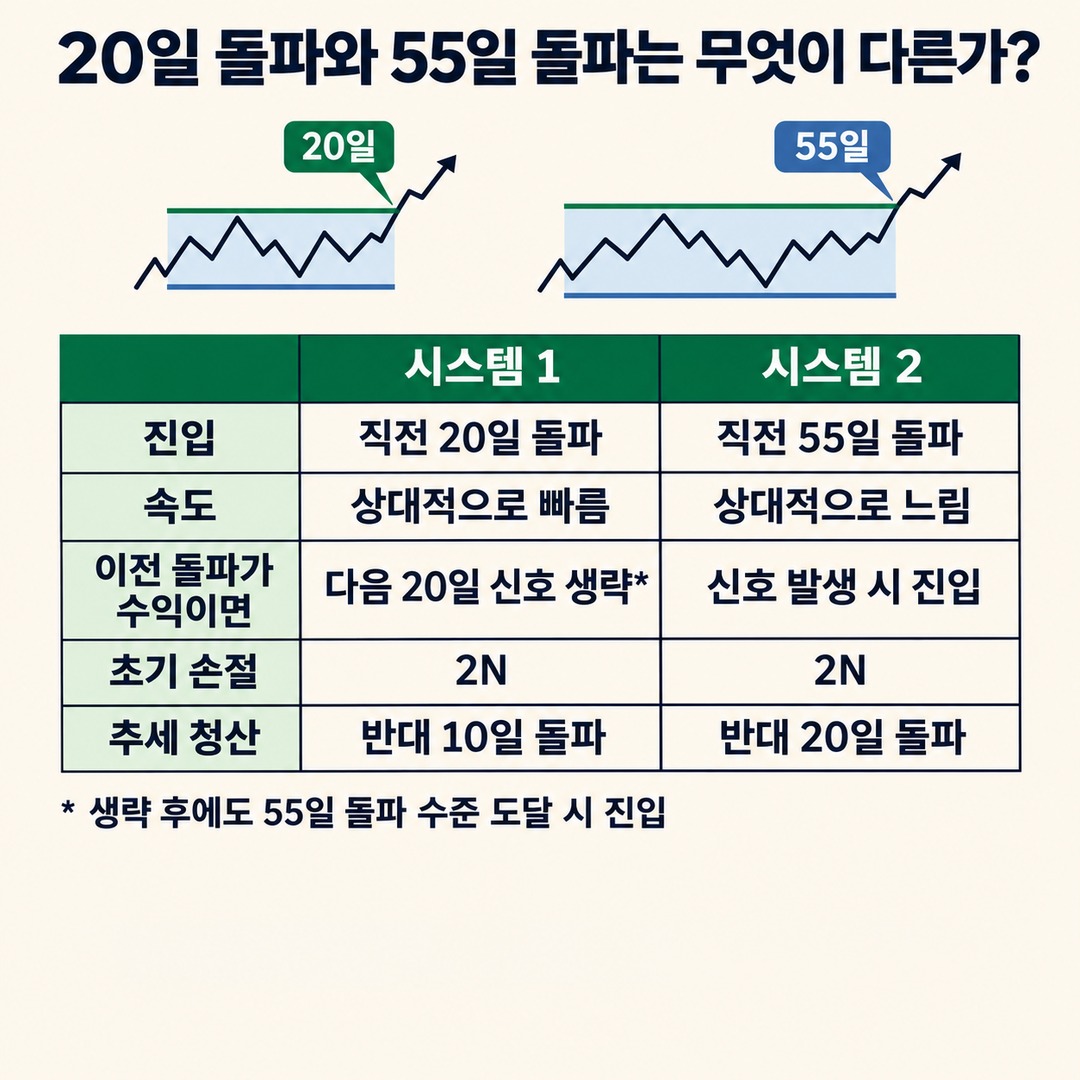
The difference between the two entry methods can be found in The Original Turtle Trading Rules, a 2003-year document that published the original rules of the Turtle system taught by Richard Dennis and William Eckhardt in 1983.
| Category | System 1 | System 2 |
|---|---|---|
| Entry criterion | Break above or below the high or low of the preceding 20 days | Break above or below the high or low of the preceding 55 days |
| Characteristic | Relatively earlier entry | Relatively later entry |
| After a previous winning breakout | Skip the next 20-day signal | Enter when a signal occurs |
| Initial stop | 2N | 2N |
| Trend exit | Breakout in the opposite direction over 10 days | Breakout in the opposite direction over 20 days |
There is one rule that is easy to overlook.
System 1 does not simply buy every time the price breaks above the 20-day high. If the previous System 1 breakout was deemed a profitable trade, it skips the next 20-day breakout signal.
However, even after skipping that signal, there was a safeguard: enter if the price reaches the 55-day breakout level. This was called a Failsafe Breakout.
System 2 takes 55-day breakout signals regardless of whether the previous trade was profitable.
Ignoring this difference can lead you to confuse the original Turtle system with a simple Donchian breakout strategy based on 20-day and 55-day periods.
How does N, which determines stop distance, differ from a standard ATR?
N is the 20-day volatility measure used in the Turtle system. It is often described as the same concept as ATR, but the original rules use Wilder-style smoothing rather than simply taking the arithmetic average of the recent 20-day price ranges.
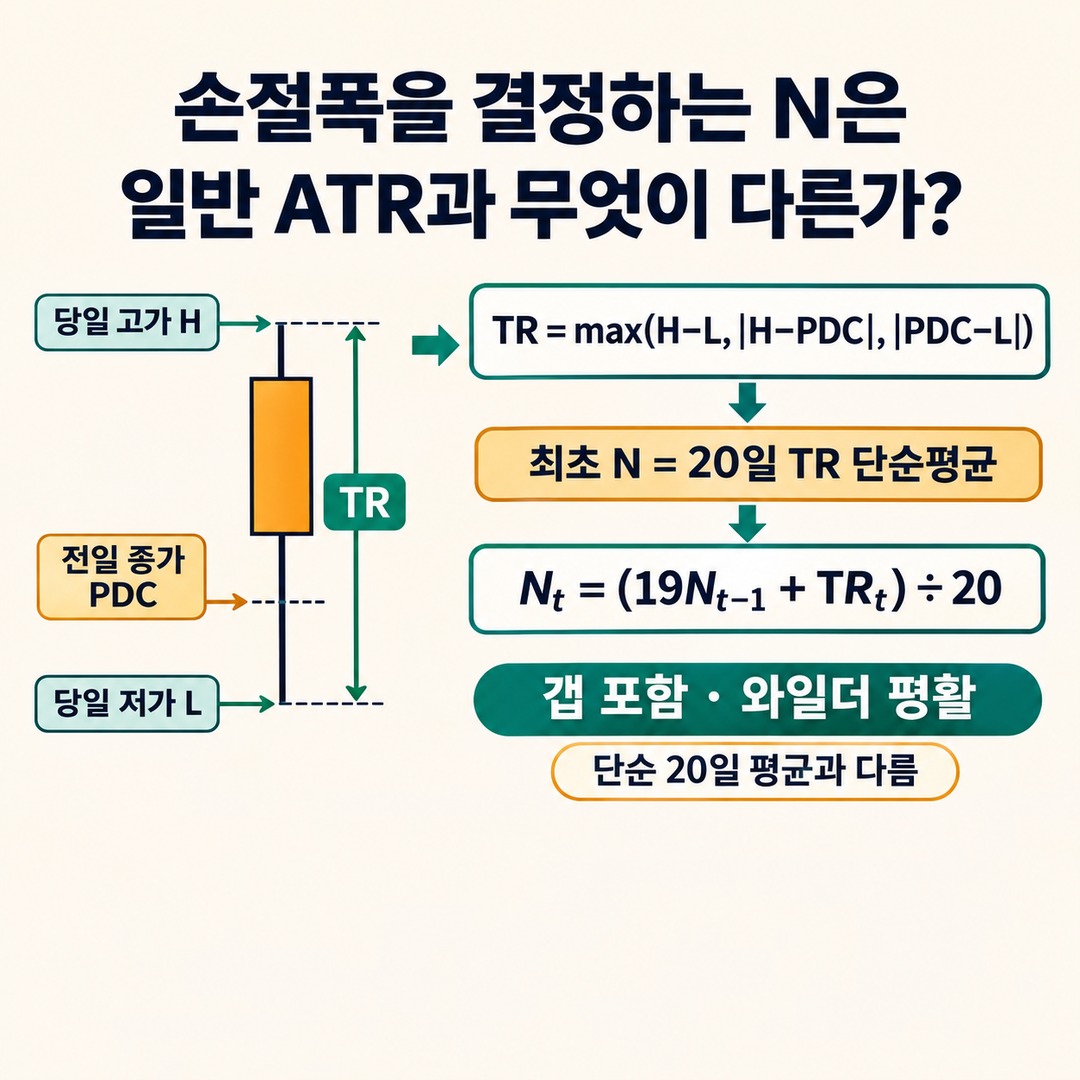
First, calculate the day's True Range (TR).
TR = max(H−L, |H−PDC|, |PDC−L|)
H: the day's high
L: the day's low
PDC: the previous day's close
The formula for calculating the next day’s value using the previous N is as follows.
Nt=19Nt−1+TRt20The initial N is calculated as the simple average of 20 days of TR.
This calculation matters because it reflects not only intraday price movements but also gaps between the previous close and the current day's price in the volatility measure.
For example, even if the difference between the day's high and low is small, TR can be large if the opening price is far from the previous day's close.
So N is different from a candle’s body or the day’s percentage change.
How far from the entry price is the 2N stop?
The Turtle system’s standard stop is placed 2N away from the entry price.
Long: entry price - 2N
Short: entry price + 2N
For example, if N is KRW 200, then 2N is KRW 400.
| Trade direction | Entry price | Initial stop price |
|---|---|---|
| Long | KRW 10,000 | KRW 9,600 |
| Short | KRW 10,000 | KRW 10,400 |
The initial stop distance does not change depending on whether the entry is a 20-day or a 55-day breakout.
Both systems use the same N-based risk management approach.
However, for a more volatile instrument, N increases, widening the distance to the stop price and reducing the position size accordingly.
This is what sets the method apart from using only a fixed stop percentage.
Calculate the actual position size using the account’s 1% and N
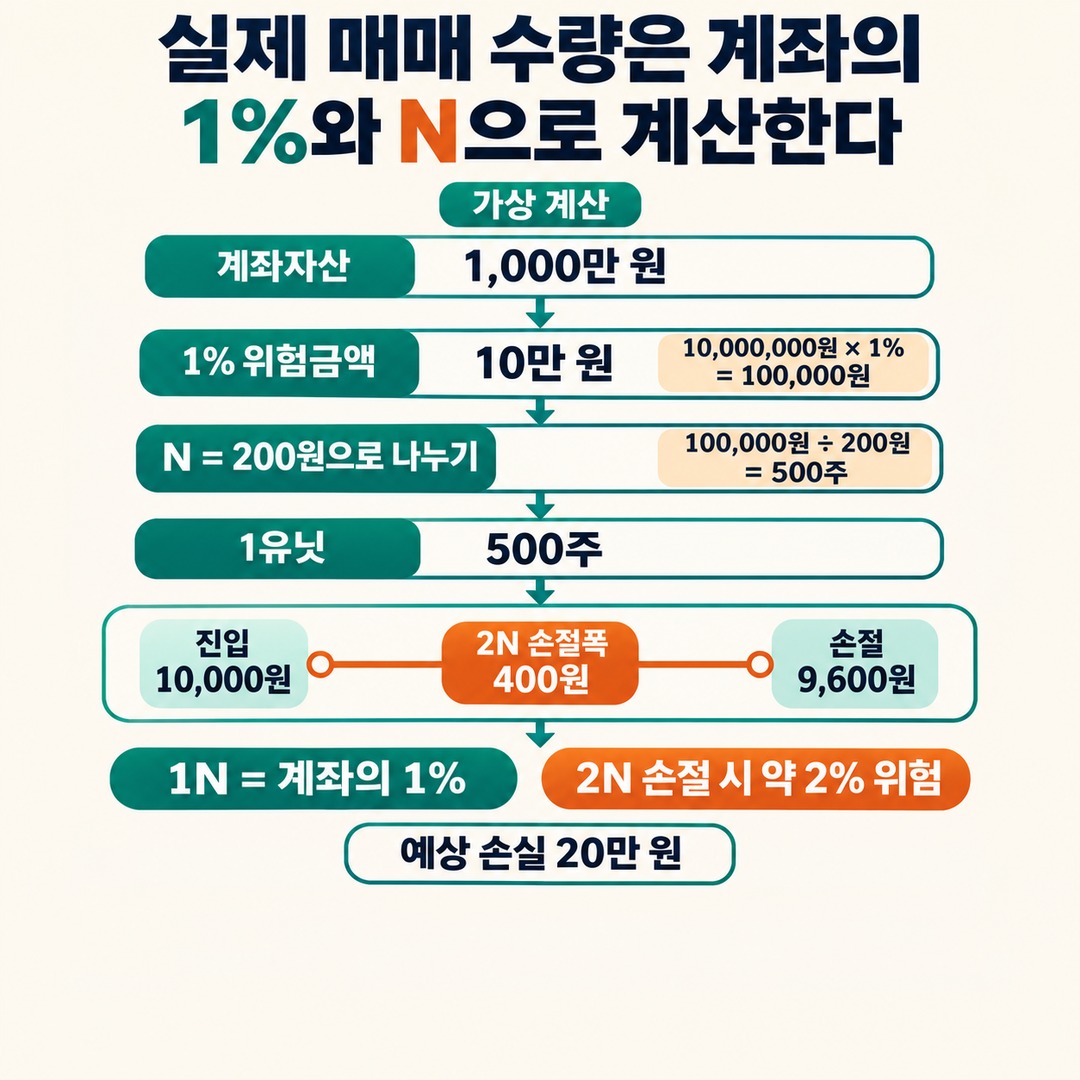
In the Turtle system, a position unit (Unit) is set so that a 1N price movement results in a profit or loss of about 1% of the account’s equity.
The calculation in the original rules is structured as follows.
Unit = account equity × 0.01N × point value
If the price movement per 1 share can be calculated directly, as with stocks, the formula can be simplified as follows.
Position size = account equity × 1%N
For actual futures or currency products, you must account for the contract multiplier, tick value, converted currency, and other factors.
Hypothetical example: account KRW 10,000,000, N KRW 200
The following hypothetical example illustrates the calculation method; it is not an actual trading record of the original Turtle traders.
Account equity: KRW 10,000,000
1N risk amount: KRW 100,000
N: KRW 200
Entry price: KRW 10,000
Initial stop price: KRW 9,600
The calculation is as follows.
10,000,000 × 1% = 100,000100,000 ÷ 200 = 500 shares
Therefore, one 1 unit is 500 shares.
Assuming the trade is filled at the stop price of KRW 9,600, the loss is as follows.
500 × (10,000 − 9,600) = KRW 200,000
Hypothetical calculation result
Number of shares purchased
500 shares
Initial stop distance
KRW 400
Estimated loss
KRW 200,000
Loss as a share of account equity
2%
This calculation excludes additional losses from fees, taxes, slippage, and gaps. There is an important distinction here.
A 1N move represents 1% of the account, but the initial stop is 2N away, so the initial stop risk for one unit is about 2% of the account.
So the calculation changes if the commonly described 1% rule is interpreted directly as the maximum loss percentage per 1 trades.
Adding units also moves the stop price
The Turtle system did not buy the maximum position size all at once.
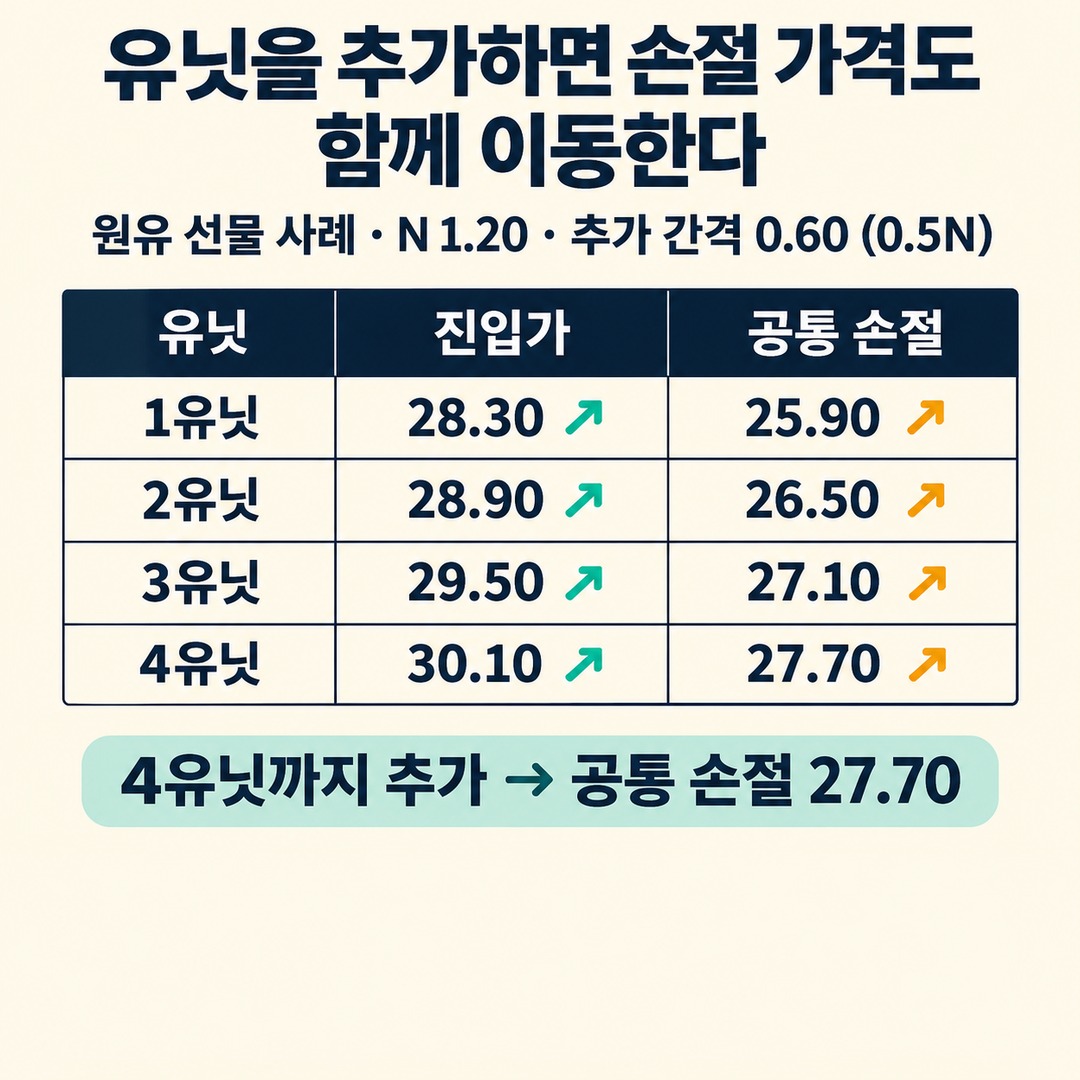
When the price moved in a favorable direction, units were added at intervals of 0.5N. A position in one direction in a single market could comprise a maximum of 4 units.
The key point is that the stop price for existing units was also adjusted as new units were added.
Consider the crude oil futures example included in the original document.
Market: crude oil futures
N: 1.20
55-day breakout entry: 28.30
Additional entry interval: 0.60
| Unit | Entry price | Shared stop price |
|---|---|---|
| 1 unit | 28.30 | 25.90 |
| 2 unit | 28.90 | 26.50 |
| 3 unit | 29.50 | 27.10 |
| 4 unit | 30.10 | 27.70 |
The figures above are from an example in the original Turtle rules document.
After entering the first unit, add a second when the price rises by 0.5N. Add the third and fourth units in the same way.
During this process, raise the stop price for existing units to manage risk across the entire position.
In this example, after entering the fourth unit, the stop price rises to 27.70.
Be careful not to misinterpret the 2% loss rule
The 2N stop risk for one unit is not the same figure as the risk of the full position made up of four units.
In the original example, N is 1.20, and for each unit, a 1N move corresponds to 1% of the account.
Once all four units have been added, calculate the price difference between each entry and the shared stop at 27.70 as follows.
First: 28.30 - 27.70 = 0.60
Second: 28.90 - 27.70 = 1.20
Third: 29.50 - 27.70 = 1.80
Fourth: 30.10 - 27.70 = 2.40
The total is 6.00, which equals 5N when divided by N, 1.20.
Therefore, under the original calculation’s assumption that each unit has the same size, the total position’s stop risk is about 5% of the account.
This should be distinguished from the 2% loss on a single unit. Gaps or execution slippage can make the actual loss larger.
In other words, adding units is not simply a way to increase profits; it also means recalculating the risk of the entire position.
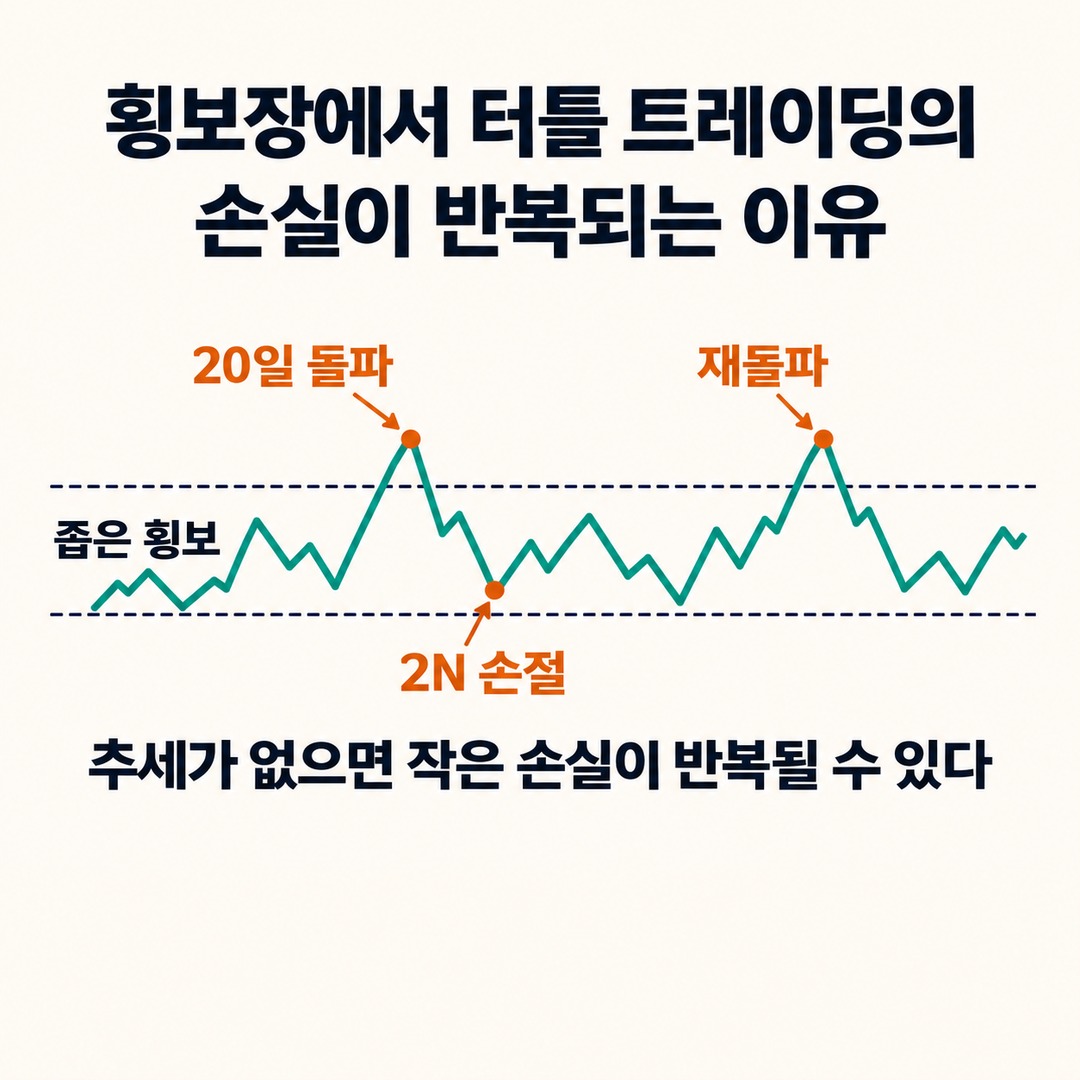
Why Turtle Trading losses recur in sideways markets
The Turtle system enters when the price moves beyond the high or low of a defined period, on the possibility that a trend is beginning. In a sideways market, however, the price can repeatedly move briefly beyond its existing range and then return inside it.
In these cases, breakout signals occur, but no sustained trend develops.
The original Turtle rules document also explains that most breakouts do not turn into trends and that many trades can end in losses. THE ROBUST TRADER+1
How losses occur in sideways markets
Suppose the price moves within a defined range. ebc.com
1. The price breaks above the 20-day high.
2. A System 1 buy signal is generated.
3. The price fails to rise further and returns to its previous range.
4. The price falls 2N below the entry price, triggering the stop.
5. It then rebounds, producing a new breakout signal.
6. The same sequence repeats.
This phenomenon is called a whipsaw.
In breakout trading, a whipsaw is when the price moves sharply in the opposite direction after an entry signal occurs.
The problem is not that the stop rule is faulty.
The key point is that even when stops are executed precisely, small losses can recur in an environment where no trend develops.
Why the 20-day system generates signals more often in sideways markets
The 20-day breakout uses price extremes from a shorter period than the 55-day breakout.
As a result, the price can reach a relatively nearby breakout level even while moving within a narrow range.
By contrast, the 55-day breakout is based on the high and low over a longer period.
This difference affects signal frequency and entry timing.
However, the 55-day system is not completely safe in sideways markets either.
A move above the 55-day high does not guarantee that a new uptrend will follow.
| Market condition | 20-day system | 55-day system |
|---|---|---|
| Rapid price movements | Relatively earlier signals | Relatively later signals |
| Narrow sideways range | Signals may recur | Losses are possible when a breakout occurs |
| Long-term trend | Opportunity for early entry | Entry after the trend is confirmed |
| Main risk | Frequent false breakouts | Late entry and reversal |
This table compares the characteristics of the two systems’ rules; it is not statistical data measuring the actual number of trades or win rates.
A real sideways-market example: the 2025 Bitcoin chart
The Turtle Trading analysis published by The Right Trader at 2026-10-13 presents a Bitcoin daily chart covering 2025-06-14 to October 11.
The material uses a 20-day channel to show breakout signals occurring in a sideways range and then reversing.
mql5.comThe point to take from this example is not simply whether a particular signal occurred, but how consistently the price moved after the breakout.
However, this is a chart example from a specific period, not a backtest proving the Turtle system’s overall win rate or long-term returns.
What did the original Turtle system use to reduce losses?
The original system combined a rule for skipping signals after 20-day breakouts, volatility-based position sizing, position limits, and trend exits.

Arbitrarily blocking all signals because a market is considered sideways should be distinguished from following the original rules.
1. The rule for skipping winning signals in System 1
If the previous System 1 breakout was judged to be a winner, skip the next 20-day breakout signal.
This rule is designed to reduce repeated entries into a trend that is already underway.
However, it is not a filter that prevents every loss in a sideways market.
2. The 55-day breakout in System 2
System 2 takes 55-day breakouts regardless of whether the previous trade was profitable.
Its entry characteristics differ because it uses a longer price range than the 20-day breakout.
3. Limit of 4 units
A position in one direction in a single market can comprise a maximum of 4 units.
The original rules also set unit limits for highly correlated markets and an overall position limit for each direction.
The reason is that holding similar positions in the same direction across multiple markets may not actually diversify risk.
4. Managing account size during periods without a trend
The original document also explains that account equity could decline substantially when markets fail to develop a trend for several months.
The Turtles at the time also used a separate rule: once account losses reached a certain level, they reduced the nominal account size used to calculate position size.

So reducing position size according to volatility and adjusting the trading capital used as the basis for calculations according to account losses are two distinct risk-management measures.
What to check before applying the strategy
Before applying Turtle Trading to stocks or crypto, first check the differences between the original rules and the actual trading environment.
You can review them in the following order.
Turtle system execution checklist
0/9 checks
0%Calculate the high and low for the preceding 20 or 55 days.
Check the result of the previous breakout for the 20-day system.
Calculate 20-day TR and N.
Use 1% of the account equity as the basis for calculating the size of 1 units.
Set the 2N stop price from the entry price.
Consider adding to the position when the price moves 0.5N in a favorable direction.
When adding to the position, adjust the existing stop price as well.
Check the opposite-direction breakout exit at 10 days for System 1 and at 20 days for System 2.
Calculate fees, slippage, gaps, and risk across the entire position.
Differences to consider when applying the system to stocks and crypto
The original Turtle system was designed for highly liquid futures markets on U.S. exchanges.
Therefore, applying it unchanged to current domestic stocks or crypto does not guarantee the same results.
In particular, check the following:
Breakout signals in stocks with insufficient trading volume
Price differences between exchanges
The difference between 24-hour trading and stock market trading hours
Sharp gaps and slippage
Futures contract multipliers and margin requirements
Whether short selling is available
Trading fees and funding fees
A stop order is not guaranteed to be filled at the stop price. If a gap causes the price to open beyond the stop level, the actual loss may exceed the calculated risk amount.
The key takeaway for understanding Turtle Trading
The core of Turtle Trading is not the ability to predict the 20-day or 55-day high.
The system is designed to hold positions when prices form a trend, execute a predetermined stop when a breakout fails, and reduce position size as volatility rises.
In particular, keep these three things distinct.
1. Entry: 20-day and 55-day breakouts are different signal systems.
2. Risk management: N determines both the stop distance and the number of units.
3. Market conditions: In sideways markets, false breakouts can recur and small losses can accumulate.
Also, do not confuse the 2N stop loss on one unit with the risk of loss across a full position built up from multiple units.
The Turtle system is not designed to avoid all losses; it is designed to control losses while capturing the occasional large trend.
To assess whether to apply the system, historical data must be tested with 20-day and 55-day entries, the System 1 skip rule, 2N stops, 0.5N additions, and exit rules all taken into account. Backtest results that exclude sideways periods and trading costs may overstate real-world performance.
※ This article is for informational purposes to help readers understand market trends and is not a recommendation to invest in any specific security or asset. You are responsible for your own final decisions and investments.