

Turtle Trading ATR Position Sizing: Calculating Share Quantity Based on Account Size and Volatility
The number of shares to buy should not be determined by account balance alone. It requires calculating both the amount of loss you are willing to accept on a single trade and the stock's ATR (Average True Range). Turtle Trading adjusts position size based on N, a 20-day volatility measure. However, confusing the original Turtle method's 1N reference and 2N stop-loss with the risk-budget approach commonly used in stock trading can lead to different position sizes.
This post contains Coupang Partners affiliate links. We may earn a commission from qualifying purchases.

The number of shares to buy should not be determined by account balance alone. You need to calculate both the amount of loss you are willing to accept on a single trade and the stock's ATR (Average True Range). Turtle Trading adjusts position size based on N, a 20-day volatility measure. However, confusing the original Turtle method's 1N reference and 2N stop-loss with the risk-budget approach commonly used in stock trading can lead to different position sizes.
The reference date is 2026-11-02. The following sections distinguish between the original Turtle System's calculation principles and risk-budget calculations that can be applied to a conventional stock trading account.
Why Is ATR Position Sizing Necessary?
ATR position sizing is a method of allocating fewer shares to stocks with larger price fluctuations and relatively more shares to stocks with smaller price fluctuations.

Even if an investor has an account worth KRW 10,000,000, buying the same 100 shares of a stock that moves an average of KRW 1,000 per day and another that moves KRW 100 per day creates different levels of risk from price fluctuations.
ATR does not predict whether prices will rise or fall. Instead, it measures the actual range of price movements over a specified period.
Fidelity's technical analysis materials explain that ATR also accounts for gaps between the previous day's closing price and the current day's high and low. ATR calculation principles and formula
How Does Turtle Trading's N Differ from the Conventional ATR (14)?
In the original Turtle Trading system, N is an exponential moving average of the True Range over 20 days. Since its calculation settings and period differ from those of the commonly used ATR (14), using the 20-day N calculation method is the correct approach when reproducing the original Turtle rules.
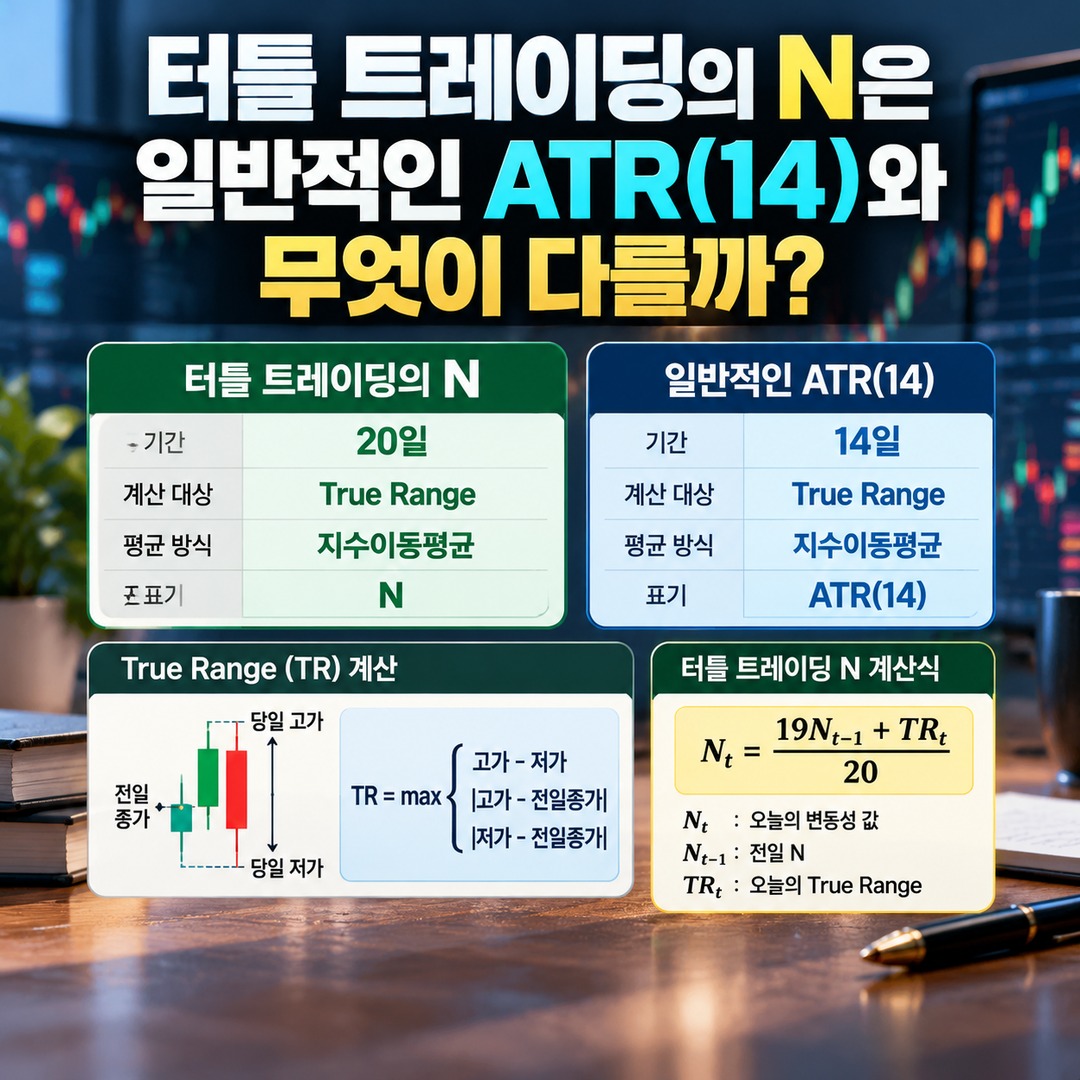
True Range (TR) is the largest of the following three price differences:
TR=max{High−Low∣High−Previous Close∣∣Low−Previous Close∣TR=\max
\begin{cases}
High-Low\\
|High-Previous Close|\\
| Low-Previous Close |
|---|
\end{cases}The previous day's closing price is included because this allows gaps between the previous close and the current day's opening price to be reflected in the measured price range.
The original Turtle System calculates N using the following formula:
Nt=19Nt−1+TRt20N_t=\frac{19N_{t-1}+TR_t}{20}- NtN_t: Today's volatility value
Nt−1N_{t-1}: Previous day's N
TRtTR_t: Today's True Range
The initial N is calculated as the simple average of the True Range over 20 days.
This calculation method can be found under the Position Sizing section of the original Turtle Trading rules document.
One important point to remember is that the ATR (14) displayed by charting platforms is not necessarily the same as N in the Turtle System. Differences in indicator periods and averaging methods will also produce different position sizes.
How Is Position Sizing Calculated in the Original Turtle System?

The original Turtle method calculates position units so that an amount equal to 1% of account equity corresponds to a price movement of 1N.
For stocks, where the price per 1 shares is quoted in Korean won, the formula can be simplified as follows:
1 units=Account Equity×0.01N1 units=\frac{Account Equity\times0.01}{N}In the original Turtle System, a movement of 1N corresponds to approximately 1% of account equity, while the initial stop-loss distance is 2N.
Therefore, the initial stop-loss risk for one unit is approximately 2%.
This is a point that is frequently misunderstood.
The meaning of 1N representing 1% in risk and the meaning of account equity declining by 1% when a 2N stop-loss is triggered are two different things.
The original Turtle rules document also explains that 1N corresponds to 1% of account equity and that applying a 2N stop-loss results in a maximum risk per trade of 2%.
How Do You Calculate Share Quantity for a Conventional Stock Trading Account?
In an actual stock trading account, rather than directly applying the original Turtle method's 1% unit formula, you can first determine the maximum acceptable loss per trade and then calculate the position size using the ATR-based stop-loss distance.

The key formulas are as follows:
Maximum Acceptable Loss=Account Equity×Risk PercentageMaximum Acceptable Loss=Account Equity\timesRisk PercentageStop-Loss Distance=ATR×Stop-Loss MultiplierStop-Loss Distance=ATR\timesStop-Loss MultiplierNumber of Shares to Buy=⌊Maximum Acceptable LossStop-Loss Distance⌋Number of Shares to Buy=
\left\lfloor
\frac{Maximum Acceptable Loss}{Stop-Loss Distance}
\right\rfloorWhen following the original Turtle method, the stop-loss multiplier here is 2.
For conventional stock trading, investors can use a different multiplier depending on their chosen loss tolerance and trading strategy.
CME Group's educational materials on position sizing also explain the principle of first determining the amount of money to risk in an account and the distance between the entry price and the stop-loss price, and then calculating the number of contracts.

How Many Shares Can You Buy with an Account Worth KRW 10,000,000?
The following is a hypothetical example intended to demonstrate the calculation principles. It is not an investment recommendation based on the current price or ATR of an actual stock.
Hypothetical Calculation Conditions
Account Equity
KRW 10,000,000
Risk budget per trade
0.5%
Entry price
KRW 50,000
ATR (20)
KRW 1,000
Maximum allowable loss per trade
KRW 50,000
10,000,000×0.005=50,00010,000,000\times0.005=50,0002N stop-loss distance
KRW 2,000
1,000×2=2,0001,000\times2=2,000Final share quantity
25 shares
⌊50,0002,000⌋=25\left\lfloor\frac{50,000}{2,000}\right\rfloor=25Purchase amount: KRW 1,250,000
Stop-loss price: KRW 48,000
Based on this calculation, if you buy 25 shares and place a stop-loss at a price KRW 2,000 lower, the expected loss is KRW 50,000.
This is a simplified calculation that excludes commissions, taxes, and slippage. If the actual execution price is less favorable than the stop-loss price, the loss could be greater.
How Much Does Share Quantity Change When ATR Changes?
Even with the same account size and risk budget, the number of shares you buy changes as ATR changes.

We will use the same account equity of KRW 10,000,000, per-trade risk budget of KRW 50,000, and stop-loss multiplier of 2 from the previous example.
Author's calculations · Hypothetical comparison · Unit: shares
| ATR (20) | 2N stop-loss distance | Share quantity | Expected loss |
|---|---|---|---|
| KRW 500 | KRW 1,000 | 50 shares | KRW 50,000 |
| KRW 1,000 | KRW 2,000 | 25 shares | KRW 50,000 |
| KRW 2,000 | KRW 4,000 | 12 shares | KRW 48,000 |
The entry price for all three stocks is assumed to be KRW 50,000.
The calculations show that when volatility doubles, the number of shares to buy decreases by approximately half.
Conversely, when ATR falls by half, the number of shares to buy doubles.
This is the central principle of volatility-based position sizing.

The goal is not to invest the same amount in every position, but to keep the amount at risk in the account relatively consistent if the stop-loss is triggered.
Differences Between the Original Turtle System and a General Risk-Budget Approach
Both approaches use a similar calculation structure, but their risk budgets are different.
| Category | Original Turtle System | Hypothetical Stock Application |
|---|---|---|
| Account equity | KRW 10,000,000 | KRW 10,000,000 |
| 1N-based allocation | KRW 100,000 | KRW 50,000 |
| N | KRW 1,000 | KRW 1,000 |
| Share quantity | 100 shares | 25 shares |
| Stop-loss distance | KRW 2,000 | KRW 2,000 |
| Expected loss | KRW 200,000 | KRW 50,000 |
| Loss as a percentage of account equity | 2% | 0.5% |
The original Turtle system allocates 1% of account equity for every 1N.
By contrast, the hypothetical stock application sets a risk budget so that a 2N stop-loss results in a loss of 0.5% of account equity.
Therefore, if you want to calculate position sizes in exactly the same way as the original Turtle system, you should use the 1% allocation formula based on 1N. If you want to limit losses per trade to a lower level, you should apply a separate risk budget.
Three Constraints to Check Before Determining Share Quantity
The quantity calculated using the ATR formula will not always match the number of shares you can actually order.
First, available cash.
Even if your account contains KRW 10,000,000, the amount actually available for new purchases will differ if you already hold stocks or have outstanding orders.
Cash-based share quantity = ⌊Available cash / Entry price⌋
\left\lfloor
\frac{Available cash}{Entry price}
\right\rfloorSecond, the maximum investment allocation for each stock.
Buying too many shares simply because a stock has low volatility can concentrate too much capital in a single position.
Therefore, compare the quantity calculated using the risk budget with the quantity permitted by the investment limit for each stock.
Final quantity = min{Risk-based quantity, Cash-based quantity, Per-stock limit quantity}
\min
\begin{cases}
Risk-based quantity\\
Cash-based quantity\\
Per-stock limit quantity
\end{cases}Third, the difference between the stop-loss price and the actual execution price.
ATR is a volatility indicator calculated from historical price movements. It does not guarantee future prices or limit potential losses.
In particular, if a stock opens below its stop-loss price following an earnings announcement or sudden market volatility, the actual loss may exceed the planned amount.
Steps to Follow When Calculating Position Size Manually
You can follow these steps before making an actual stock purchase.
1. Check the current market value of your account.
2. Set the percentage of capital you are willing to risk per trade.
3. Choose the ATR calculation period.
4. Check the latest ATR value.
5. Set the stop-loss multiplier and calculate the stop-loss price.
6. Divide the maximum permitted loss by the stop-loss distance per share.
7. Round down to the nearest whole share.
8. Apply available cash and per-stock investment limits.
When calculating position size using the Turtle method, make sure to check the reference period and calculation method for N
※ This article is provided for informational purposes to help readers understand market trends and does not constitute a recommendation to invest in any specific stock or asset. All final investment decisions and responsibility rest with the individual.
This post contains Coupang Partners affiliate links. We may earn a commission from qualifying purchases.