

How to Read Trendlines, Support and Resistance, and Candlestick Patterns: Connecting Price Structure to Trading Signals
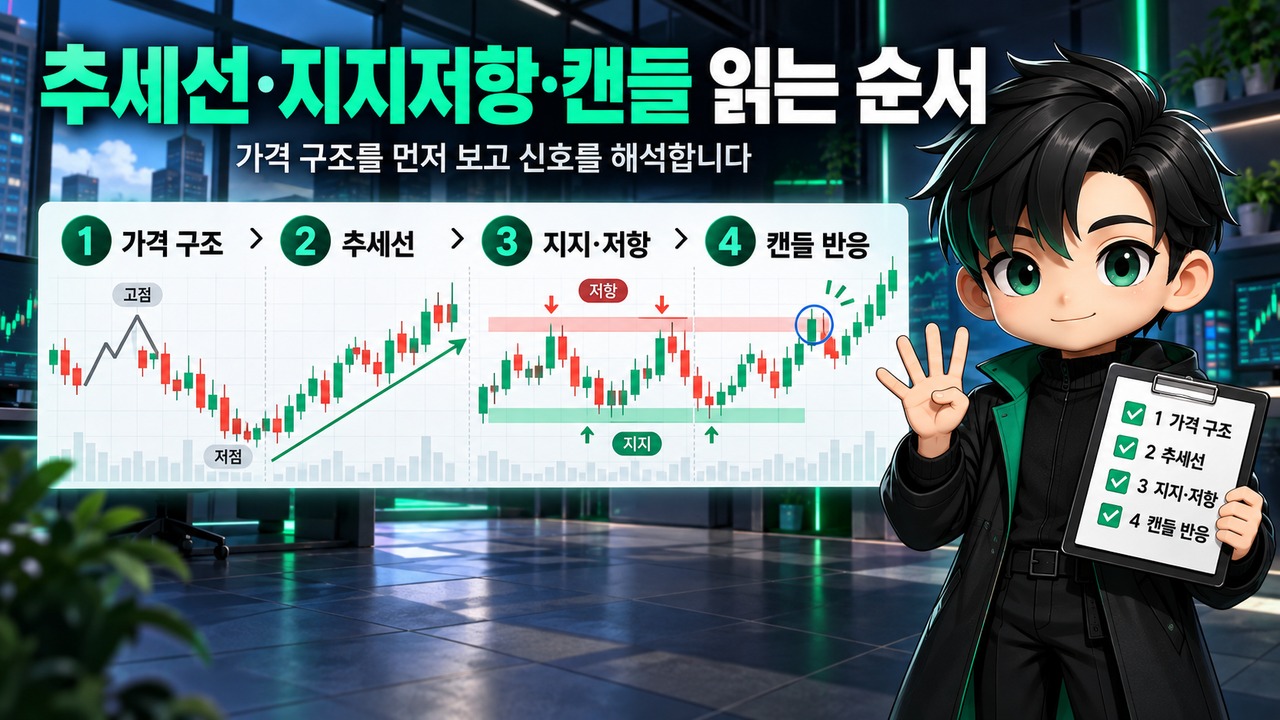
Trendlines, support and resistance, and candlestick patterns should not be treated as separate techniques to memorize. Instead, they should be analyzed by examining price structure first and interpreting signals afterward. The basic approach is to identify where the current price is located, determine the trend direction and major support and resistance zones, and then examine the buying and selling reactions reflected in candlesticks. However, chart patterns do not guarantee future price movements, and market conditions and risk management must also be considered.
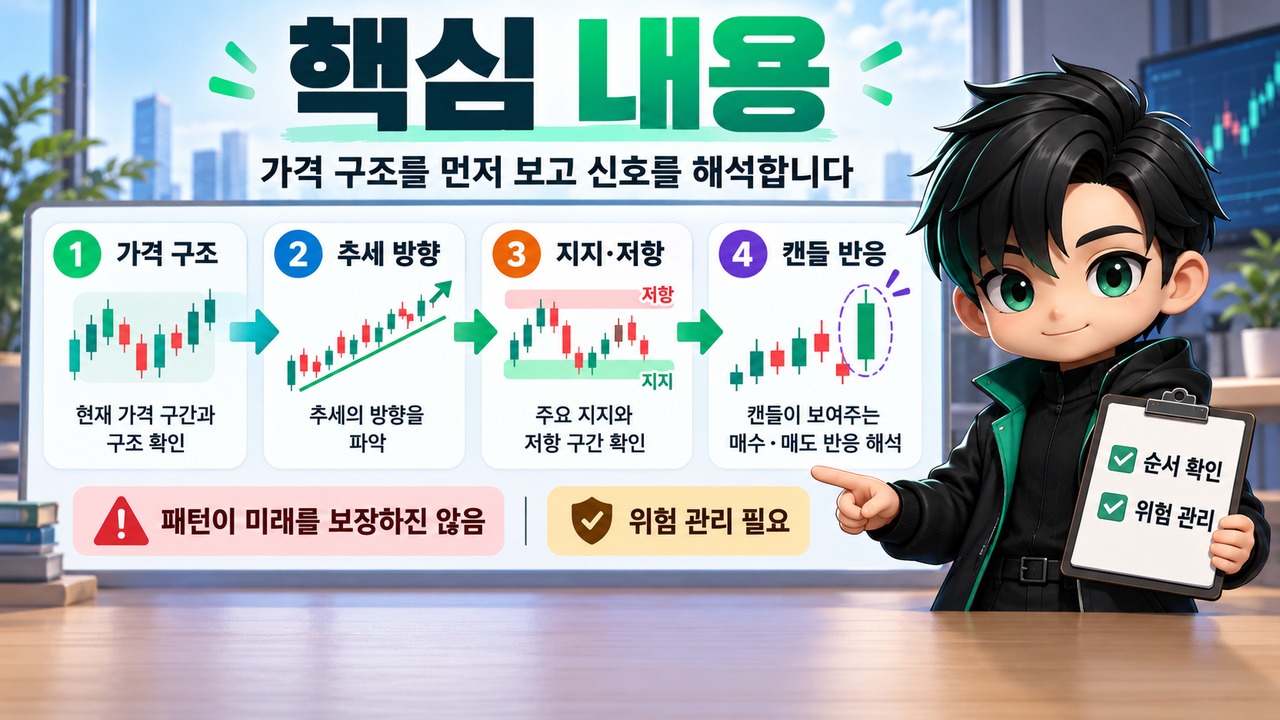
Why Should You Examine Price Structure First?
The first thing to examine in chart analysis is not the shape of a candlestick, but where the price movement is occurring.

The same candlestick pattern can have different meanings depending on where it appears.
For example, even if a bullish candlestick with a long lower wick appears, its interpretation will depend on whether it occurs:
In the middle of a downtrend
At an important support zone
Near a peak after a substantial price increase
The basic sequence for reading price structure is as follows.
1. Identify the current trend
2. Mark major support and resistance zones
3. Observe how the price reacts within those zones
4. Interpret buying and selling pressure through candlestick patterns
Support and resistance are generally better understood as zones where prices may pause or react rather than as single, exact price levels. CME Group educational materials also explain that support and resistance can be identified using previous highs and lows, significant price levels, and trendlines, and that their roles can reverse after a breakout.
Use Trendlines to Identify Market Direction

A trendline is a line used to identify the direction of price movements.
In an uptrend, traders generally connect successive lows to identify upward movement, while in a downtrend, they connect successive highs to identify downward movement.
For example:
A structure with rising highs and rising lows → Uptrend
A structure with consistently falling highs and falling lows → Downtrend
A structure moving within a defined range → Possible sideways market
These structures can be used to distinguish different market conditions.
However, rather than treating a trendline as an absolute boundary that prices must touch precisely, it is more appropriate to view it as a structural zone that market participants may use as a reference.
Instead of drawing a line once and trying to explain every price movement with it, traders should also examine:
Changes in recent highs and lows
Changes in trading volume
Price movements that retest a level after a breakout
Areas where the trendline overlaps with previous support or resistance
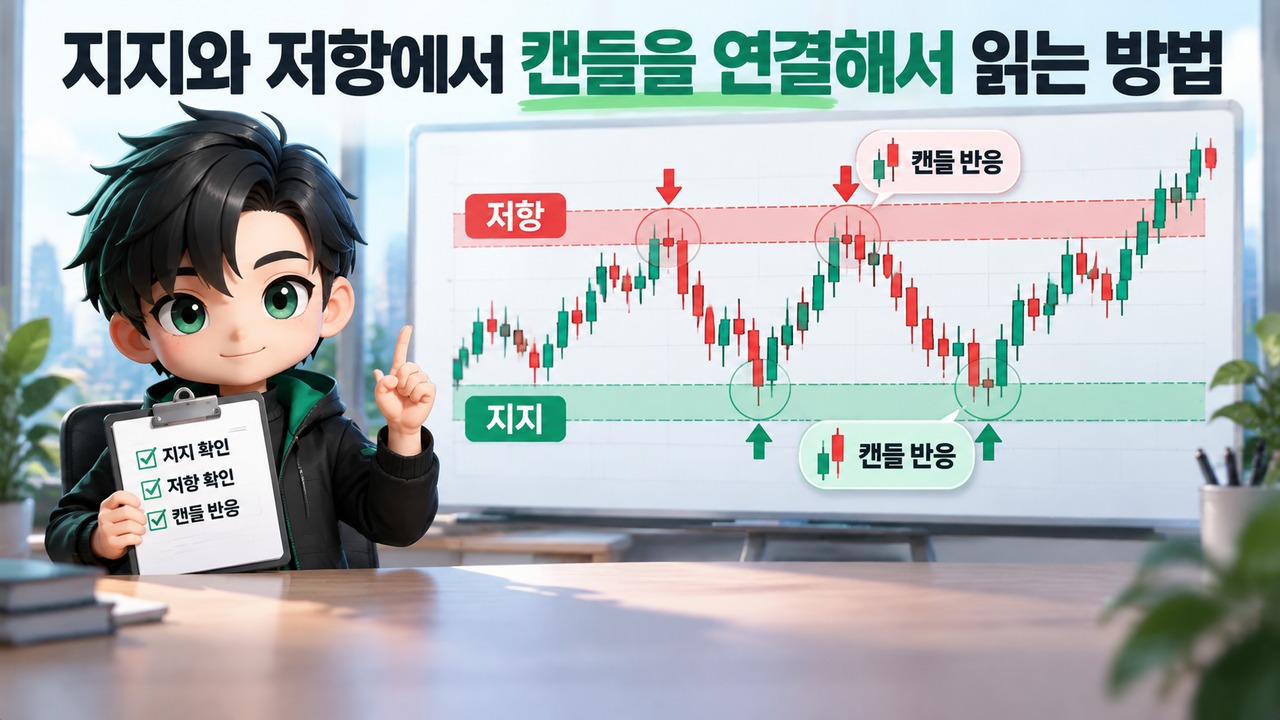
How to Interpret Candlesticks at Support and Resistance Levels
Once support and resistance zones have been identified, the next step is to examine how prices react within those areas.
For example, when the price reaches a support zone, traders can observe whether:
The price falls below the level but quickly recovers
The candlestick body expands and a clear direction emerges
The movement is accompanied by changes in trading volume
At a resistance zone, traders can instead check whether:
The upward movement encounters resistance
Upper wicks appear repeatedly
The price breaks above resistance but then falls back below it
The important point is not to make decisions based on a single candlestick.
Patterns such as hammer candlesticks, long bullish candles, long bearish candles, and doji candles are frequently discussed in chart analysis. However, even identical shapes can have different meanings depending on where they occur and the preceding price movements.
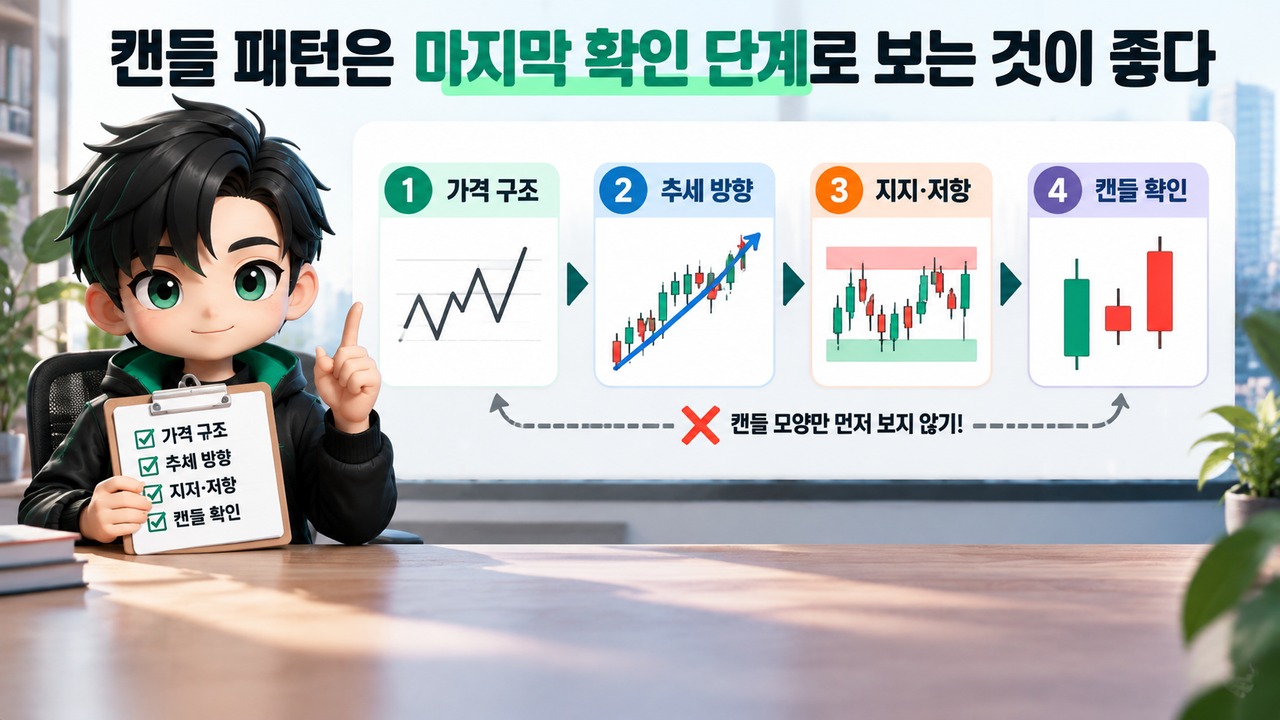
Candlestick Patterns Are Best Used as the Final Confirmation Step
A common mistake among beginners is to look for candlestick shapes first.
In practice, however, the following sequence is more important.
Step 1: Identify the Current Market Position
First, determine whether the price is:
In an uptrend
In a downtrend
Moving within a trading range
Step 2: Mark Important Price Zones
Identify previous highs, previous lows, and zones where prices have repeatedly reacted.
Step 3: Observe Price Reactions
Check whether the price stops, breaks through, or returns to the relevant zone.
Step 4: Interpret Candlesticks
Finally, examine changes in buying and selling pressure reflected by the candlesticks.
Following this sequence allows traders to move beyond simplistic interpretations such as "A hammer candlestick appeared, so the price will rise" and instead interpret candlesticks within the broader price structure.
Three Common Mistakes Beginners Often Overlook
Treating Support and Resistance as Exact Numbers
Market prices do not always stop at exactly the same level.
For example, prices may briefly fall below a particular level before recovering. For this reason, it is generally better to approach support and resistance as zones rather than single lines.
Assuming a Single Candlestick Determines Price Direction
A single candlestick simply provides information about price movements during a specific period.
Even candlesticks that appear to provide strong signals can be interpreted differently depending on:
Trend direction
Price location
Trading conditions
Timeframe
Confusing Analytical Signals With Investment Outcomes
Technical analysis is one method of interpreting markets based on historical prices and price movements. However, no particular pattern guarantees future profits or successful trades. The CFTC also advises investors to understand the risks and exercise caution when using online investment information or short-term trading signals.
A Simple Sequence to Follow When Analyzing Charts
When examining an actual chart, use the following sequence.
1. Identify the direction on a higher-timeframe chart
2. Mark major highs and lows
3. Establish support and resistance zones
4. Identify the current price location
5. Examine candlestick reactions within the relevant zone
6. Establish criteria for determining when the original expectation is wrong
The key to reading charts is not memorizing numerous candlestick pattern names. Instead, it is understanding where prices are moving and connecting that information with how market participants are reacting.
※ This article is provided for informational purposes to help readers understand market movements and does not constitute investment advice or a recommendation regarding any particular stock or asset. Readers are responsible for their own final investment decisions and outcomes.