

How to Calculate the Average Price of Accumulation Candles in Stocks and Crypto: Trading Value ÷ Volume vs. the 'Average Cost of Major Players'
이 포스팅은 쿠팡 파트너스 활동의 일환으로, 이에 따른 일정액의 수수료를 제공받습니다.
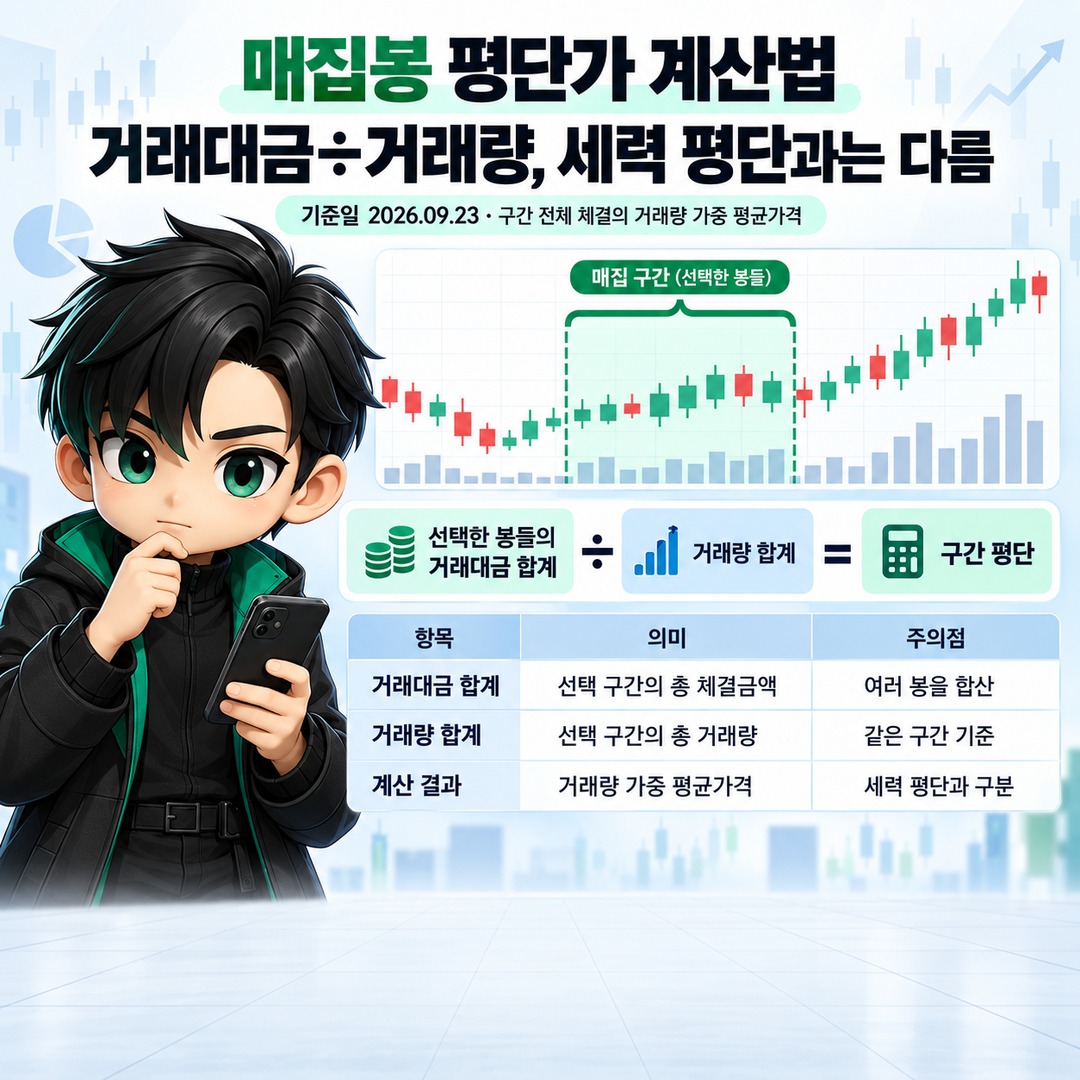
When calculating the average trading price of a period identified by accumulation candles, you can divide the total trading value of the selected candles by their total trading volume, provided both figures are available. As of 2026-09-23, this represents the volume-weighted average price of all trades executed during that period and must be distinguished from the actual average purchase price of a particular major player, whale, or account.
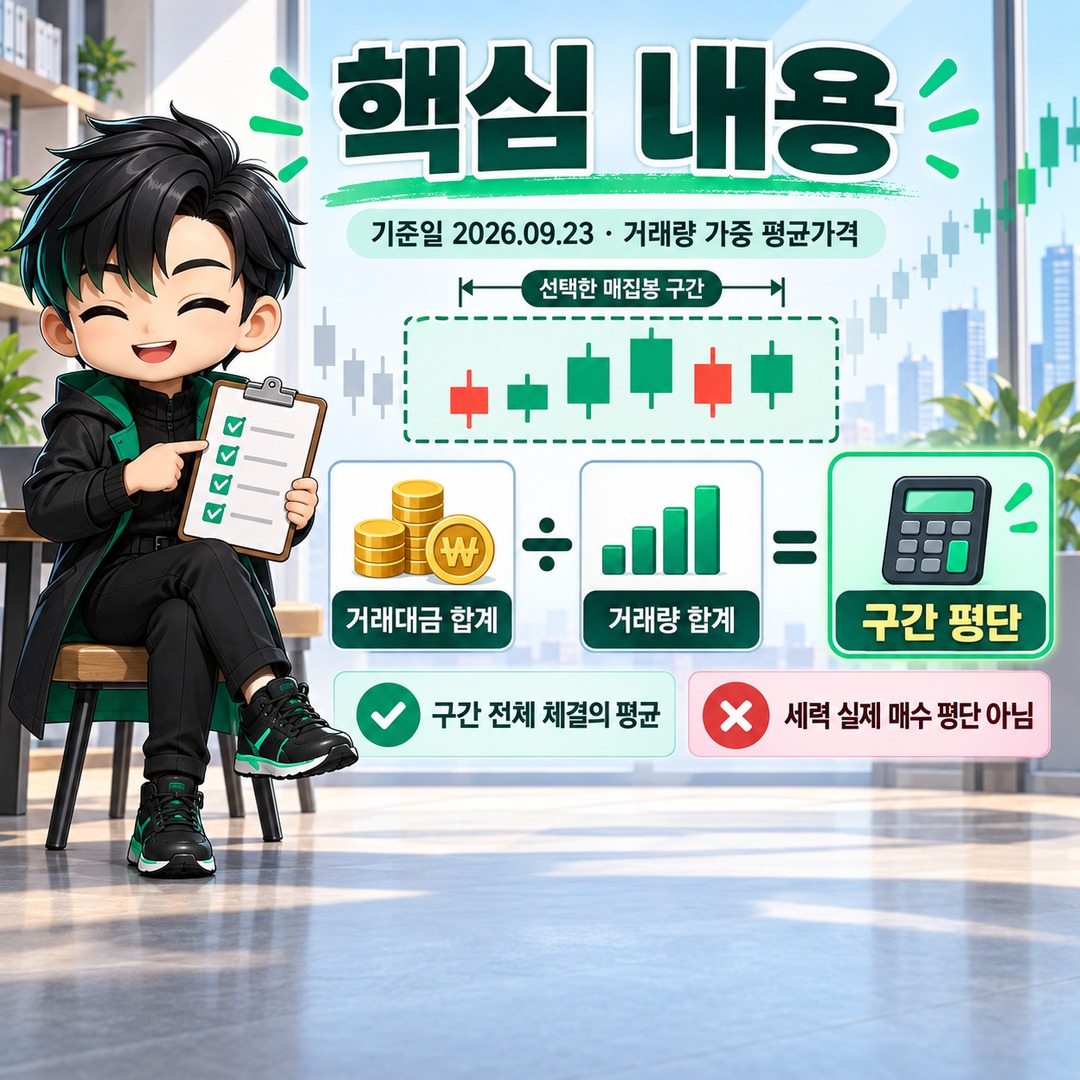
The main reason people obtain different average prices from the same chart is that they average closing prices, use candle midpoints, or assign equal weight to candles with different trading volumes.
Three Values You Must Distinguish When Calculating an Accumulation Candle's Average Price
Values calculated from charts are not the same as an individual investor's actual acquisition cost.

| Value to Calculate | Calculation Method | Meaning |
|---|---|---|
| Average trading price for the entire selected period | Total trading value ÷ Total trading volume | Volume-weighted average of all trades executed during the period |
| Average purchase price of a specific investor group | Purchase value ÷ Purchase volume | Average purchase price of that investor group during the period examined |
| OHLCV-based estimate | Sum of representative price × Volume ÷ Total volume | Approximation used when trading value data is unavailable |
Therefore, a value calculated by selecting candles with substantial increases in trading volume is more accurately described as 'the average price at which the overall market traded during a potential accumulation period.'
Unless information about who purchased how much at which prices is separately disclosed, this value cannot be definitively identified as the actual cost basis of a particular market participant.
If Trading Value and Volume Are Available, Start With This Formula
The simplest calculation is as follows.
Average trading price for the selected period = Total trading value of selected candles ÷ Total trading volume of selected candles
If multiple candles are involved, combine their trading values and volumes first rather than averaging the average prices of individual candles.
For example, assume the following data for three candles identified as potential accumulation candles.
| Candle | Trading Volume | Trading Value |
|---|---|---|
| A | 100,000 shares | KRW 1,020,000,000 |
| B | 150,000 shares | KRW 1,545,000,000 |
| C | 50,000 shares | KRW 520,000,000 |
The total trading volume is 300,000 shares, and the total trading value is KRW 3,085,000,000.
KRW 3,085,000,000 ÷ 300,000 shares = Approximately KRW 10,283.33
Therefore, when these three candles are treated as a single period, the volume-weighted average price is approximately KRW 10,283. This is the author's calculation.
The average prices of the individual candles are KRW 10,200, KRW 10,300, and KRW 10,400, respectively, producing a simple average of KRW 10,300. However, because their trading volumes differ, the simple average of KRW 10,300 is not the same as KRW 10,283, which reflects the actual distribution of trading volume across the entire period.
The Same Principle Applies to Cryptocurrency
If a cryptocurrency exchange provides both cumulative trading value and cumulative trading volume for each candle, the same calculation method can be used.
Average trading price for the selected period = Total cumulative trading value ÷ Total cumulative trading volume
For example, assume two candidate candles have the following data.
If the first candle has a trading value of KRW 500,000,000 and a trading volume of 5 BTC, while the second has a trading value of KRW 2,100,000,000 and a trading volume of 20 BTC, the combined period has a trading value of KRW 2,600,000,000 and a trading volume of 25 BTC.
KRW 2,600,000,000 ÷ 25 BTC = KRW 104,000,000/BTC
In this case, the volume-weighted average price across the two selected candles is KRW 104,000,000 per 1 BTC. This is the author's calculation.
If individual trade execution data is available, the average can be calculated more directly.
Execution-based average price = Σ(Execution price × Executed quantity) ÷ ΣExecuted quantity
However, this is still the average execution price for the selected market and period, not the actual acquisition cost of a particular whale's wallet or trading account.
What If You Only Have Open, High, Low, Close, and Volume Data?
If only OHLCV data is available, you cannot directly apply the trading value ÷ trading volume method. Instead, you can approximate the result by calculating a representative price for each candle and weighting it by trading volume.
A common approach uses HLC3, the average of the high, low, and closing prices.
Representative price = (High + Low + Close) ÷ 3
Then calculate the following across all selected candles.
Estimated VWAP = Σ(Representative price × Trading volume) ÷ ΣTrading volume
For example, if the first candle has a high of KRW 10,500, a low of KRW 9,900, and a close of KRW 10,200, its representative price is KRW 10,200.
If the second candle has a high of KRW 10,800, a low of KRW 10,100, and a close of KRW 10,600, its representative price is KRW 10,500.
If the first candle's trading volume is 10 ten thousand shares and the second candle's is 20 ten thousand shares, then:
(KRW 10,200×100,000 shares + KRW 10,500×200,000 shares) ÷ 300,000 shares = KRW 10,400
According to the author's calculation, the estimated average price is KRW 10,400.
However, this method does not use actual trading values from individual executions. If trading value data is available, it is preferable to use total trading value ÷ total trading volume rather than an HLC3-based estimate.
When Calculating Institutional or Foreign Investor Average Prices, Use 'Purchases' Rather Than 'Net Purchases'
When calculating the average purchase price of an identifiable investor group, such as institutional or foreign investors, purchase value ÷ purchase volume over the period examined is closer to the figure you need.
Average purchase price of an investor group = Total purchase value ÷ Total purchase volume
Conversely, using `Net purchase value ÷ Net purchase volume` as though it were the actual average purchase price is problematic. Net purchases represent the difference between purchases and sales.
For example, assume an investor group purchases 200 shares at KRW 10,000 and sells 100 shares at KRW 5,000.
The purchase value is KRW 2,000,000, and the actual average purchase price is KRW 10,000.
However, the net purchase volume is 100 shares, and the amount remaining after subtracting sales value from purchase value is KRW 1,500,000. Dividing these two values produces KRW 15,000.
KRW 1,500,000 ÷ 100 shares = KRW 15,000
Although actual purchases occurred only at KRW 10,000, the calculated value becomes KRW 15,000. This is the author's calculation.
Therefore, the ratio of net purchase volume to net purchase value may serve as a separate indicator for interpreting supply and demand over a particular period, but it must not be treated as equivalent to the actual average acquisition price.
Where You Start and End the Accumulation Period Can Significantly Change the Result
Before choosing a calculation formula, you must define the calculation period.
If you retrospectively select only bullish candles with substantial volume increases, it becomes easy to produce a result close to a desired price level. Conversely, if your objective is to analyze a period of sideways trading or changes in ownership, you should establish the starting and ending points first and apply consistent criteria to all trades within that period to make comparisons meaningful.
The simplest practical calculation process is as follows.
1. First, fix the starting and ending candles of the potential accumulation period you want to analyze.
2. Record each candle's trading volume and trading value using consistent units.
3. Check whether trading value is expressed in won, thousands of won, or millions of won.
4. Add up the trading values for the selected period.
5. Add up the trading volumes for the same period.
6. Divide the total trading value by the total trading volume.
Mixing daily and intraday candles or combining data from different exchanges without distinction changes the basis of comparison. It is also advisable not to simply aggregate periods in which the meaning of quantity has changed, such as after a stock split, reverse split, or change in cryptocurrency units.
Average Closing Prices and Candle Body Midpoints Are Not Average Trading Prices
Some methods describe `(Open + Close) ÷ 2` or the 50% price of a long bullish candle's body as the average cost of major market players.
However, these values do not account for trading volume.
For example, if 1 ten thousand shares trade around KRW 10,000 and 100 ten thousand shares trade around KRW 10,500, the simple average of those two prices, KRW 10,250, does not accurately represent the actual distribution of trading volume.
A candle's midpoint can be used as a reference line on a chart, but it is separate from the formula used to calculate the average trading price.
Your Account's Average Cost Must Also Be Calculated Separately From the Chart Average
If you have purchased a stock or cryptocurrency multiple times, your average purchase price should be calculated using your own execution history rather than the overall market's trading volume.
My average cost = Σ(My execution price × My executed quantity) ÷ ΣMy executed quantity
If separate transaction fees apply, or cryptocurrency fees are deducted from the quantity of the asset purchased, you should also review the platform's execution and fee records when calculating your actual acquisition cost.
The chart's average trading price and your account's average acquisition price are calculated from fundamentally different sets of transactions.
The Most Important Precaution After Calculating an Accumulation Average Price
There is no guarantee that the calculated price will subsequently become a support level.
Periods of heavy trading volume include not only new purchases but also sales by existing holders and changes in ownership. Therefore, high trading volume alone does not prove that a particular major player has accumulated a position, nor does it justify assuming that the price will necessarily be defended below the calculated average.
What accumulation candle analysis can establish through calculation is closer to 'the price range in which the greatest share of actual trading activity occurred during the selected period.' Afterward, changes in trading volume, whether prices hold, and investor supply-and-demand data must be examined separately.
Can I Calculate It From a Chart That Only Shows Closing Prices?
If closing prices and trading volumes are available, you can calculate a volume-weighted closing price using `Σ(Close × Volume) ÷ ΣVolume`. However, this is not an average that reflects every intraday execution price, so it provides less information than a calculation based on actual trading value ÷ trading volume.
Should I Select Only Bullish Accumulation Candles?
There is no universally accepted formula requiring you to select only bullish candles. You can select candles according to specific analytical rules, but choosing only favorable candles after seeing the results will change the calculated value. Defining the starting and ending criteria in advance improves reproducibility.
Is Buying More Advantageous When the Price Falls Below the Calculated Average?
That cannot be assumed. The calculated value is simply the average execution price during the selected period and does not guarantee future prices or returns. You should also examine how trading volume and supply-and-demand conditions change after the price breaks below that level.
When analyzing a potential accumulation period on a stock or cryptocurrency chart, the key is to check trading value and volume first, calculate the market's actual volume-weighted average trading price using `Total trading value ÷ Total trading volume`, and distinguish that figure from the 'actual average cost of a particular major player' when interpreting the result.
※ This article is provided for informational purposes to help readers understand market movements and does not constitute an investment recommendation for any particular stock or asset. Final investment decisions and responsibility rest with the individual investor.
Related Articles
Has the CLARITY Act's Rejection Ended the Process? Possibilities for Another Vote and the Next Steps
이 포스팅은 쿠팡 파트너스 활동의 일환으로, 이에 따른 일정액의 수수료를 제공받습니다.