

How to Read Uptrends and Downtrends Using Ichimoku Cloud, Volume, and RSI: Separating Direction, Strength, and Overbought Conditions
이 포스팅은 쿠팡 파트너스 활동의 일환으로, 이에 따른 일정액의 수수료를 제공받습니다.

When using Ichimoku Cloud, trading volume, and RSI together, you should not ask all three indicators the same question. It is easier to understand the chart by checking the direction of the trend with Ichimoku Cloud, whether trading participation supports price movements with volume, and whether bullish or bearish momentum is stronger with RSI, in that order.

As of 2026-09-26, these three indicators are still not tools that can predict future prices with certainty. In particular, immediately interpreting RSI above 70 as a bearish signal or RSI below 30 as a bullish signal can easily lead to incorrect decisions during strong trends.
With Ichimoku Cloud, Start by Checking Where the Price Is Relative to the Cloud
When first learning Ichimoku Cloud, rather than trying to interpret every line, start by checking the relationship between the current price and the cloud.

When the price is above the cloud, it can be interpreted as favoring an uptrend. When the price is below the cloud, it can be interpreted as favoring a downtrend. If the price is inside the cloud, the market may be in a sideways or mixed phase without a clear direction.
It also helps to understand the basic components of Ichimoku Cloud.
The Conversion Line (Tenkan-sen) is the midpoint between the highest high and lowest low over the most recent 9 periods, while the Base Line (Kijun-sen) is the midpoint between the highest high and lowest low over the most recent 26 periods. Leading Span A is the midpoint between the Conversion Line and Base Line, plotted 26 periods ahead, while Leading Span B is the midpoint between the highest high and lowest low over the most recent 52 periods, plotted 26 periods ahead.
The area between these two leading spans is commonly called the cloud. The Lagging Span (Chikou Span) plots the current closing price 26 periods backward and is used to examine the relationship between the current price and past prices.
Therefore, when assessing an uptrend, a more systematic approach is to look beyond whether the Conversion Line has crossed above the Base Line once. Check whether the price is above the cloud and whether the relationship between the Conversion Line and Base Line, along with the position of the Lagging Span, points in the same direction.
Conversely, if the price moves up and down inside the cloud and the Conversion Line and Base Line cross frequently, it may be better to wait for a clearer direction rather than rushing to declare an uptrend or downtrend.
Volume Measures Participation in Price Movements Rather Than Their Direction

It is difficult to determine whether prices will rise or fall in the future based on volume alone. Volume is better used to assess how much trading activity accompanies a price movement.
For example, suppose the price breaks above an important resistance zone.
A price that briefly moves above resistance before falling back is not viewed in the same way as a breakout accompanied by increasing volume. In technical analysis, higher volume accompanying a price movement can provide additional information for assessing the strength of that movement.
The same principle applies to declines. If the price breaks below a support zone while volume increases, there is reason to investigate further whether the move is merely intraday volatility or reflects growing selling participation.
The important point is that an increase in volume is not itself a bullish signal. Even on days when volume rises sharply, prices can either increase or decrease. Therefore, a natural sequence is to first examine the price direction and whether major support or resistance levels have been broken, then use volume to help confirm the movement.
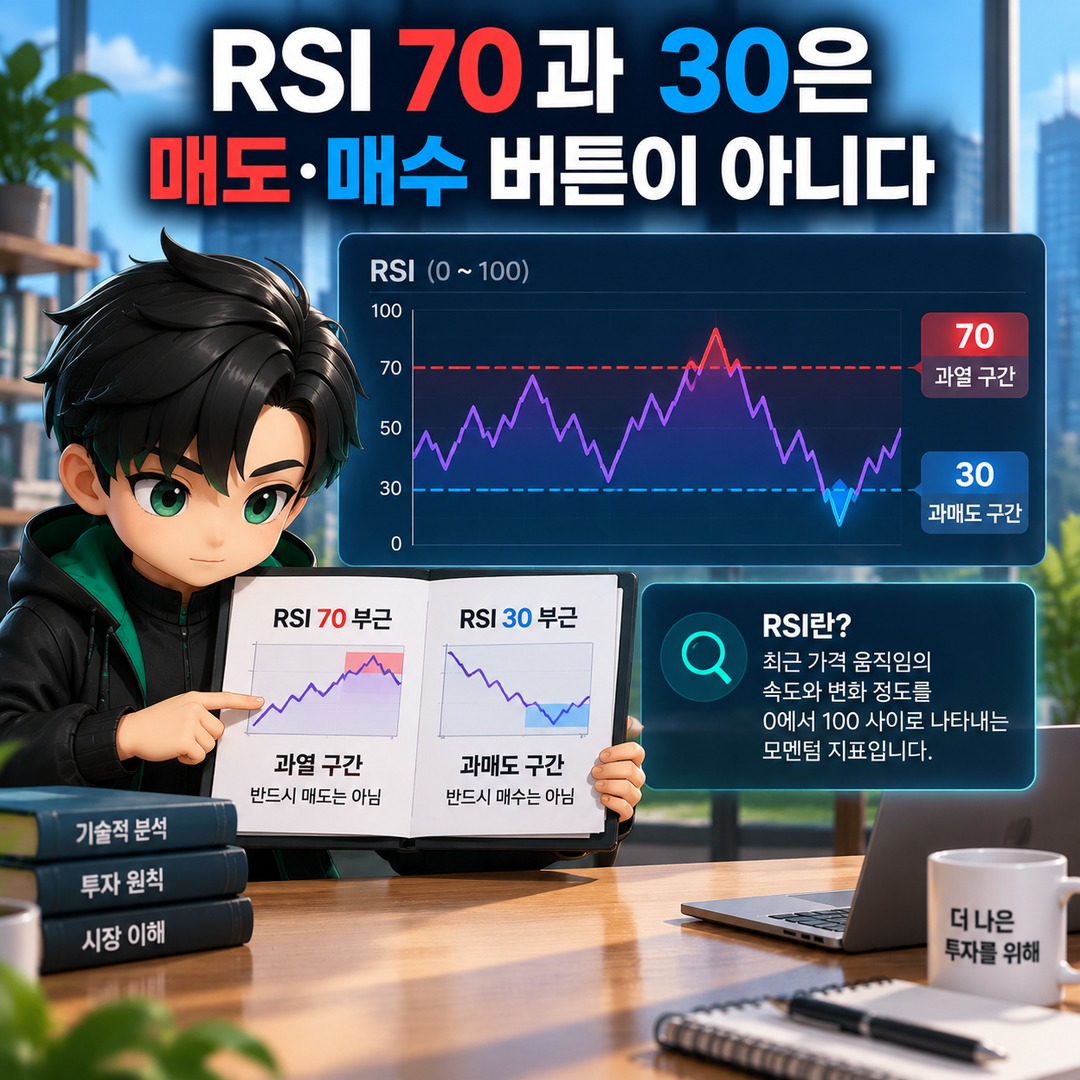
RSI 70 and 30 Are Not Automatic Sell or Buy Signals
The Relative Strength Index (RSI) is a momentum indicator that expresses the speed and magnitude of recent price movements on a scale from 0 to 100.
Under traditional guidelines, RSI above 70 is considered overbought, while RSI below 30 is considered oversold. However, overbought does not mean that the price is about to fall, and oversold does not mean that the price is about to rise.
During a strong uptrend, RSI can remain elevated for a considerable period. During a strong downtrend, RSI can remain low for an extended period.
Understanding this distinction changes how RSI should be interpreted.
If the price remains above the cloud in an uptrend, rather than declaring a bearish reversal simply because RSI exceeds 70, examine whether RSI continues to stay elevated or whether momentum is beginning to weaken.
Conversely, if the price continues its downtrend below the cloud, it is difficult to conclude that the market has reached a bottom solely because RSI is below 30.
Looking at RSI around 50 can also help explain the overall pattern. During uptrends, RSI may remain within a relatively higher range, while during downtrends, it may fluctuate within a relatively lower range.
What Should You Look for When Price and RSI Move in Different Directions?
When price and RSI move in opposite directions, the phenomenon can be examined through divergence.
If the price rises above its previous high to establish a higher high, but the RSI peak is lower than before, price gains and momentum are not advancing at the same pace. Conversely, if the price makes a lower low while RSI forms a higher low, this provides a reason to examine possible changes in bearish momentum.
However, divergence does not guarantee a price reversal either.
You also need to check whether the actual price structure has changed, whether important support or resistance levels have been broken, and how volume is behaving. Treating divergence alone as an immediate signal to trade in the opposite direction can make it difficult to respond when the existing trend continues.
Reading Ichimoku Cloud → Volume → RSI in That Order Makes the Three Indicators Easier to Understand
If you are new to chart analysis, remembering the following sequence can help you understand why the three indicators sometimes appear to conflict.
1. Check the direction using Ichimoku Cloud.
Start by determining whether the price is above, below, or inside the cloud.
2. Check whether the price has actually broken above or below an important level.
Examine price levels such as cloud boundaries, recent highs and lows, and support and resistance.
3. Use volume to check whether trading participation supports the movement.
Pay particular attention to whether volume increases during breakouts or breakdowns.
4. Use RSI to assess momentum conditions.
Rather than focusing only on 70 and 30, also examine movements around 50, the established RSI range, and differences between the direction of price and RSI.
This approach gives each indicator a distinct role. Ichimoku Cloud shows the broader direction, volume adds information about participation in price movements, and RSI provides an additional view of momentum conditions.
For an Uptrend, Check Whether All Three Conditions Point in the Same Direction
For example, even if the price moves above the cloud, that alone does not guarantee the uptrend will continue.
First, check whether the price remains above the cloud and whether the relationship between the Conversion Line and Base Line is consistent with a bullish trend. Next, examine whether volume increases when the price breaks through important levels, and whether RSI also indicates that bullish momentum is being maintained.
Conversely, if the price is above the cloud but volume is declining and RSI momentum is weakening, the three indicators are not pointing in the same direction.
In that situation, rather than reinforcing a bullish conclusion, the priority is to check whether the conflicting signals begin to align again.
Apply the Same Principles in Reverse to Analyze Downtrends
If the price is below the cloud, Ichimoku Cloud places greater weight on a bearish trend interpretation.
You can then examine whether a break below a major support zone is accompanied by increasing volume and whether RSI is moving within a relatively low range.
However, an RSI reading below 30 does not mean that further declines are impossible. During a strong downtrend, RSI can remain oversold for an extended period.
Therefore, rather than focusing simply on the fact that RSI is low during a decline, more important follow-up questions are whether the price has moved out from below the cloud, whether the support and resistance structure has changed, and whether volume and momentum are actually reversing.
The Most Important Time to Be Cautious Is When the Three Indicators Conflict
The price may be above the cloud while RSI weakens and volume decreases. Conversely, RSI may begin recovering while the price is still below the cloud.
These situations do not necessarily mean that the indicators are wrong. They can occur because each indicator measures something different.
Ichimoku Cloud focuses on trends and price positioning, volume reflects the degree of market participation, and RSI measures price momentum. Therefore, when the three indicators point in different directions, one approach is to watch for confirmation of the price direction rather than forcing a bullish or bearish conclusion.
Signals can become particularly less meaningful in sideways markets, where Ichimoku Cloud signals change frequently or RSI fluctuates between 30 and 70.
When Analyzing Real Charts, Record Changes in Conditions Rather Than Making Predictions
One of the easiest traps to fall into when practicing technical analysis is immediately concluding that a price will "rise" or "fall" as soon as you look at a chart.
Instead, recording the current situation as a set of conditions can make the decision-making process clearer.
For example, write down your observations separately: "The price is above the cloud and has broken through major resistance, while volume has increased compared with earlier levels. RSI is also showing bullish momentum."
Then check whether the price moves back into the cloud, whether it holds the level it broke through, whether volume remains elevated, and whether RSI momentum weakens.
The advantage of this approach is that an incorrect signal from one indicator does not invalidate your entire assessment.
Ichimoku Cloud, volume, and RSI are not formulas that can determine future rises or falls in advance. They are better understood as tools for interpreting current chart conditions by examining trend direction, trading participation, and momentum from different perspectives.
In actual investing, information beyond the chart, such as corporate earnings and financial conditions, disclosures, interest rates, exchange rates, and overall market conditions, can also affect prices. Because historical signals from technical indicators do not guarantee future returns or price direction, actual trading decisions should also account for potential losses, your investment horizon, and your risk tolerance.
※ This article is provided for informational purposes to help readers understand market trends and does not constitute an investment recommendation for any particular stock or asset. Final investment decisions and responsibility rest with the individual investor.
Related Articles
이 포스팅은 쿠팡 파트너스 활동의 일환으로, 이에 따른 일정액의 수수료를 제공받습니다.