

Stan Weinstein’s Stage 2: 3 Conditions You Miss If You Buy on a Break Above the 30-Week Moving Average Alone
In Stan Weinstein’s Stage 2 trading method, the fact that a stock price has moved above the 30-week moving average does not, by itself, complete a buy signal. The key is whether the 30-week moving average turns upward on the weekly chart, price breaks above the top of the Stage 1 trading range, and volume confirms the move. In particular, a break above the moving average must be distinguished from an actual trend reversal. The 30-week moving average is Stan
This post contains Coupang Partners affiliate links. We may earn a commission from qualifying purchases.
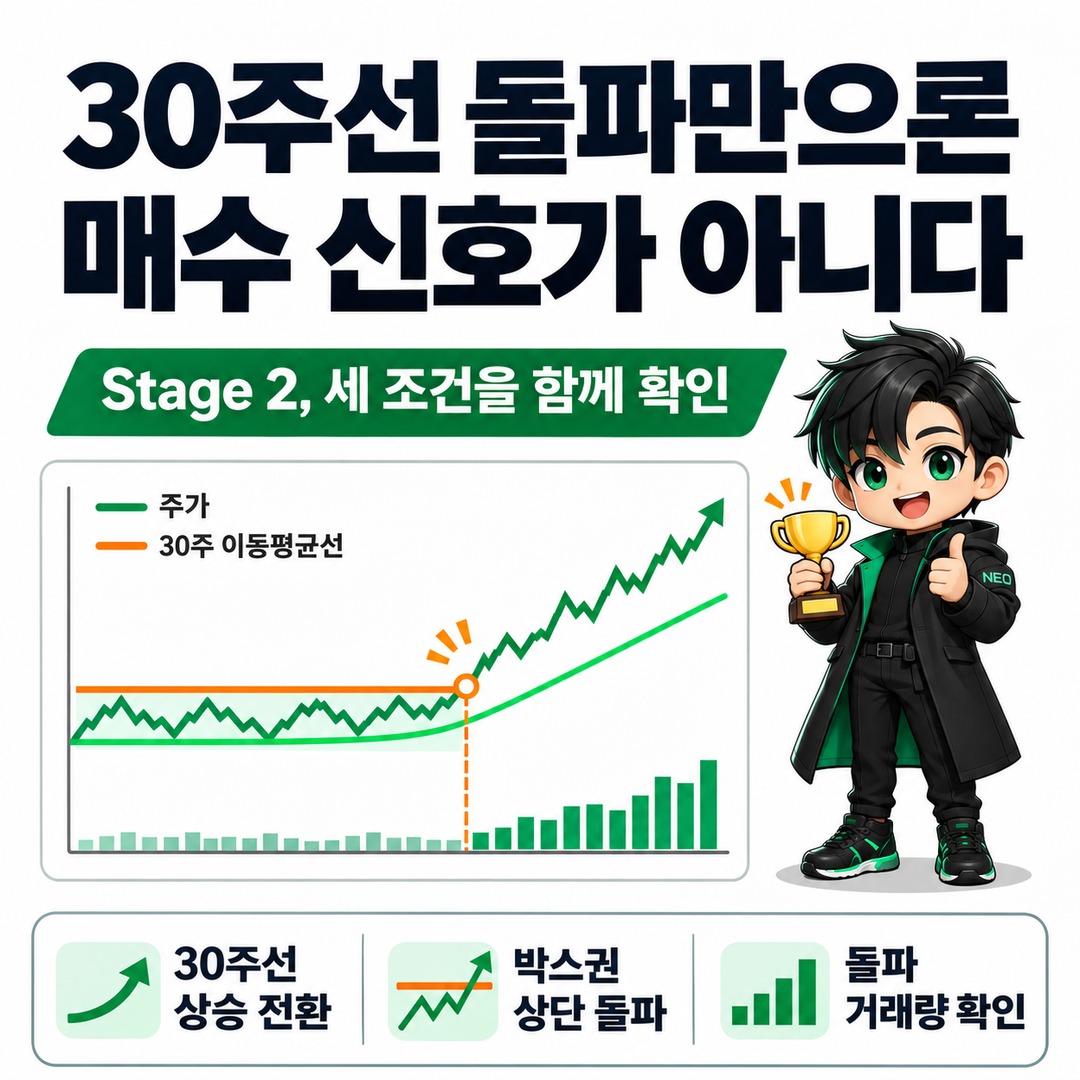
In Stan Weinstein’s Stage 2 trading method, the fact that a stock price has moved above the 30-week moving average does not, by itself, complete a buy signal. The key is whether the 30-week moving average turns upward on the weekly chart, price breaks above the top of the Stage 1 trading range, and volume confirms the move. In particular, a break above the moving average must be distinguished from an actual trend reversal.
Moving Above the 30-Week Moving Average Is Not the Same as Entering Stage 2
The 30-week moving average is a weekly-chart reference line Stan Weinstein used to identify the long-term trend in a stock.
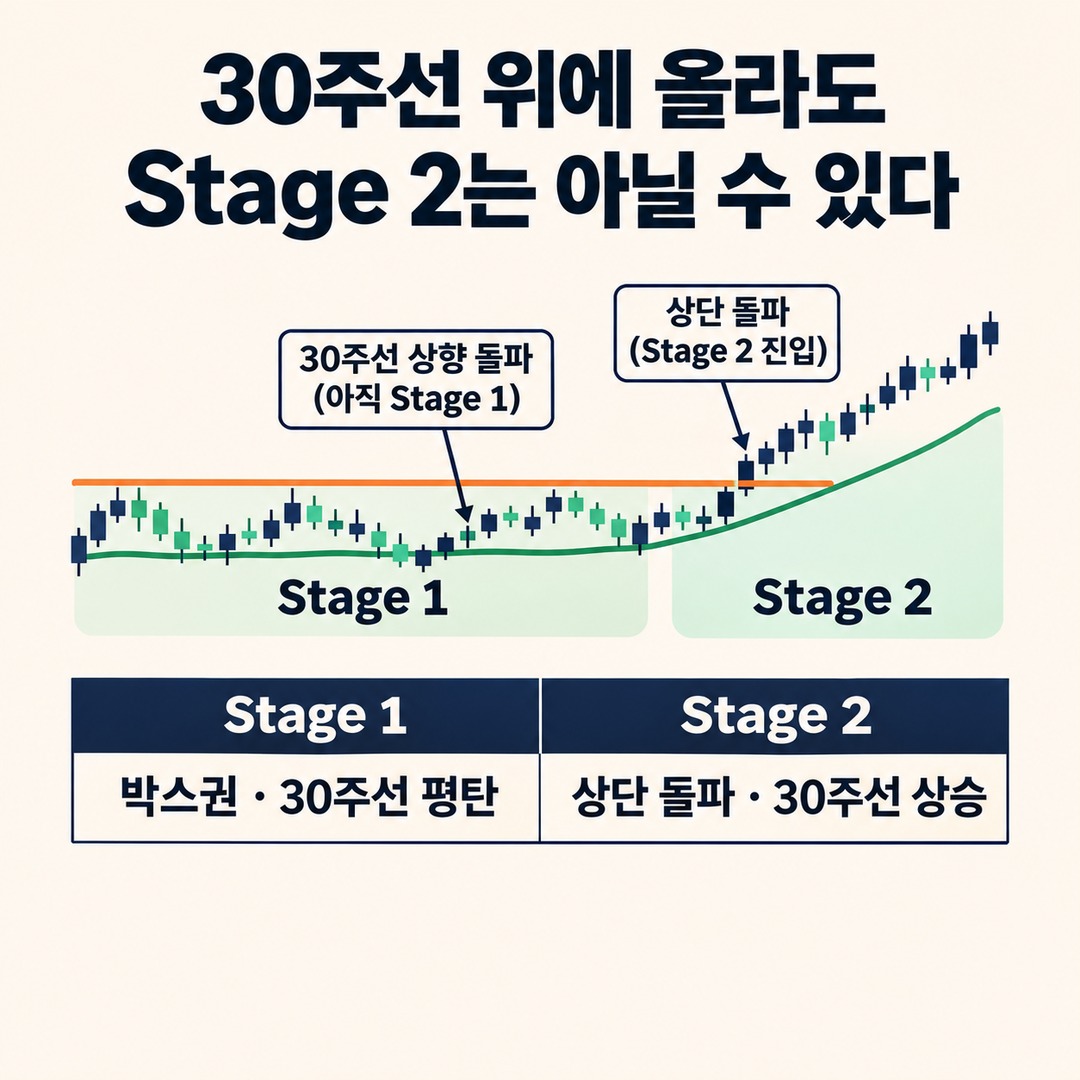
Therefore, do not classify a stock as Stage 2 just because it breaks above the 30-day moving average on a daily chart or rises above the 30-week moving average for a single day.
In Weinstein’s 1988 book, *Secrets for Profiting in Bull and Bear Markets*, the key distinctions between Stage 1 and Stage 2 are as follows.
Stage 1: The 30-week moving average, which had been falling, flattens out, and the stock price moves within a defined range.
Stage 2: The stock price breaks above the top of the Stage 1 trading range, and the 30-week moving average begins to slope upward.
Stage 3: After rising, the 30-week moving average flattens out, and the stock price begins to lose direction.
Stage 4: The 30-week moving average is falling, and the stock price is also trading below it.
There is an important distinction here.
A stock price crossing above the 30-week moving average is a starting point for assessing a possible trend reversal; it does not, by itself, mean that all buy conditions have been met.
This distinction can be confirmed by comparing the Google Books bibliographic information for Weinstein’s original book with its explanations of Stage 1 and Stage 2 in Chapter 2.
A Break Above the Trading Range Is Needed to Make an Actual Buy Decision
The key to Stage 2 is whether the price has broken through resistance from the previous consolidation range, rather than simply being above the moving average.
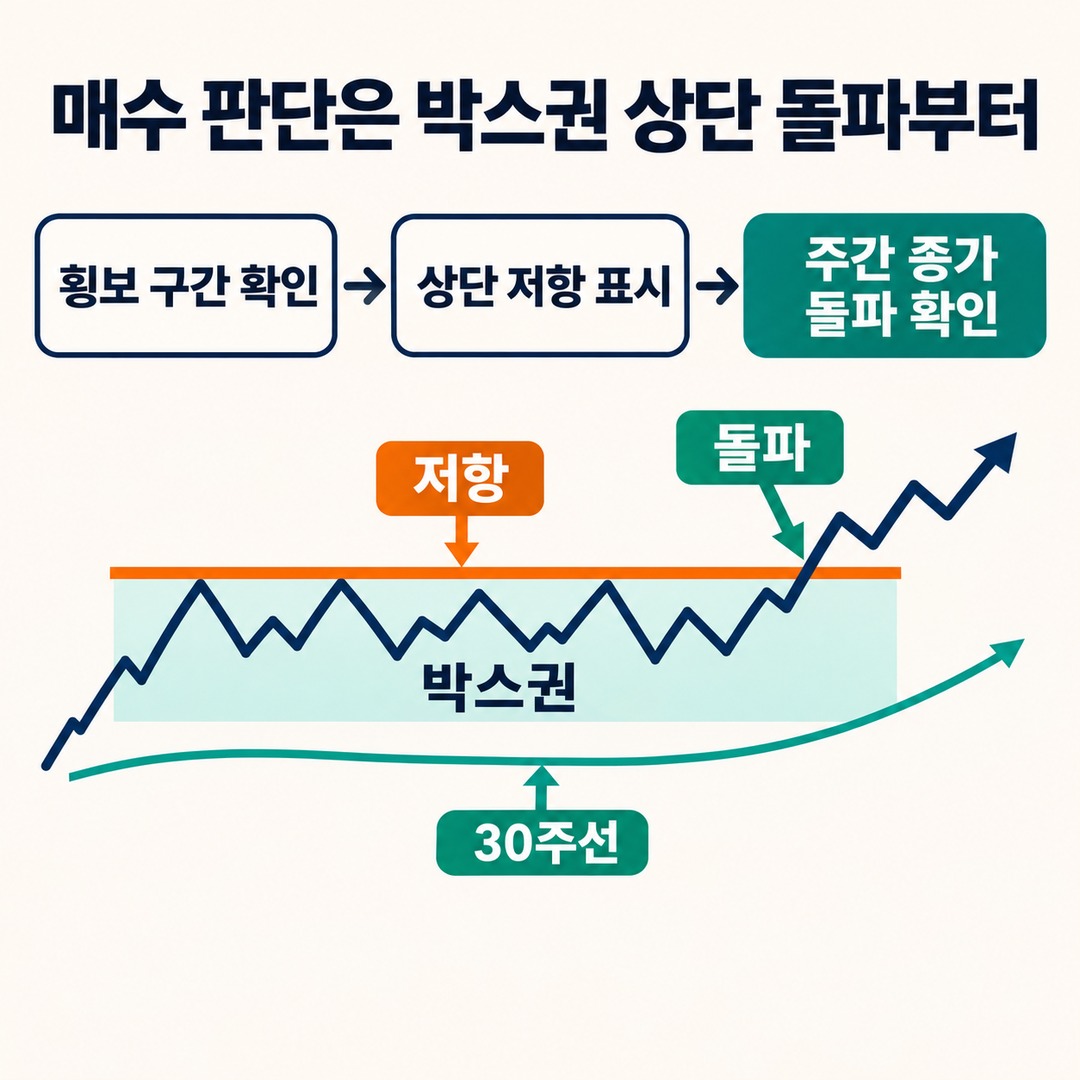
In Stage 1, the stock price moves within a trading range. At this point, the 30-week moving average loses its previous downward slope and begins to flatten.
Even if the stock price has moved above the 30-week moving average once, it cannot yet be considered a breakout from resistance if it has not cleared the top of the trading range.
Conversely, if the price clears the top of the trading range and the 30-week moving average also turns upward, the evidence for entering Stage 2 becomes stronger.
communaute.moning.coThe confirmation steps are as follows.
1. Check whether the previous downtrend has stopped.
2. Check whether the 30-week moving average’s downward slope is easing and beginning to flatten.
3. Mark the resistance price formed while the stock was consolidating.
4. Check whether the weekly close moves above the resistance price.
5. Check whether volume on the breakout increased meaningfully compared with usual levels.
6. Check whether the 30-week moving average turns upward.
The direction of the 30-week moving average is especially important in this process.
Even if the stock price is above the 30-week moving average, there is little reason to hastily classify it as a new Stage 2 uptrend if the average is still clearly declining.
Why Should You Be Cautious About a Breakout on Low Volume?
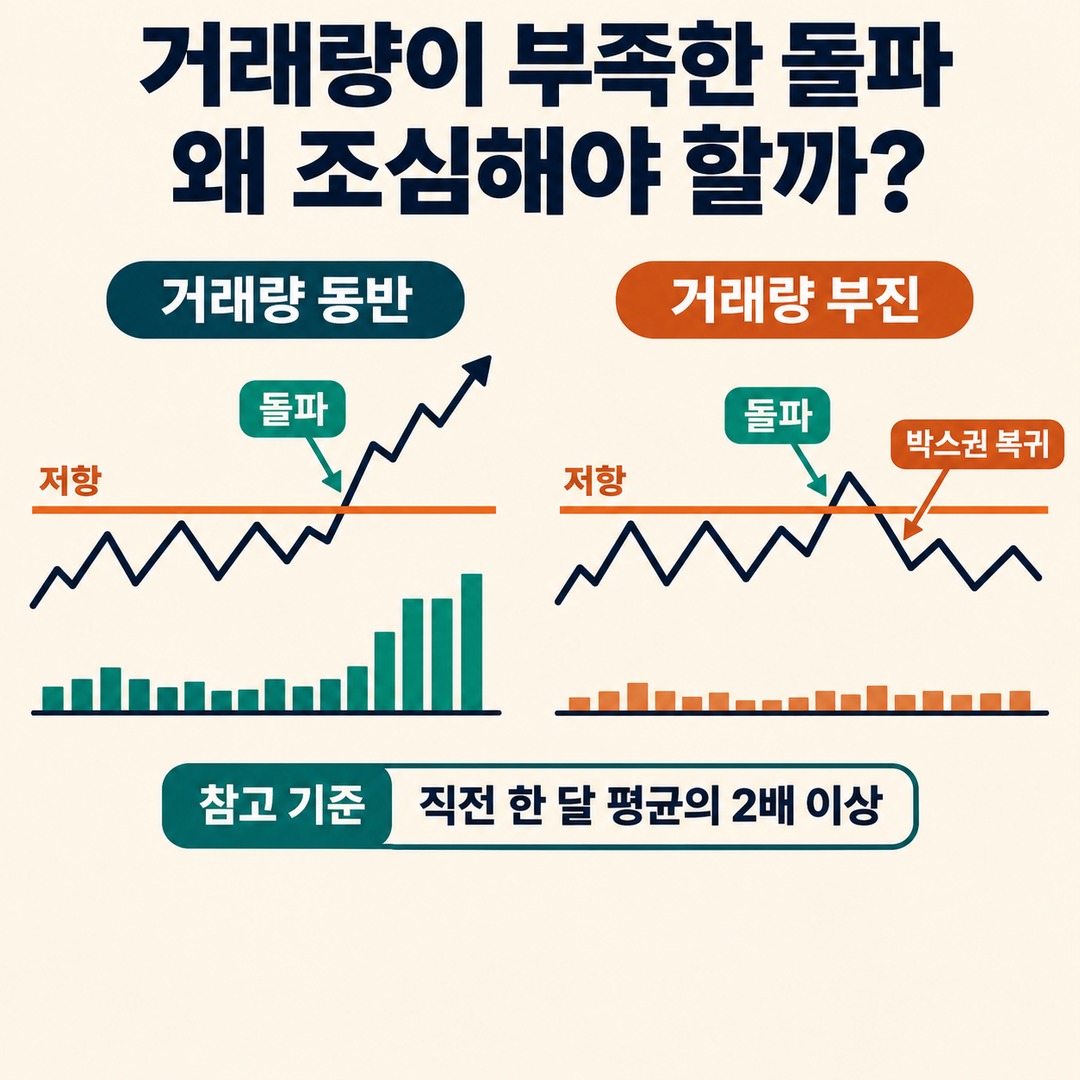
Weinstein treated an increase in volume at the time of a breakout as an important confirmation signal.
Chapter 4 of his original book also gives specific criteria for assessing volume.
Breakout-week volume is at least 2 times the average for the previous month.
Or, volume increases gradually over 3~4 weeks until it is sufficiently higher than the average of the preceding several weeks, with a further increase in volume during the breakout week.
However, these figures should not be treated as an absolute formula for success that applies to every stock. Weinstein did not consider any single multiple sufficient to identify a good breakout.
The key point in the discussion of volume in Chapter 4 of the original book is whether a meaningful increase in volume accompanies the breakout.
A breakout on low volume can fail when the price briefly rises above resistance only to return to the previous trading range.
Therefore, distinguish between the following two situations.
| Check | Relatively favorable pattern | Pattern to watch out for |
|---|---|---|
| Stock price | Breaks above the top of the trading range | Moves sideways below resistance |
| 30-week moving average | Flattens, then rises | Continues to fall |
| Volume | Increases during the breakout | Remains weak despite the breakout |
| Breakout holds | Holds above the previous resistance | Returns to the trading range |
tradingmomentum.substack.com## The Difference Shown by One of Weinstein’s Real Examples
Chapter 2 of Weinstein’s original book presents the example of Bethlehem Steel.
After a prolonged decline, the stock price moved above the 30-week moving average, but that move alone did not complete Stage 2.
The price later fell back below the 30-week moving average. On the next rise, volume increased as the price broke through the horizontal resistance formed by the consolidation range. The 30-week moving average also began to slope upward.
The point to note in this example is that the initial break above the moving average and the move above the top of the trading range were two separate processes.
In other words, confirming a break above the 30-week moving average once is not enough to make a buy decision; you need to check whether the price structure actually changes afterward.
In another example, the Stage 2 phase for International Paper in 1986 is described as having a pullback above a rising 30-week moving average, followed by successive advances that exceeded the previous highs.
Both examples are chart examples from Weinstein’s original book. They do not mean that the same results will recur in today’s market.
How Does Buying on the Breakout Day Differ from Buying the First Pullback?
Weinstein distinguished between the entry approaches of investors and traders.

For long-term investors, he suggested using the initial breakout and the first pullback as separate entry points. The approach is to invest part of the planned amount at the initial breakout, then invest the rest after the price returns near the breakout price and you confirm that the upward structure is still intact.
By contrast, Weinstein described a more aggressive approach for traders, who buy a larger portion of their planned position at the initial breakout.
This difference is not simply a technique for lowering the purchase price. It is a choice between allowing time to confirm whether the breakout succeeds and avoiding missing the early advance.
| Entry approach | Advantage | Risk to consider |
|---|---|---|
| Initial breakout | Potential to enter early in the advance | Exposure to a failed breakout |
| First pullback | Allows you to confirm whether the breakout holds | May miss the opportunity if the price rises without a pullback |
| Chasing after a substantial rise | May allow you to participate in further gains | The stop-loss level may be farther away, making the risk-reward trade-off less favorable |
Weinstein also emphasized the importance of checking whether volume declines during the first pullback and whether the stock price holds above the breakout price.
There is one misconception to avoid here.
Always waiting for a pullback is not the right answer. Strong stocks may continue rising after a breakout without a substantial pullback. Conversely, if the price returns to the previous trading range after the breakout, you should reconsider your original buy thesis.
Set Your Stop-Loss Price Before Buying
In Stage 2 trading, deciding only on an entry price and failing to set a stop-loss price leaves out an important part of the decision.
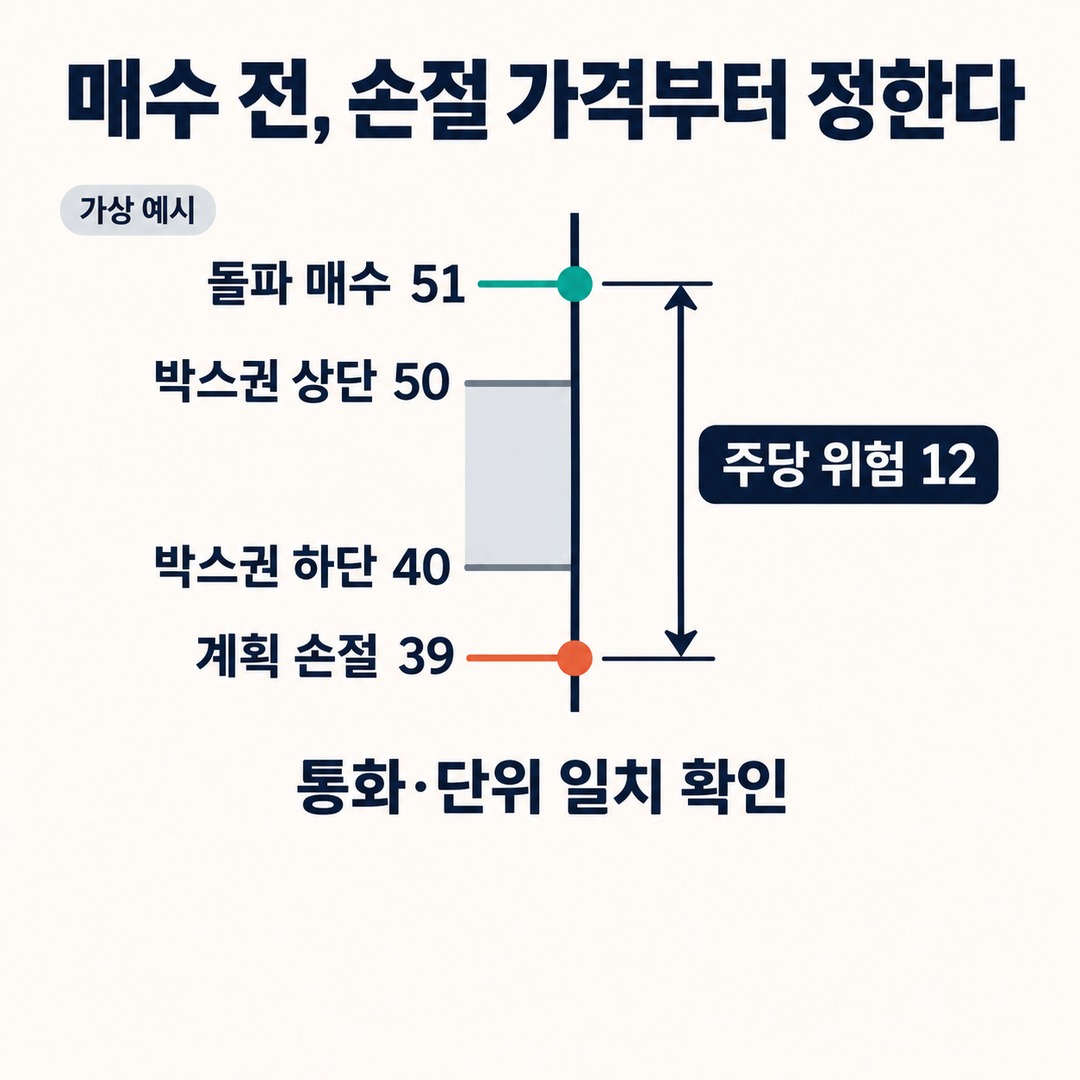
If you are buying the initial breakout, decide in advance what would count as a failed breakout, using the bottom of the previous trading range or the support structure as a guide.
For an entry on a pullback, you can calculate the risk based on the low reached during the pullback.
The following is a hypothetical example, not the price of an actual stock.
Bottom of the trading range: 40
Top of the trading range: 50
Breakout purchase price: 51
Planned stop-loss price: 39
Author’s calculation:
51−39=121The planned risk per share is 12.
Assuming the account is KRW 30,000,000 and the loss you are willing to risk on a single trade is set at 1% of the account, the calculation is as follows.
30,000,000×0.01=300,000300,000÷12=25,000Therefore, the position size calculated based on a per-share risk of 12 is not 25,000 shares; the account and stock price must use the same units. The position size will be completely different if the units are confused—for example, using KRW 300,000 instead of KRW 3,000,000 as the risk limit, or KRW 120,000 instead of KRW 12 as the risk per share.
For an accurate calculation, enter the actual stock price, the 1 loss per share in Korean won, and the account risk limit using the same currency and units.
Also, the actual execution price may differ from the stop-order price. You should account for additional losses caused by a sharp drop, a gap down, a trading halt, or insufficient liquidity.
Check Relative Strength and Overall Market Conditions Too
The Relative Strength Weinstein refers to is different from the RSI.
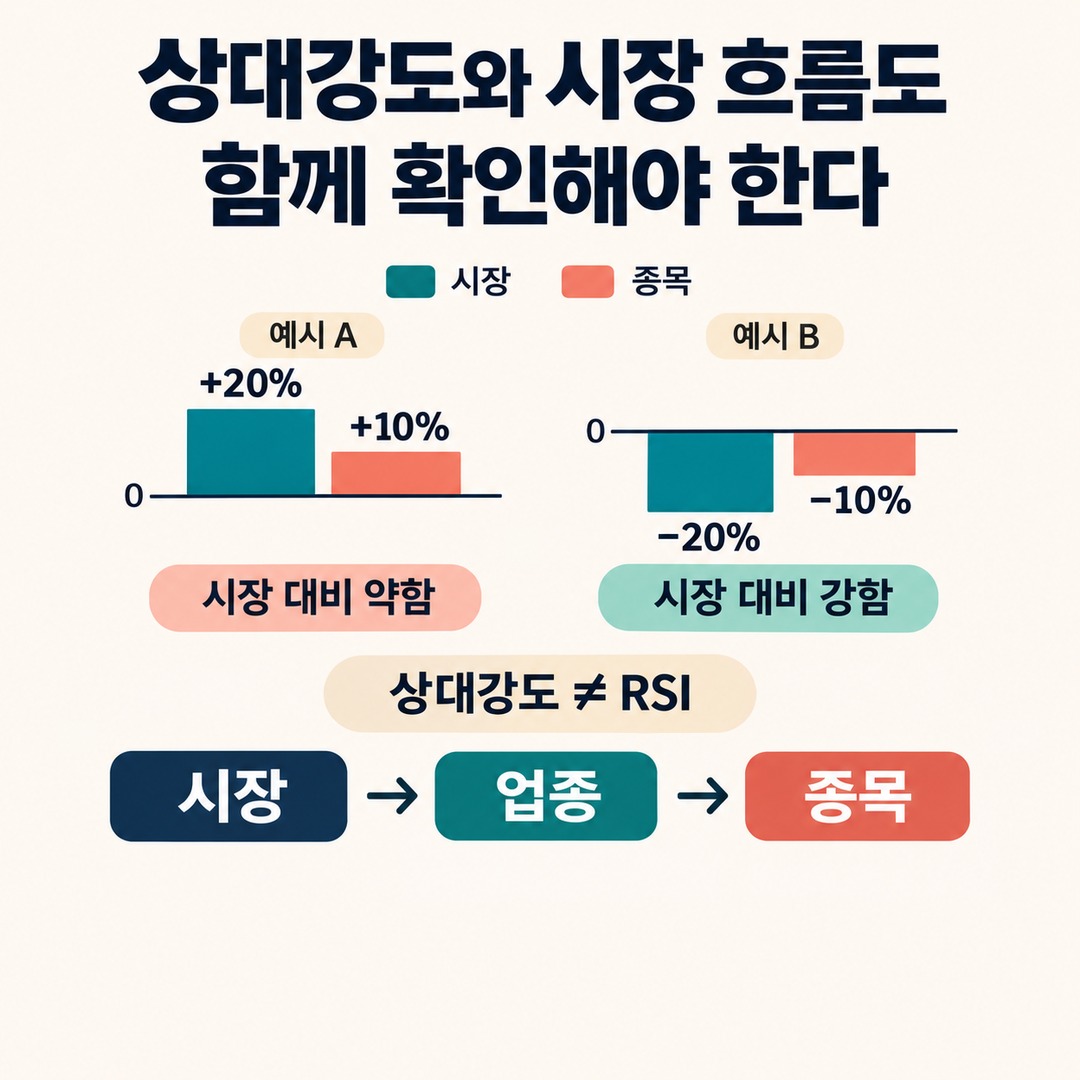
Relative strength is a way of assessing how strongly a stock is moving compared with the overall market.
For example, if the market rose 20% over the same period while a stock rose 10%, the stock price still went up, but its performance relative to the market was comparatively weak.
Conversely, if the market fell 20% while a stock fell only 10%, the stock showed relative strength compared with the market.
This is a way to distinguish a simple price increase from market-leading strength.
Weinstein also described an approach that first considers the market and industry trends, then evaluates individual stocks.
It is useful to look at these three factors together.
Market: Is the overall index trend favorable?
Industry: Is the industry the stock belongs to also strong?
Stock: Is it outperforming the market over the same period?

There is no need to add a rigid rule that all these conditions must be met, but there is also little reason to prioritize buying a stock with weak relative strength simply because it has broken above the 30-week moving average.
Final Checklist Before an Actual Purchase
To clarify the position-size calculation in the hypothetical example above: if the account risk limit is 300,000 and the risk per 1 share is 12, the calculated position size is 25,000 shares.
300,000÷12=25,000 shares. This is a hypothetical calculation that excludes commissions, taxes, and slippage; the actual number of shares you can buy also depends on the stock price and the amount available for the order.
In practice, you can check the following in order.
Have you applied the 30-week moving average to the weekly chart?
Has the 30-week moving average stopped declining and turned upward?
Has the price closed above the top of the Stage 1 trading range on the weekly chart?
Did volume increase meaningfully from recent levels during the breakout?
Is relative strength improving compared with the market and industry?
Have you distinguished the breakout price from the previous support area?
Have you set a stop-loss price in advance in case the breakout fails?
Has the stock price already risen too far above the 30-week moving average?
The final point is especially easy to overlook.
In his original book, Weinstein explains that even as Stage 2 progresses, if the stock price moves too far above the 30-week moving average and the average’s upward slope begins to flatten, the decision should be closer to holding than to making a new purchase.
Conclusion: A Break Above the 30-Week Moving Average Is a Signal to Start Watching, Not a Buy Button
If you reduce Stan Weinstein’s Stage 2 strategy to “a way to buy above the 30-week moving average,” you will miss important conditions.
The actual key points are these three.
1. Has the previous downtrend stopped, and has the 30-week moving average turned upward?
2. Is the stock price breaking through the Stage 1 resistance area with rising volume?
3. Are the previous support structure and uptrend holding after the breakout?
The initial breakout may offer an entry opportunity, while the first pullback may provide an additional opportunity to assess the quality of the breakout.
However, neither approach eliminates the possibility of failure.
Rather than buying a stock as soon as it moves above the 30-week moving average, deciding whether to enter after checking for a break above the trading-range ceiling, volume, and a stop-loss level is more consistent with Weinstein’s Stage KRW 2 approach.
Stage 2 is a technical analysis framework for classifying trends and choosing when to trade, not a formula that guarantees profits.
※ This article is for informational purposes to help readers understand market trends and is not a recommendation to invest in any particular stock or asset. You are responsible for your own final decisions and investments.
This post contains Coupang Partners affiliate links. We may earn a commission from qualifying purchases.