

Bitcoin Trades Sideways Around USD 64,000: Why USD 66,000 Still Matters Despite Renewed ETF Inflows
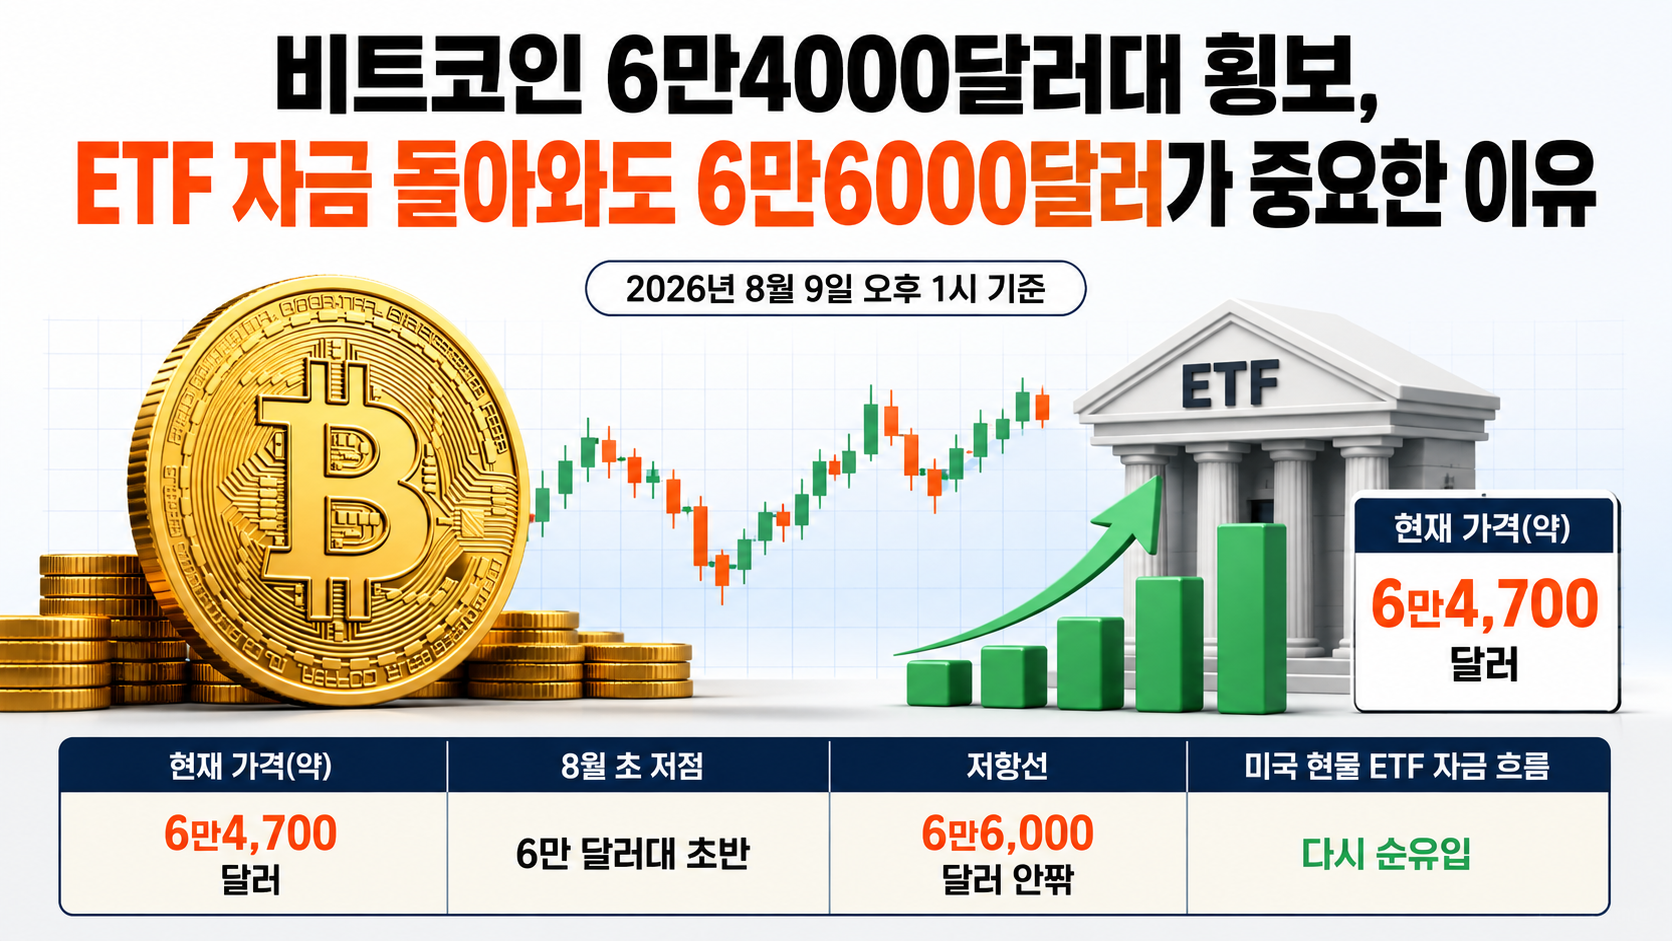
As of 1 p.m. on 2026-08-09, Bitcoin was trading at approximately USD 64,700. Although money has begun flowing back into U.S. spot Bitcoin ETFs and the price has rebounded from its early-August low, Bitcoin has yet to make a decisive move above USD 66,000.
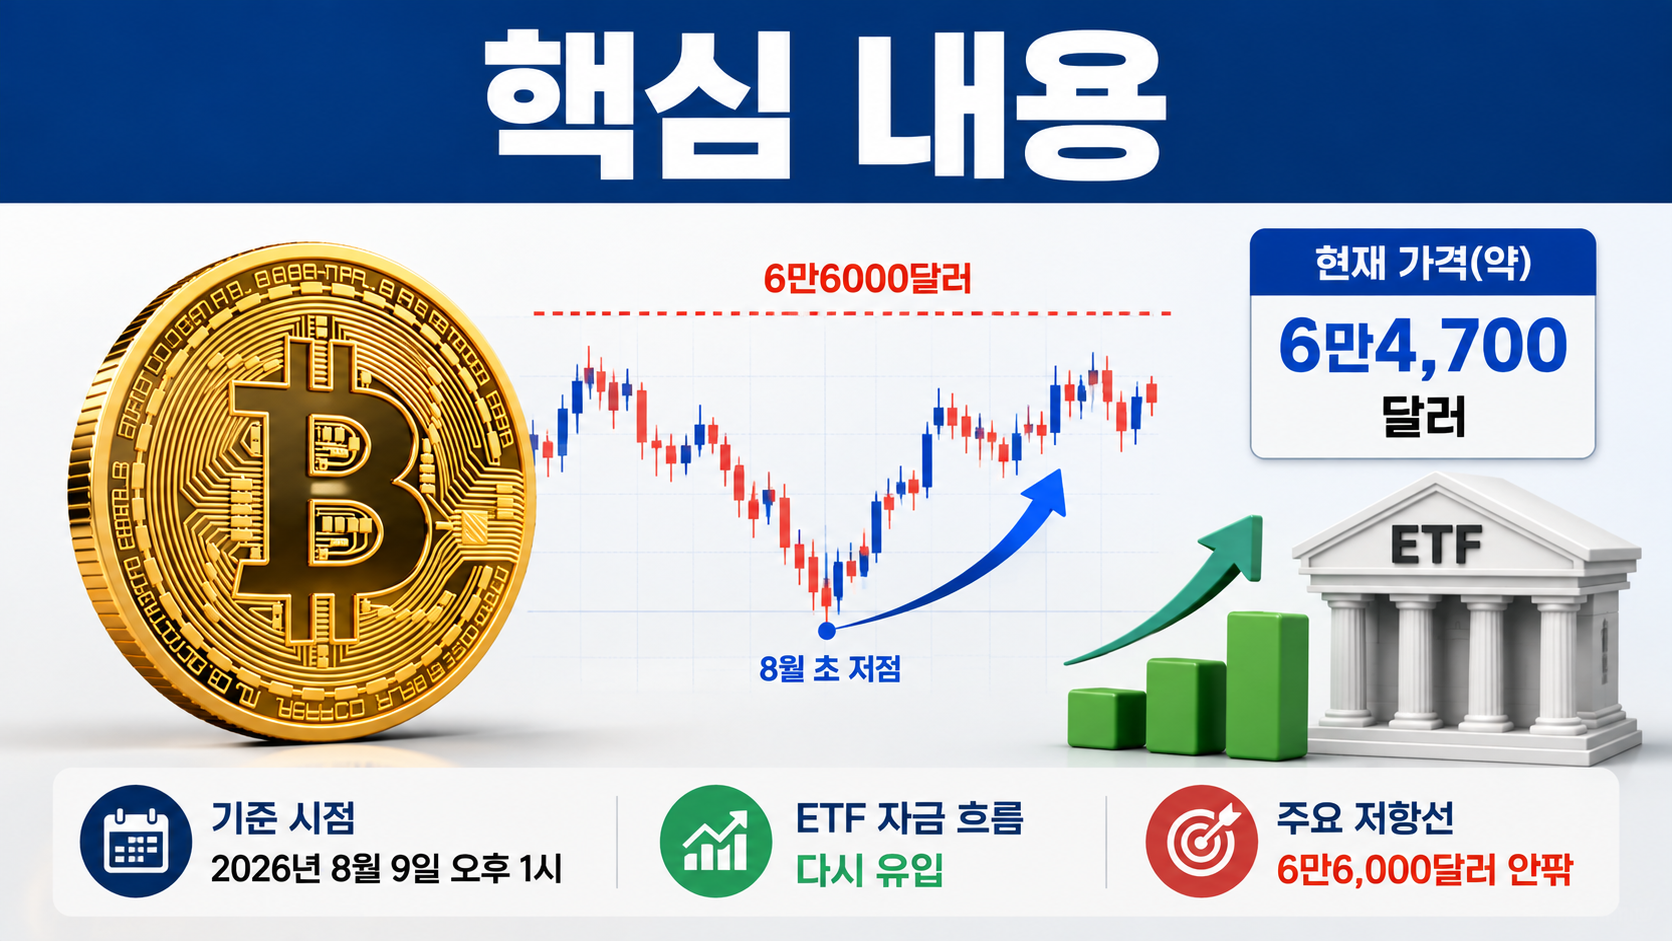
The market currently looks less like an established uptrend and more like a period of consolidation around the middle of the USD 60,000 range, with traders waiting for the next directional move.
Daily Price Movements Have Become Remarkably Narrow
Bitcoin was trading at approximately USD 64,745 when checked on August 9.
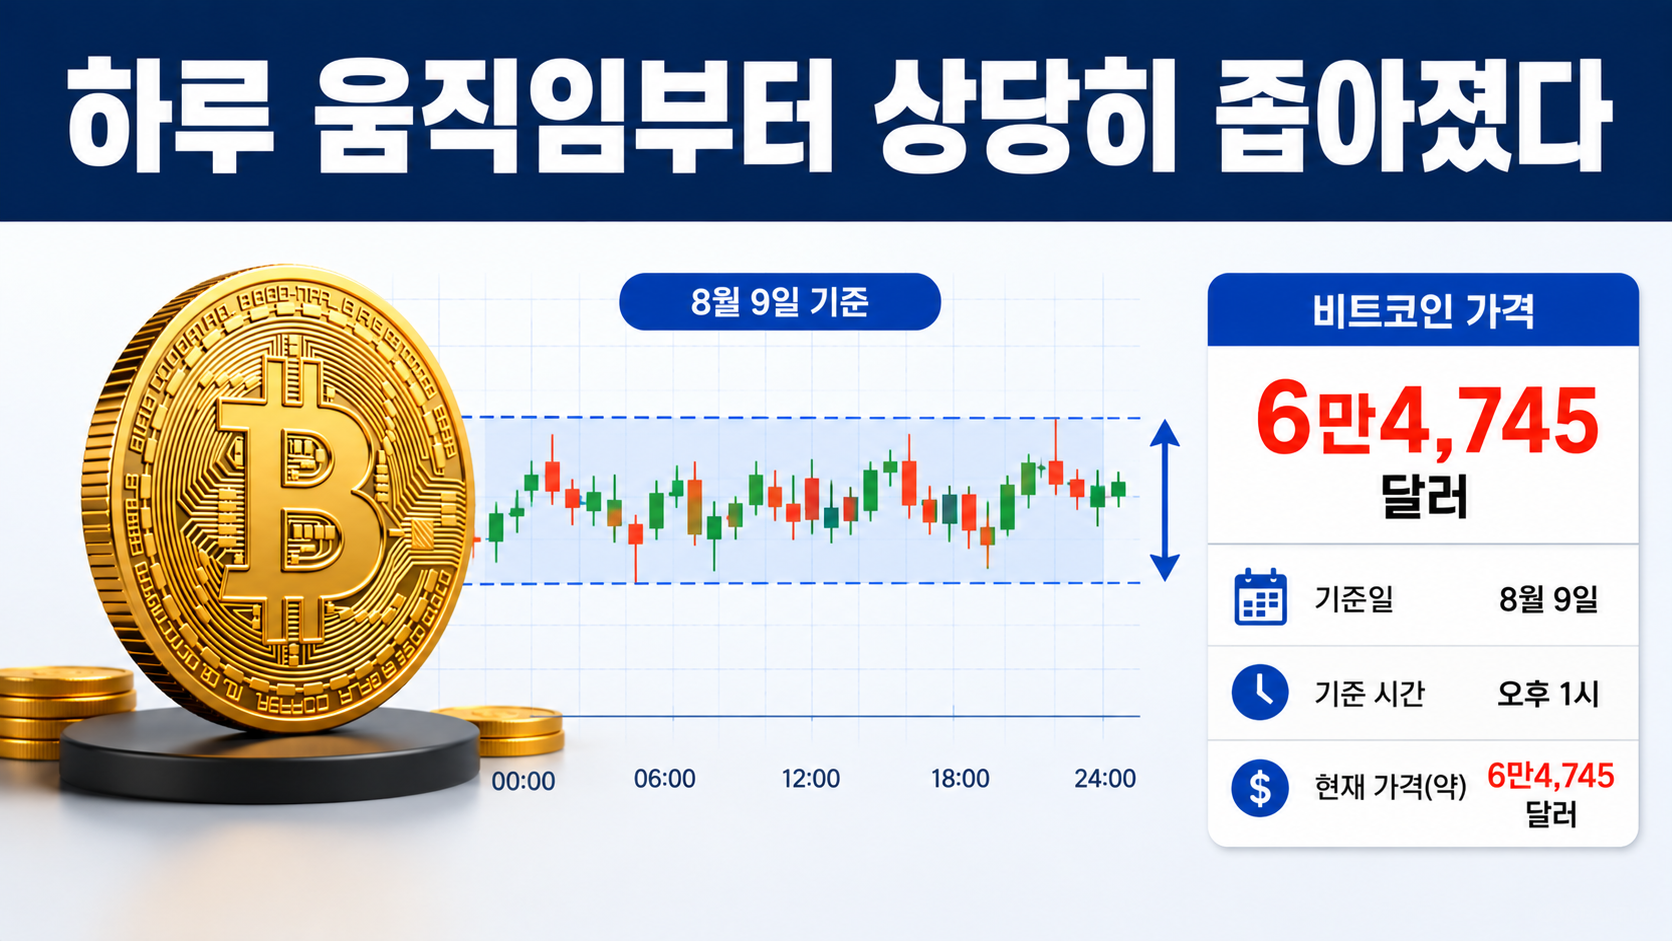
The day's low was approximately USD 64,696, while the high reached USD 65,140. The difference between the high and low was USD 444.
Author's calculation:
(65,140 - 64,696) ÷ 64,696 × 100
= approximately 0.69%
Considering Bitcoin's usual volatility, this represents a relatively narrow daily trading range.
After falling below USD 63,000 in early August, Bitcoin recovered into the USD 64,000 range. However, buying pressure has not yet clearly demonstrated enough strength to push prices to another level following that rebound.
It is therefore too early to conclude that a new bull market has begun based on the current price alone.
Why Is Bitcoin Not Rising Despite ETF Inflows?

One factor recently supporting Bitcoin prices has been investment flows into U.S. spot Bitcoin ETFs.
In early August, capital began flowing back into spot Bitcoin ETFs. Cumulative net inflows recorded from August 3 through 5 totaled approximately USD 626,000,000.
These ETF inflows indicate that investment demand, including institutional demand, has not completely disappeared.
However, money flowing into ETFs does not necessarily mean Bitcoin prices will rise immediately.
That is because selling by existing holders, futures market positioning, the U.S. dollar, U.S. Treasury yields, and overall risk appetite can all influence prices simultaneously.
ETF flows are one useful indicator for assessing market direction, but they are difficult to interpret as a standalone buy or sell signal.
Why the USD 66,000 Level Matters
The first thing to watch is whether Bitcoin can hold above USD 65,000.
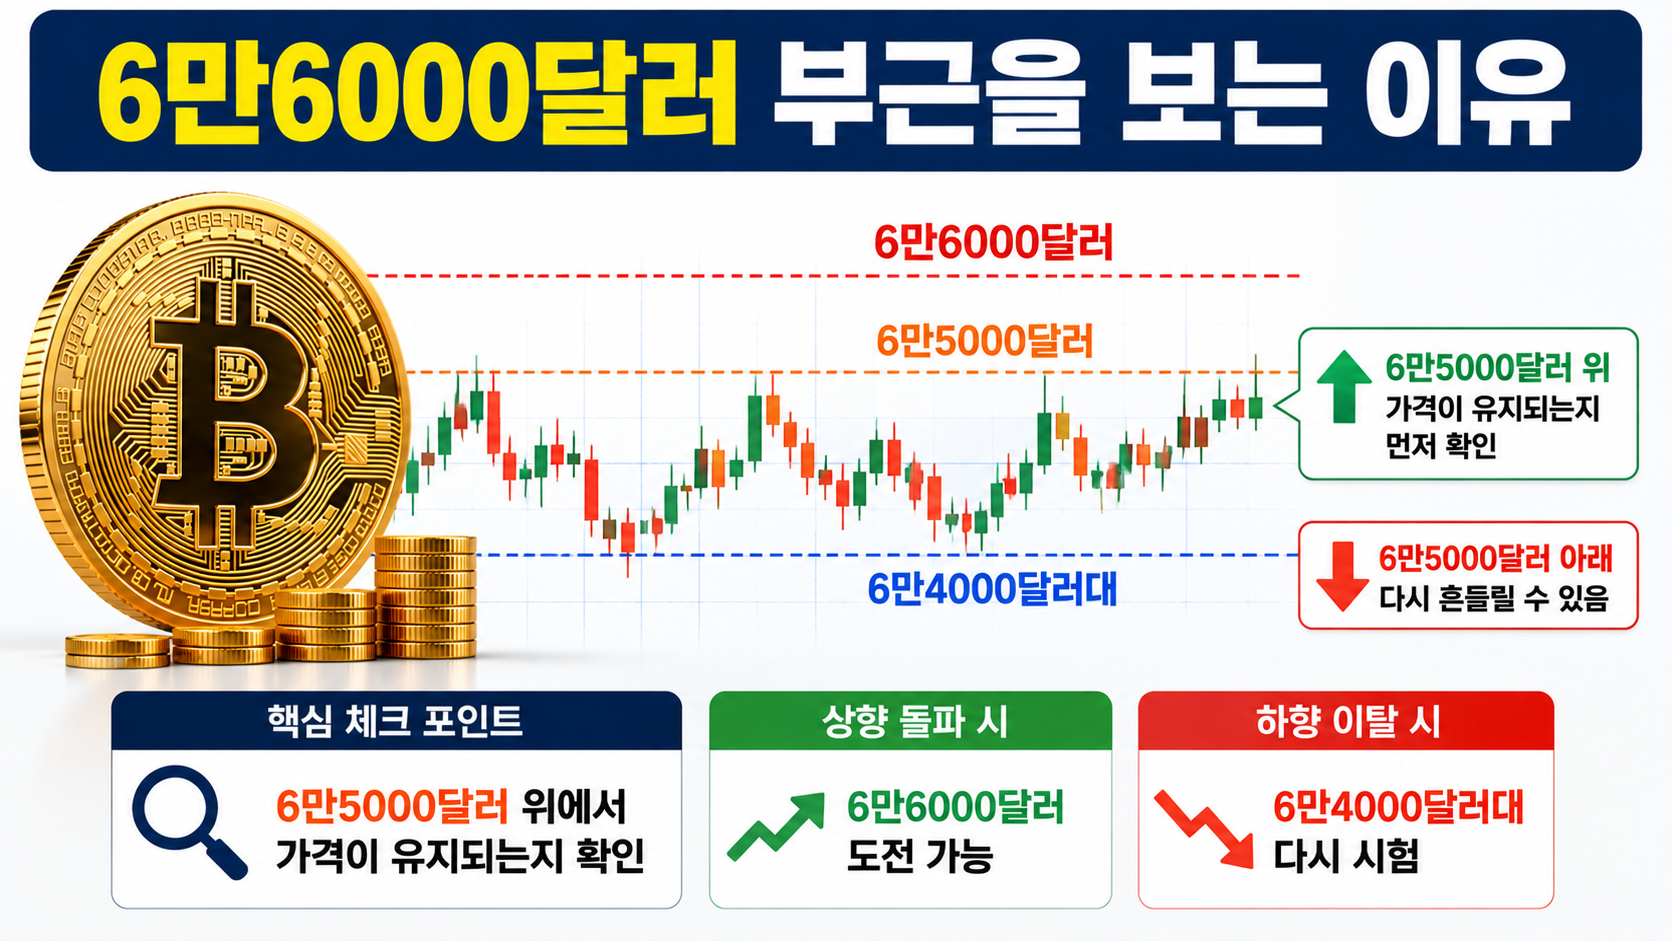
Even on August 9, Bitcoin climbed as high as USD 65,140 before retreating into the USD 64,000 range.
Looking at a broader timeframe, Bitcoin closed at approximately USD 66,436 on July 21. Despite the recent rebound, it has not yet recovered that price level.
Compared with the current price of approximately USD 64,745, the difference is about USD 1,691.
Author's calculation:
(66,436 - 64,745) ÷ 64,745 × 100
= approximately 2.61%
In other words, Bitcoin would need to rise by approximately another 2.6% to reach the USD 66,400 area and retest the price range established during the recent decline.
Therefore, rather than merely moving above USD 65,000 momentarily, what matters more is whether Bitcoin can break through the 65,000–USD 66,400 zone and sustain prices above it.
This is why confirming that a breakout holds is more important than the breakout itself.
A Drop Below USD 63,000 Would Change the Picture
There is no reason to focus exclusively on upside scenarios.
In early August, Bitcoin fell to approximately the 62,000–USD 63,000 range before rebounding. The USD 63,000 range has also repeatedly emerged as a reference point for identifying the market's short-term lower boundary.
As long as Bitcoin continues trading sideways around USD 64,000, it is helpful to distinguish three possible price scenarios.
If Bitcoin falls below approximately USD 63,000 again
There would be stronger grounds to conclude that the rebound from early August is losing momentum.
If Bitcoin trades within the 64,000–USD 65,000 range
This would represent a continuation of the current sideways market, with no clear direction established.
If Bitcoin moves above USD 65,000 and recovers into the USD 66,000 range
The next step would be to determine whether the price is genuinely breaking out above the recent trading range.
Rather than focusing on a single touch of a price level, it is important to examine the daily closing price alongside subsequent market movements.
Interest Rate Expectations Could Also Disrupt Bitcoin's Trading Range
Recent U.S. employment data have also contributed to Bitcoin's rebound.
On August 7, weaker-than-expected U.S. employment-related data reduced concerns about the possibility of an interest rate increase by the U.S. Federal Reserve in September, improving sentiment toward risk assets, including Bitcoin.
However, the direction of U.S. monetary policy has not been definitively settled.
Federal Reserve officials have also maintained that they may take necessary action if inflation continues to exceed their target.
For that reason, investors should monitor U.S. inflation, employment conditions, and Treasury yield movements alongside Bitcoin price charts.
Higher interest rate pressures could weigh on risk assets. Conversely, if inflationary pressures ease and interest rate concerns diminish, Bitcoin may have greater room to test the upper boundary of its trading range.
Three Things to Check Instead of Trying to Predict the Next Move
The order of priorities in the current market is relatively straightforward.
First, watch whether Bitcoin can defend its recent lower boundary around USD 63,000.
Second, check whether it can move above USD 65,000 without immediately falling back.
Third, monitor whether U.S. spot Bitcoin ETF inflows continue as the price recovers into the USD 66,000 range.
If prices rise first but ETF inflows weaken again, or if macroeconomic conditions become unfavorable for risk assets, any breakout may fail to hold for long.
Conversely, if prices and capital flows improve simultaneously, there would be stronger evidence that Bitcoin has moved beyond its current sideways trading range around USD 64,000.
USD 64,000 Looks More Like a Waiting Zone Than a Directional Signal
Bitcoin's return to the USD 64,000 range is meaningful because it represents a recovery from the lows reached in early August.
However, Bitcoin has not yet regained the recent price levels around USD 66,000, and its daily trading range has narrowed.
It is therefore difficult to conclude that the market is firmly in either a strong uptrend or a strong downtrend.
The most practical way to assess the current trading range is to check, in order, whether support near USD 63,000 holds, whether Bitcoin breaks above USD 65,000 and establishes itself there, and whether it ultimately recovers into the USD 66,000 range.
Cryptocurrency prices can experience substantial volatility even over short periods. The price levels discussed above are reference points based on publicly available market data to help distinguish current market conditions. They are not forecasts guaranteeing returns or that any particular price will be reached.
---
※ This article is provided for informational purposes to help readers understand market trends and does not constitute investment advice or a recommendation to buy or sell any particular security or asset. All final investment decisions and responsibility rest with the individual investor.