

Linda Raschke’s Holy Grail Trading Strategy: Original Rules and Verification Criteria from ADX 30 Through Entry, Stop-Loss, and Exit
Linda Bradford Raschke’s Holy Grail is a trading method that enters in the direction of a strong trend when price pulls back to the 20-period exponential moving average (EMA). Its core rules are ADX above 30 and rising over 14 periods, a pullback to the EMA 20, entry on a break above the previous bar’s high, and a stop below the recent swing low
This post contains Coupang Partners affiliate links. We may earn a commission from qualifying purchases.
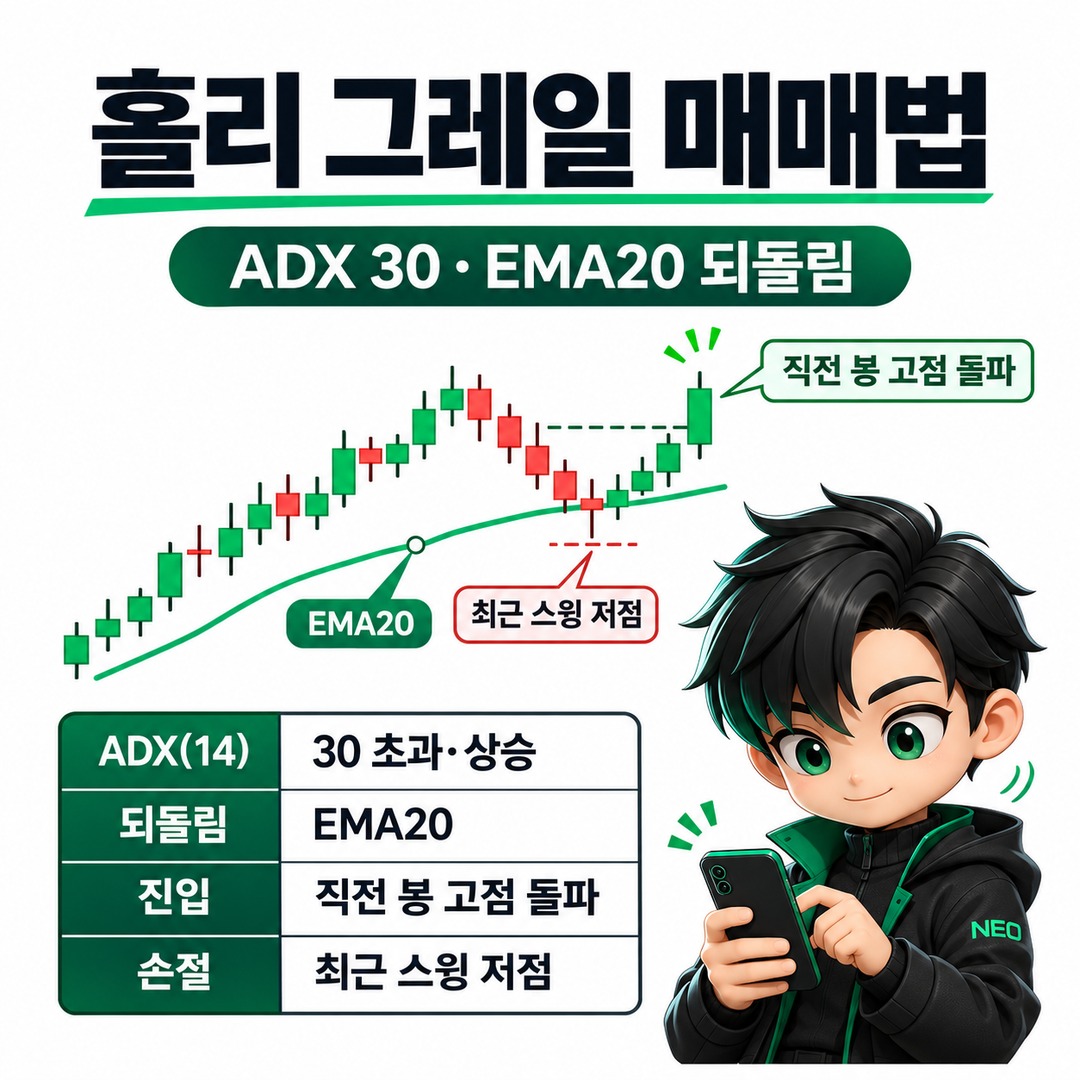
Linda Bradford Raschke’s Holy Grail is a trading method that enters in the direction of a strong trend when price pulls back to the 20-period exponential moving average (EMA). Its core rules are ADX above 30 and rising over 14 periods, a pullback to the EMA 20, entry on a break above the previous bar’s high, a stop below the recent swing low, and an exit at the swing high. However, the original rules and a backtested strategy that accounts for trading costs are not the same.
The Holy Grail’s Entry and Stop-Loss Rules in the Original Source
Raschke’s buy rules, published in the August 1997 AIQ Opening Bell interview, have four steps. For sells, apply them in the opposite direction.
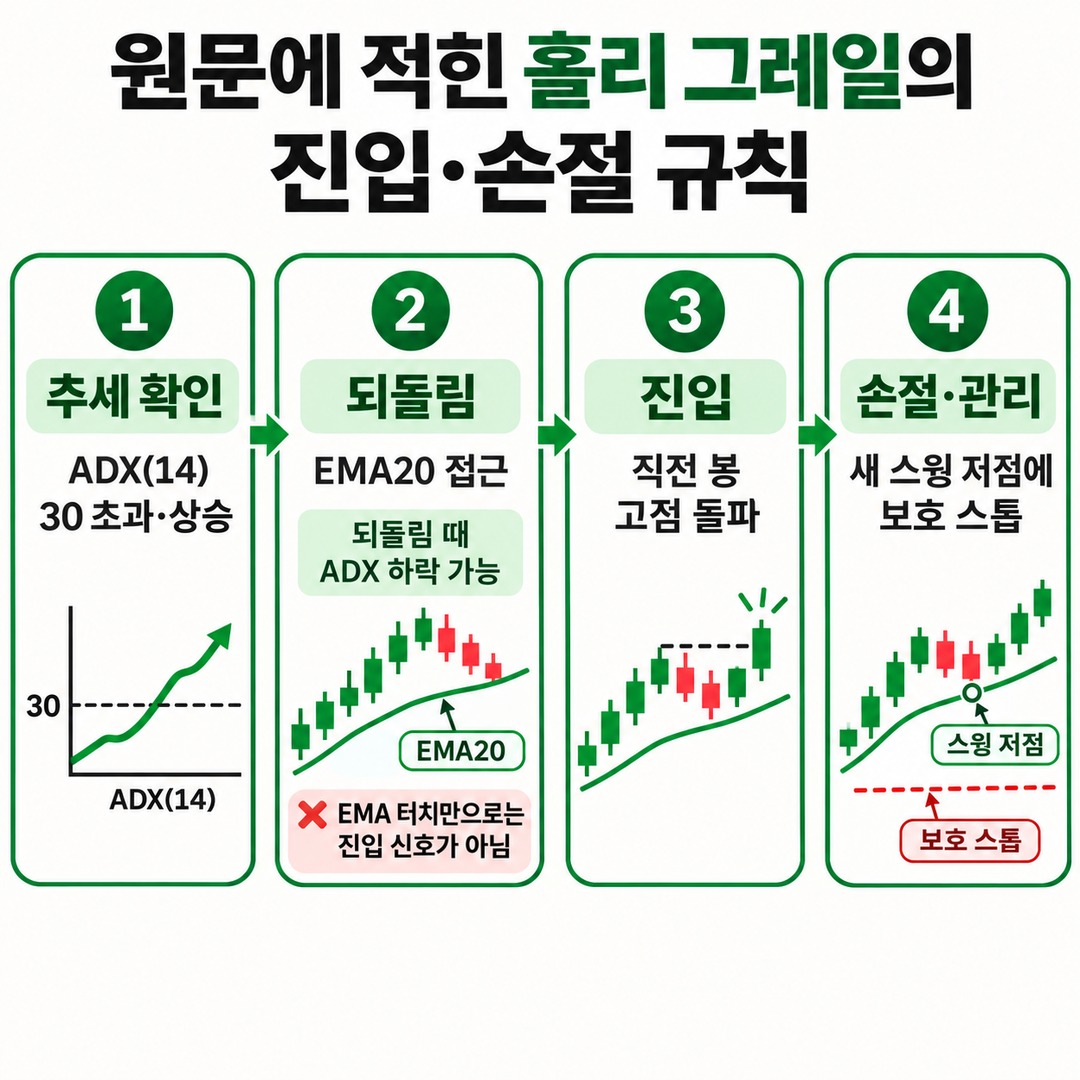
| Step | Original rule | What it means in practice |
|---|---|---|
| 1. Confirm the trend | ADX (14) above 30 and rising | A strong trend must already be in place |
| 2. Pullback | Price approaches the EMA 20 | Look for a correction within an uptrend |
| 3. Entry | Place a buy stop above the previous bar’s high | Touching the EMA alone is not a buy signal |
| 4. Stop-loss and management | Place a protective stop at the newly formed swing low | Adjust the stop to follow the price if the trade becomes profitable |
These four points can be found on page 3 of the 1997-year original interview PDF, where Raschke describes the method herself.
There is one important distinction here.
This should not be read to mean that ADX must keep rising at the moment the pullback occurs.
The original source describes ADX first moving above 30 and rising, after which price pulls back to the EMA 20. It notes that this pullback is often accompanied by ADX turning downward.
The following two conditions should therefore be distinguished.
Original sequence: confirm strong ADX → price pulls back → touches the EMA 20 → enter on a break above the previous bar’s high
Strict mechanical interpretation: allow entry only if ADX is higher than the previous day’s reading on the day price touches the EMA 20
The second condition is stricter than the first. If the two conditions are mixed in a backtest, it is difficult to describe the results as the performance of the original strategy.
A Trailing Exit and a Price Target Are Not the Same Rule
The fourth rule in the original description of the Holy Grail is to place a protective stop at the swing low and move the stop up as the trade becomes more profitable.

These three items should be kept separate.
1. Initial stop-loss: Place a protective stop below the newly formed swing low.
2. Trailing stop: If price subsequently moves in a favorable direction, adjust the stop upward.
3. Price target: A retest of the recent swing high is a price target described in the original example; it is not a fixed profit-taking multiple specified in the four rules.
In particular, the original source from 1997 does not require a specific 2R or 3R profit target.
In the August 2000 Active Trader interview, Raschke also describes taking partial profits when a target has been reached but further gains are uncertain, as well as managing the position based on price action. This illustrates discretion in actual trading; it should not be recast as a fixed exit formula for the Holy Grail.
Where the Original Rules and Backtest Implementation Differ
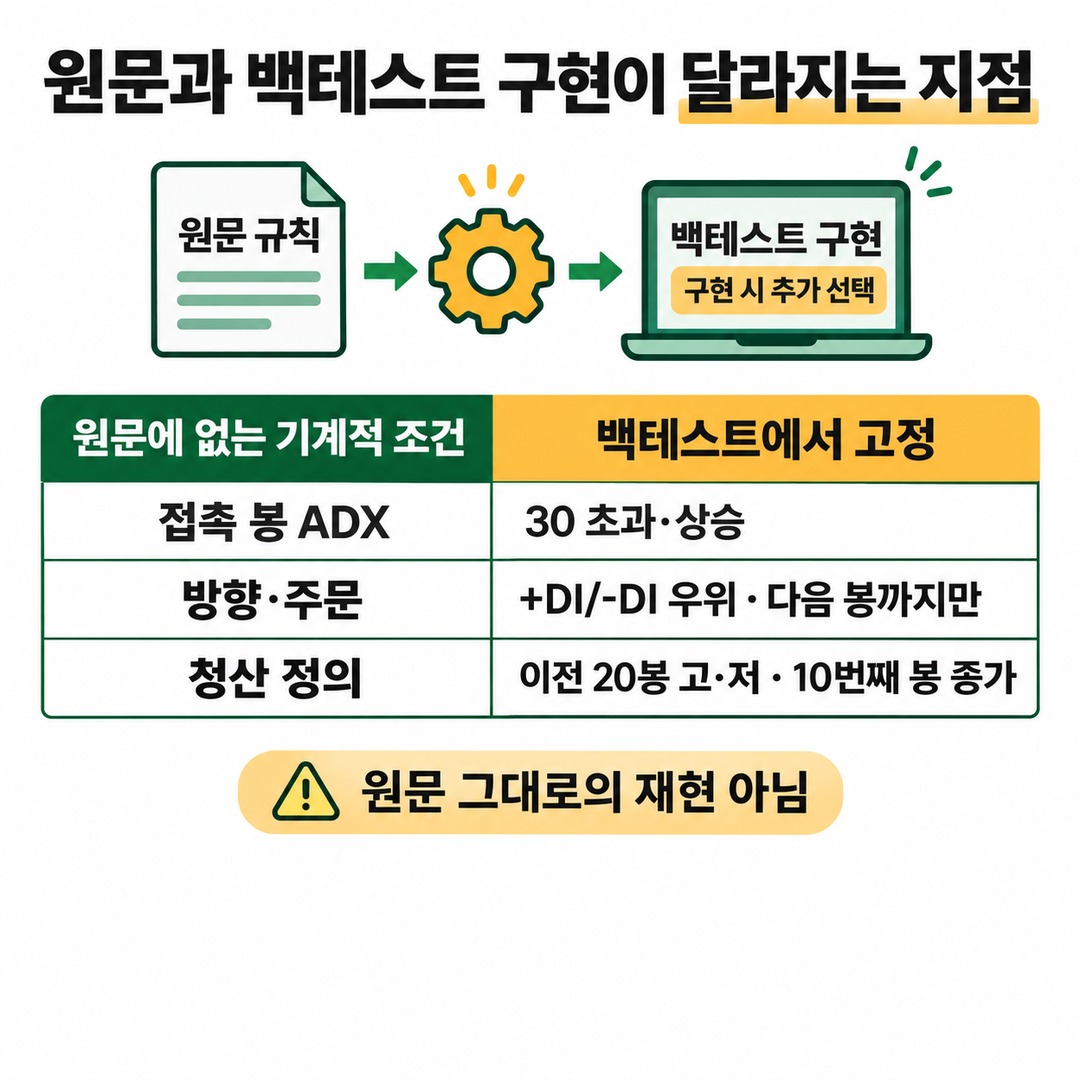
October 2026 public validation case2026-10-20 EdgeLab’s published validation of the Holy Grail shows what conditions need to be added to test the original rules on a computer.
However, this validation should not be interpreted as a complete reproduction of the original rules.
EdgeLab fixed the following conditions separately.
ADX must be above 30 and rising on the bar that touches the EMA 20 as well
Distinguish long trades by +DI dominance and short trades by -DI dominance
A breakout order above the high of the EMA-touch bar remains valid only through the next bar
The initial stop-loss is set at the low or high of the setup bar
The target price is the highest high or lowest low of the 20 bars before the setup
Exit at the close of the 10th bar if neither the target nor the stop-loss has been reached
Some of these are mechanical definitions absent from the original source. In particular, the fixed price target and exit after 10 bars were added to complete the test.
The test results should therefore be read as the results of an implemented version using the stated assumptions, rather than as the performance of the original strategy itself.
What Changes When Costs Are Included?
EdgeLab’s published cost assumptions differ for ETFs and futures.
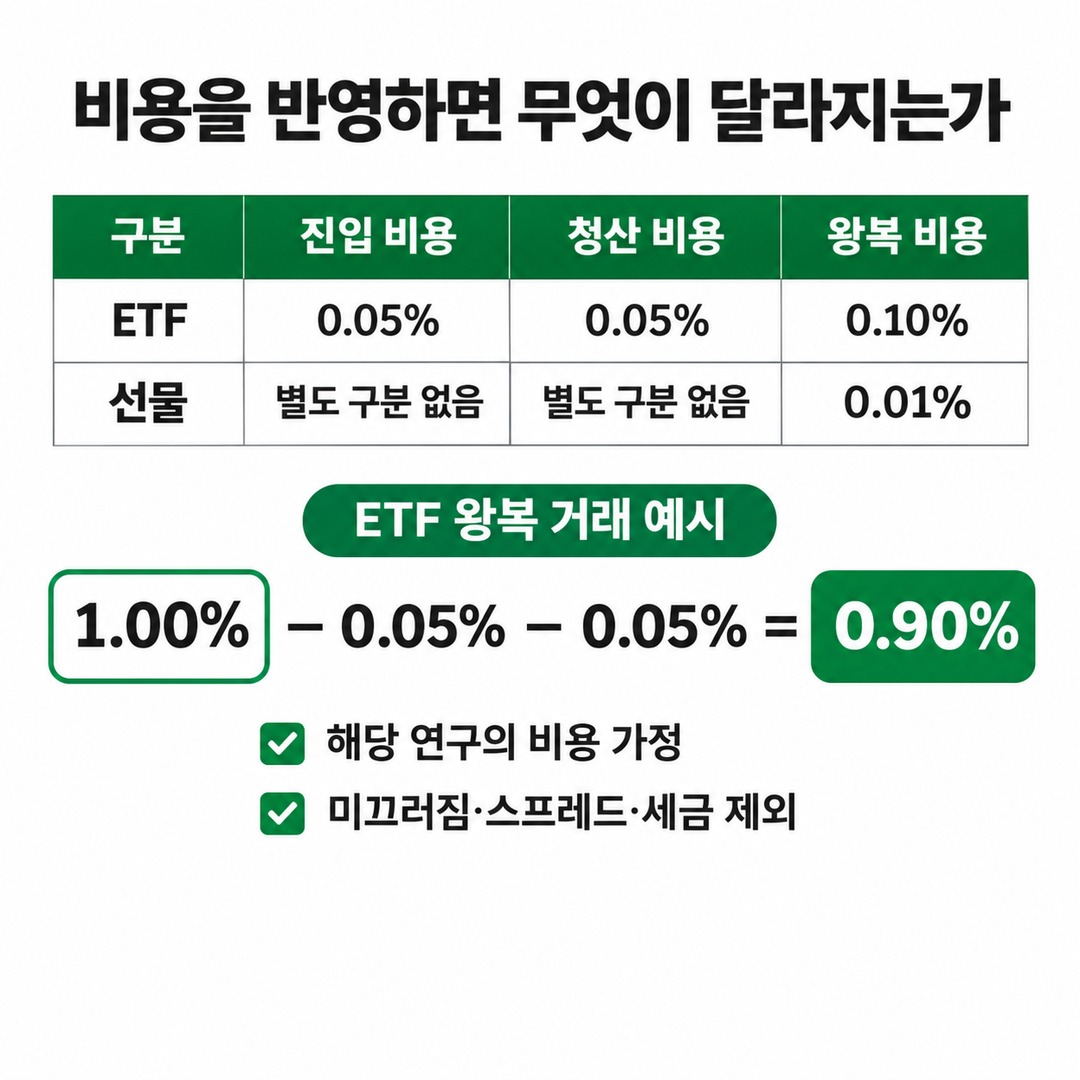
| Category | Entry cost | Exit cost | Round-trip cost |
|---|---|---|---|
| ETF | 0.05% | 0.05% | 0.10% |
| Futures | Not specified separately | Not specified separately | 0.01% |
These figures are the cost model used in that study, not fees that apply universally across all brokerages and exchanges.
Author’s calculation example: For a round-trip ETF trade with a return before costs of 1.00%, the calculation is as follows.
1.00%−0.05%−0.05%=0.90% In other words, the return after costs is 0.90%.
This is a simplified example applying costs as a share of the trade amount. It does not include other costs such as actual execution slippage, spreads, or taxes.
Costs are not the only issue. If there are too few entries or results vary depending on the exit method, returns after trading costs alone cannot establish whether a strategy is valid.
Actual Differences Found in the 2026 Backtest
EdgeLab tested daily data from 5 markets, including QQQ, SPY, GLD, Nasdaq 100 futures (NQ), and gold futures (GC).
The data period varied by market. Data through the end of 2018 were classified as in-sample, and data from 2019 onward as out-of-sample.
1. Test Applying the Original ADX-Rising Condition
Across 5 markets and 113.8 market-years, 19 setups occurred, leading to 11 actual trades.
For QQQ, there were only 6 trades in total. Of these, 2 were out-of-sample trades from 2019 onward.
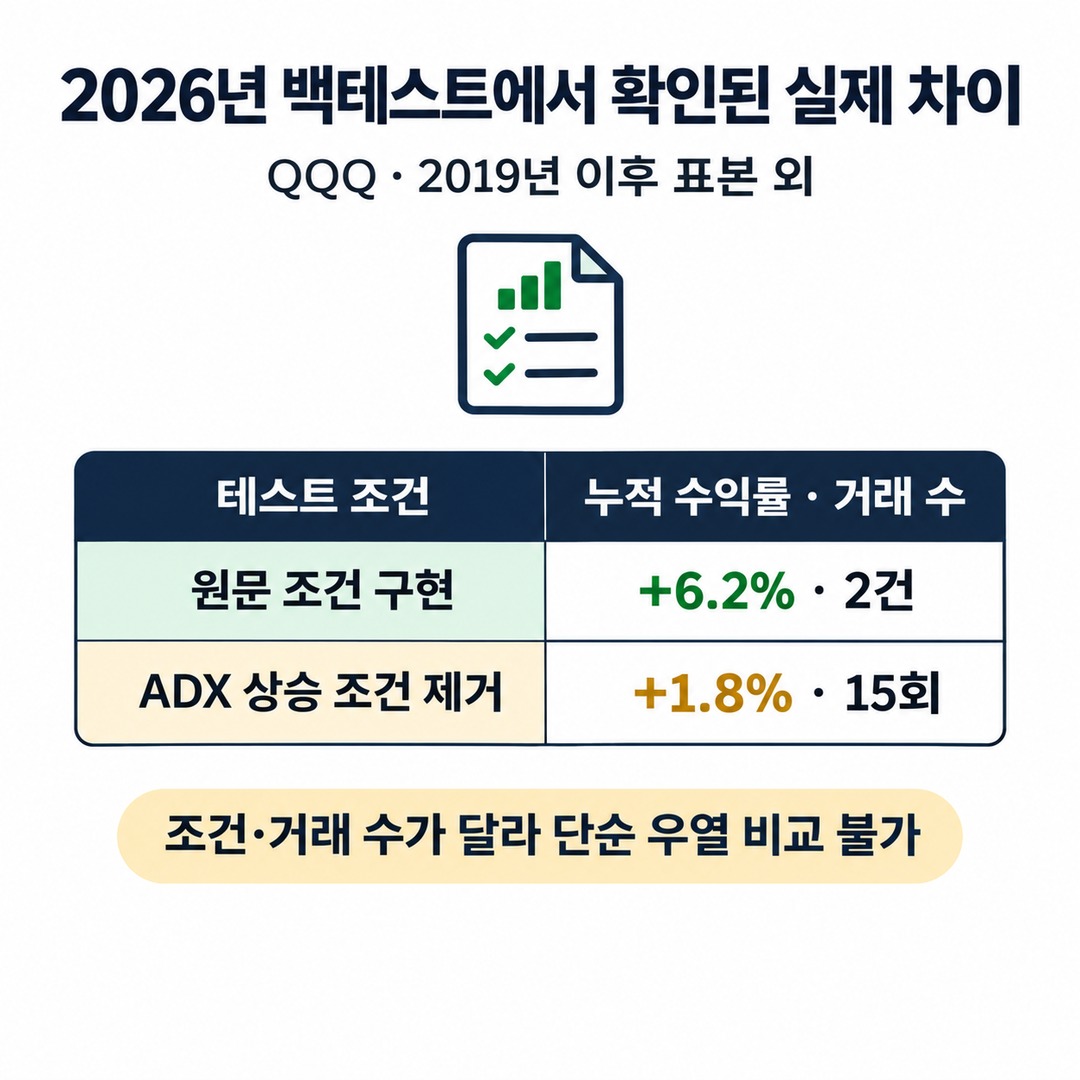
The out-of-sample return for QQQ was reported as +6.2%, but with only 2 trades, it cannot be considered stable performance.
2. Test Without the ADX-Rising Condition
In an additional experiment, EdgeLab removed only the requirement that ADX be rising. It says the other rules were kept unchanged.
QQQ · Out-of-sample results from 2019 onward
| Evaluation metric | ADX-rising condition removed |
|---|---|
| Number of trades | 15 |
| Win rate | 46.7% |
| Average return | +0.18% |
| Median return | -0.10% |
| Profit factor | 1.18 |
| Sharpe ratio | 0.07 |
| Cumulative return | +1.8% |
| Maximum drawdown | -10.3% |
QQQ out-of-sample cumulative return comparisonResults of EdgeLab’s published test from 2019 onward. Comparison of the original conditions with a variant that removes the ADX-rising condition.
Original-condition implementation: cumulative return 6.2%
ADX-rising condition removed: cumulative return 1.8%
The two results differ in both trade count and conditions, so they should not be interpreted as a straightforward comparison of which performed better.
In particular, the version without the ADX-rising condition had a QQQ in-sample Sharpe ratio of 0.44, which fell to 0.07 out-of-sample.
This means that, in this test, performance in the historical period did not hold up in the later period.
3. Did Changing the Trailing Stop Improve Results?
In addition to the original target price, EdgeLab also tested a trailing stop based on 2 times the 14-period ATR.
QQQ’s out-of-sample Sharpe ratio changed from 0.07 to 0.13, but it did not meet the study’s specified pass threshold.
There is another point to keep in mind.
A trailing stop based on 2 times ATR is not the same as the swing-low trailing stop in Raschke’s original rules. Results from an ATR-based trailing stop should not be treated as results for the original rules.
In addition, EdgeLab’s futures cost-sensitivity experiment found that removing or increasing costs did not substantially improve the overall results. In that study, the signal and sample issues appeared more important than costs.
These results can be found in EdgeLab’s 2026-10-20 validation report.
To Verify the Strategy, Record the Original Rules and Implementation Rules Separately
When translating the Holy Grail into automated trading or a backtest, the key is to avoid adding conditions that are absent from the original source and then calling the result the same strategy.
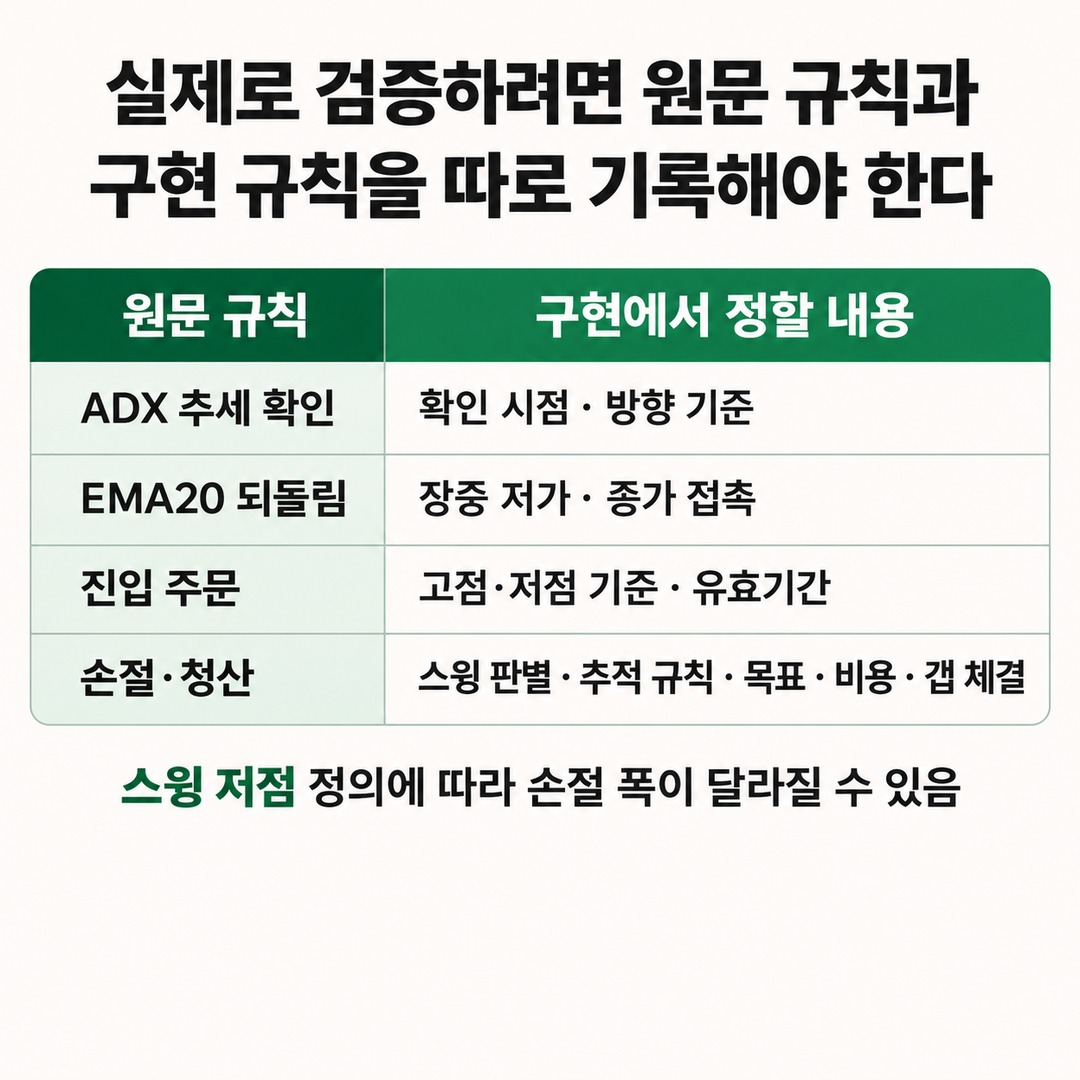
Each of the following items should be defined independently.
| Validation item | What must be specified |
|---|---|
| ADX | At what point to check whether it is above 30 and rising |
| Trend direction | Whether to use price structure or a directional indicator |
| EMA 20 | Whether contact means an intraday low touching the EMA or a closing price touching it |
| Entry | Order based on the previous bar’s high or low |
| Order validity | Whether the order is valid for only the next bar or is extended while the condition holds |
| Initial stop-loss | How to identify the actual swing low or high |
| Trailing stop | When a new swing forms and how the stop is adjusted |
| Profit-taking | Whether the target is the recent swing or a separate fixed target |
| Trading costs | Commissions, spreads, slippage, and taxes |
| Execution | Whether an opening price or the specified price is used when a gap occurs |
A swing low, in particular, is not a condition that automatically determines a single price.
For example, using the lowest price of the most recent 3 bars and using the actual swing low formed during the pullback are different rules.
Unless this distinction is settled first, stop distances and trade results can vary from one backtest to another.
Hypothetical Example: Calculating Position Size from the Entry and Stop Prices
The following is a hypothetical calculation, not a real market trade.
Entry price: USD 101
Swing low: USD 98
Risk per share: USD 3
Maximum permitted loss per trade: USD 300
The calculation is as follows.
Quantity = 300101 − 98 = 100 shares. If you buy 100 shares, the price risk down to the initial stop is USD 300.
However, actual losses may vary depending on gap-downs, execution slippage, commissions, and taxes. Therefore, USD 300 is the planned price risk, not a guaranteed maximum loss.
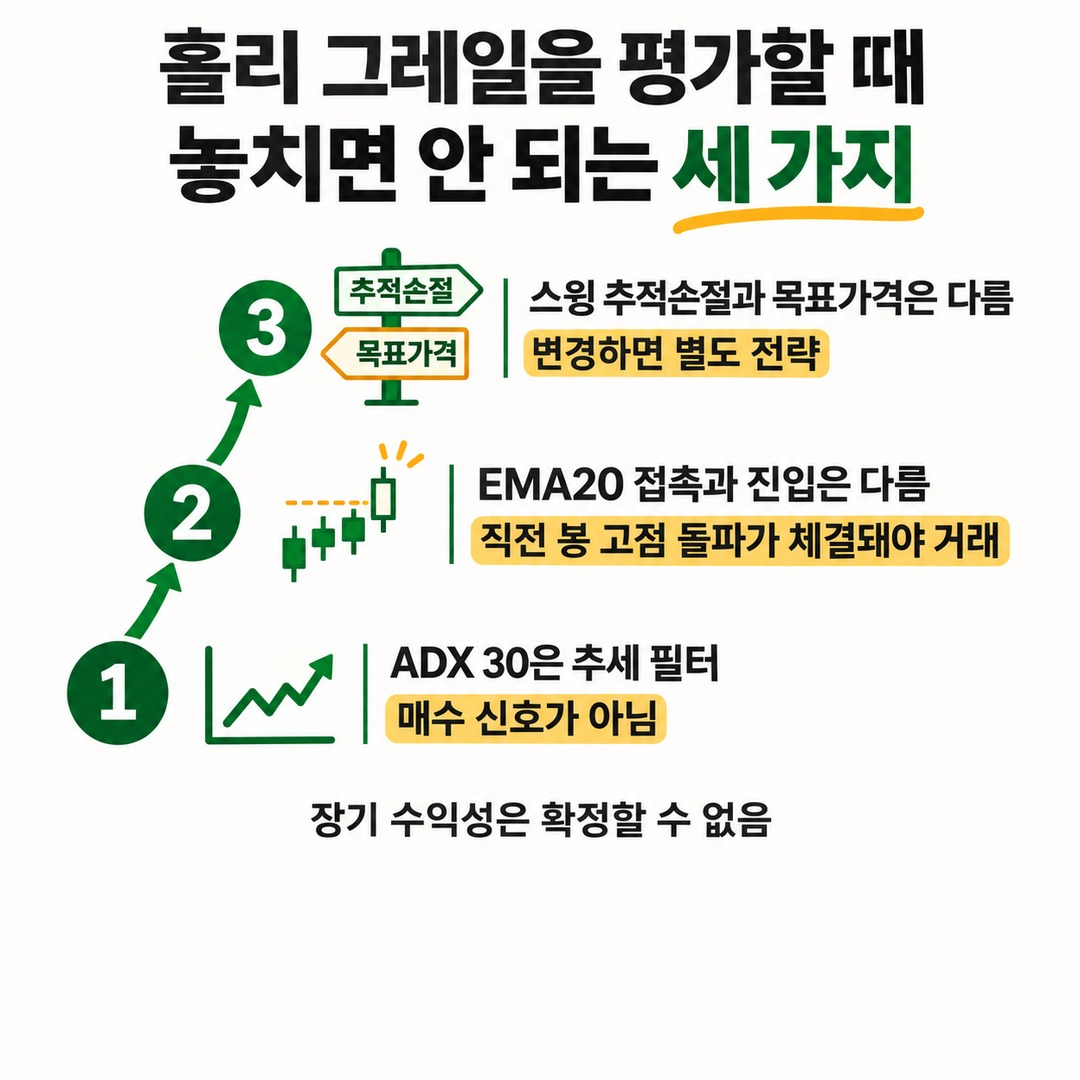
Three Things to Keep in Mind When Evaluating the Holy Grail
First, ADX 30 is not a buy signal. It is a filter for confirming a strong trend; entry is determined by price action after a pullback to the EMA 20.
Second, touching the EMA 20 is not the same as entering a trade. If the order to buy on a break above the previous bar’s high is not filled, it should not be counted as a buy trade.
Third, distinguish the original swing-based trailing stop from a fixed price target. If you add a target price or switch to an ATR trailing stop, record it as a separate strategy version.
The Holy Grail’s central idea is to confirm a strong trend, limit risk during a pullback, and then wait for the trend to resume. However, the published 2026-year validation results alone cannot establish the strategy’s long-term profitability.
Before deciding whether to apply it in practice, examine results by market and time frame, and assess execution costs separately.
※ This article is for informational purposes to help readers understand market trends and is not an investment recommendation for any specific security or asset. You are responsible for your own investment decisions.
This post contains Coupang Partners affiliate links. We may earn a commission from qualifying purchases.