

All 3 Major U.S. Stock Indexes Rise, S&P500 Hits Record High: Why Falling Employment Boosted Stocks
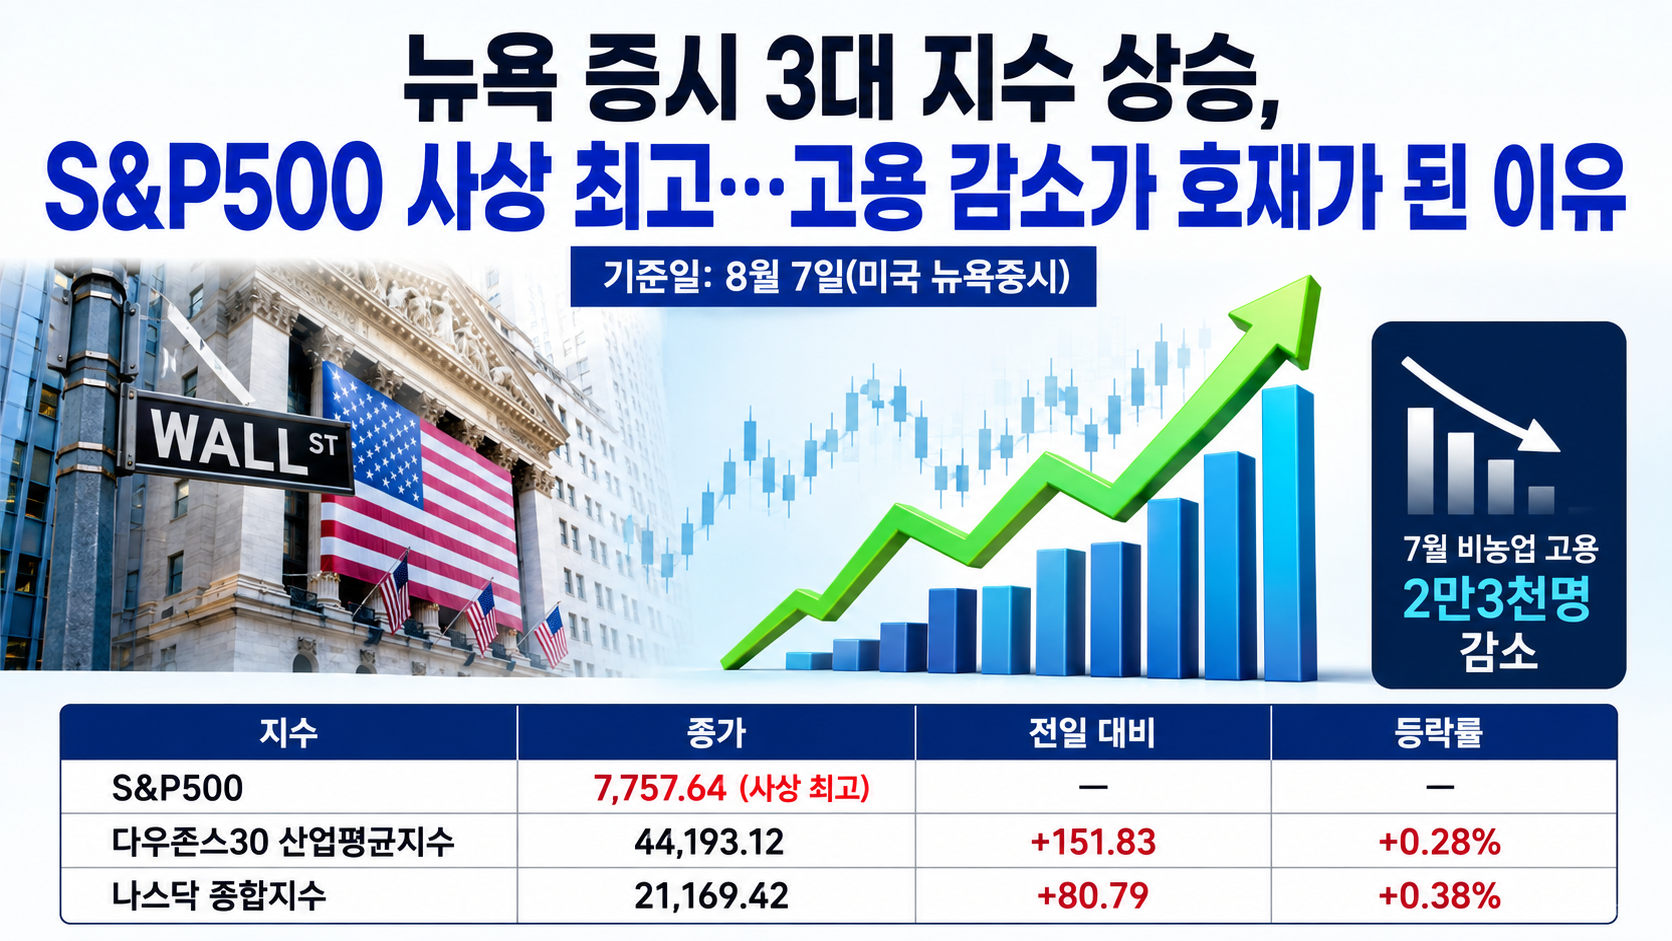
On August 7, all 3 major U.S. stock indexes rose in New York, with the S&P500 setting a new record closing high of 7,757.64. Although a decline of 23 thousand jobs in July nonfarm payrolls heightened concerns about an economic slowdown, investors reacted more strongly to the reduced likelihood of an immediate Federal Reserve interest rate hike.
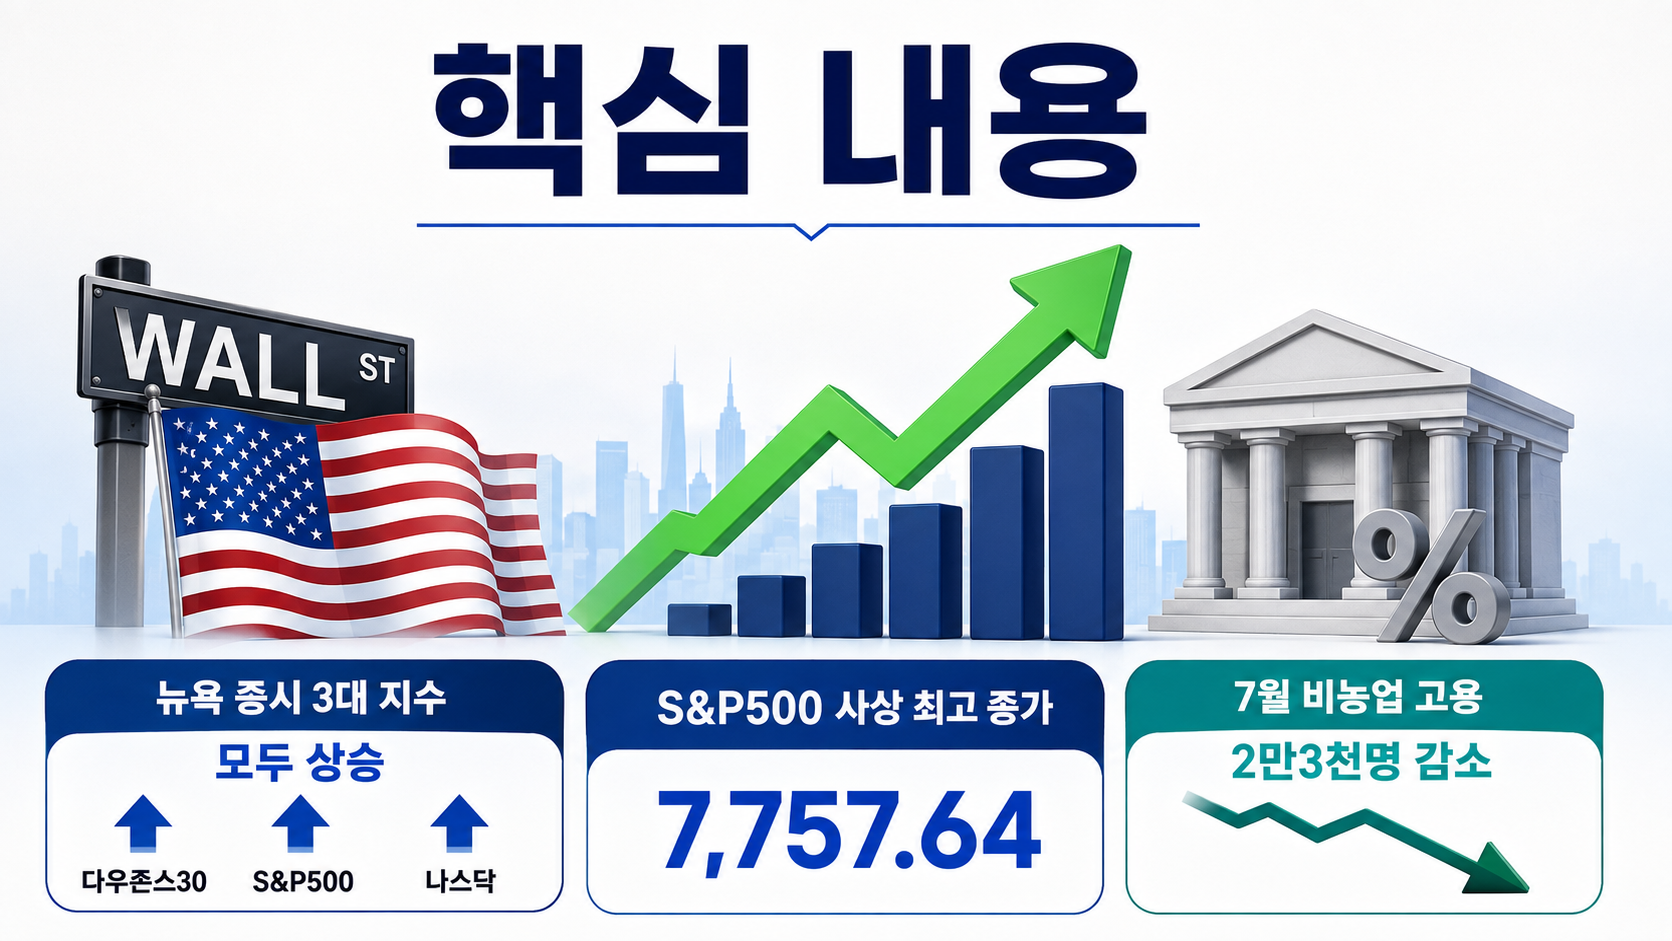
The Dow Jones 30 Industrial Average closed at 54,036.93, up 151.83 points, or 0.28%. The S&P500 finished at 7,757.64, gaining 47.68 points, or 0.62%, while the Nasdaq Composite rose 342.26 points, or 1.30%, to 26,690.62.
Why Did U.S. Stocks Rise Even as Employment Declined?
The key reason for the rally was not that deteriorating employment conditions were inherently good news, but that slowing job growth reduced pressure on the Federal Reserve to raise interest rates further. The Nasdaq, which has a large concentration of technology stocks sensitive to interest rate expectations, gained 1.30%, outperforming both the Dow and the S&P500. This performance was consistent with the market's interpretation of the employment report.
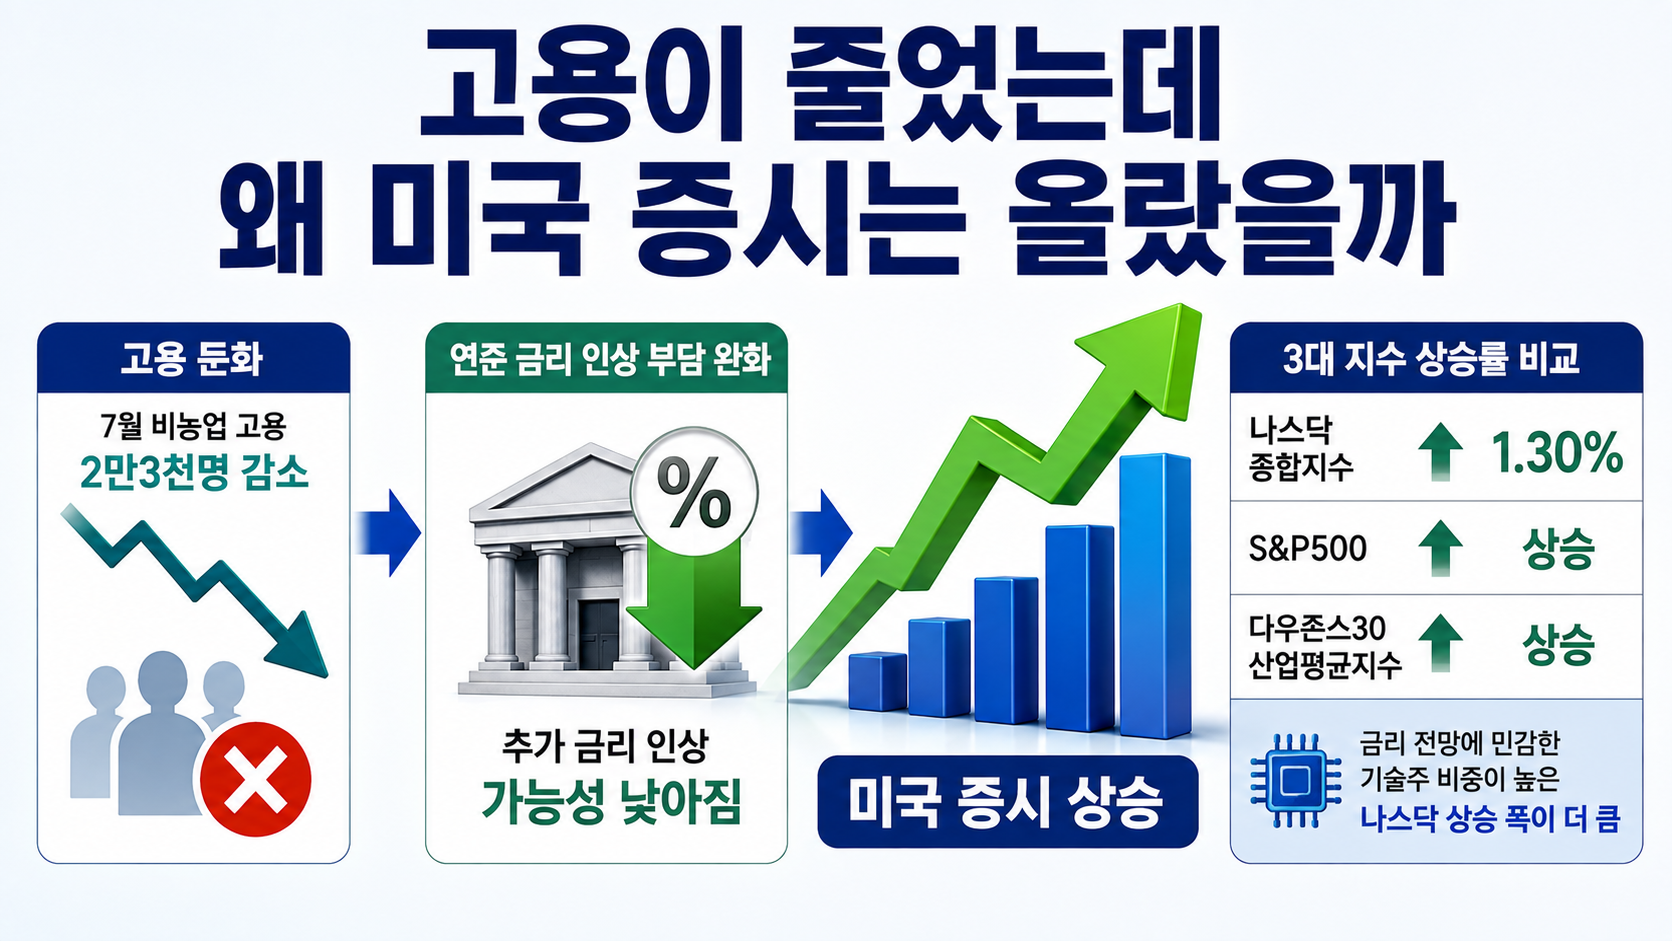
According to the U.S. Bureau of Labor Statistics, nonfarm payroll employment declined by 23 thousand jobs in July compared with the previous month. Markets had expected an increase of approximately 8 thousand jobs, meaning the actual result fell substantially short of expectations. The unemployment rate declined from 4.2% in June to 4.1% in July, but the labor force participation rate also fell from 61.5% to 61.4%.
Author's calculation: The difference between the market forecast of +80,000 jobs and the actual result of -23,000 jobs is:
-23,000 - 80,000 = -103,000 jobs.
In other words, the actual employment figure was 103 thousand jobs below expectations.
The Downward Revisions to the Previous Two Months Deserve Even More Attention
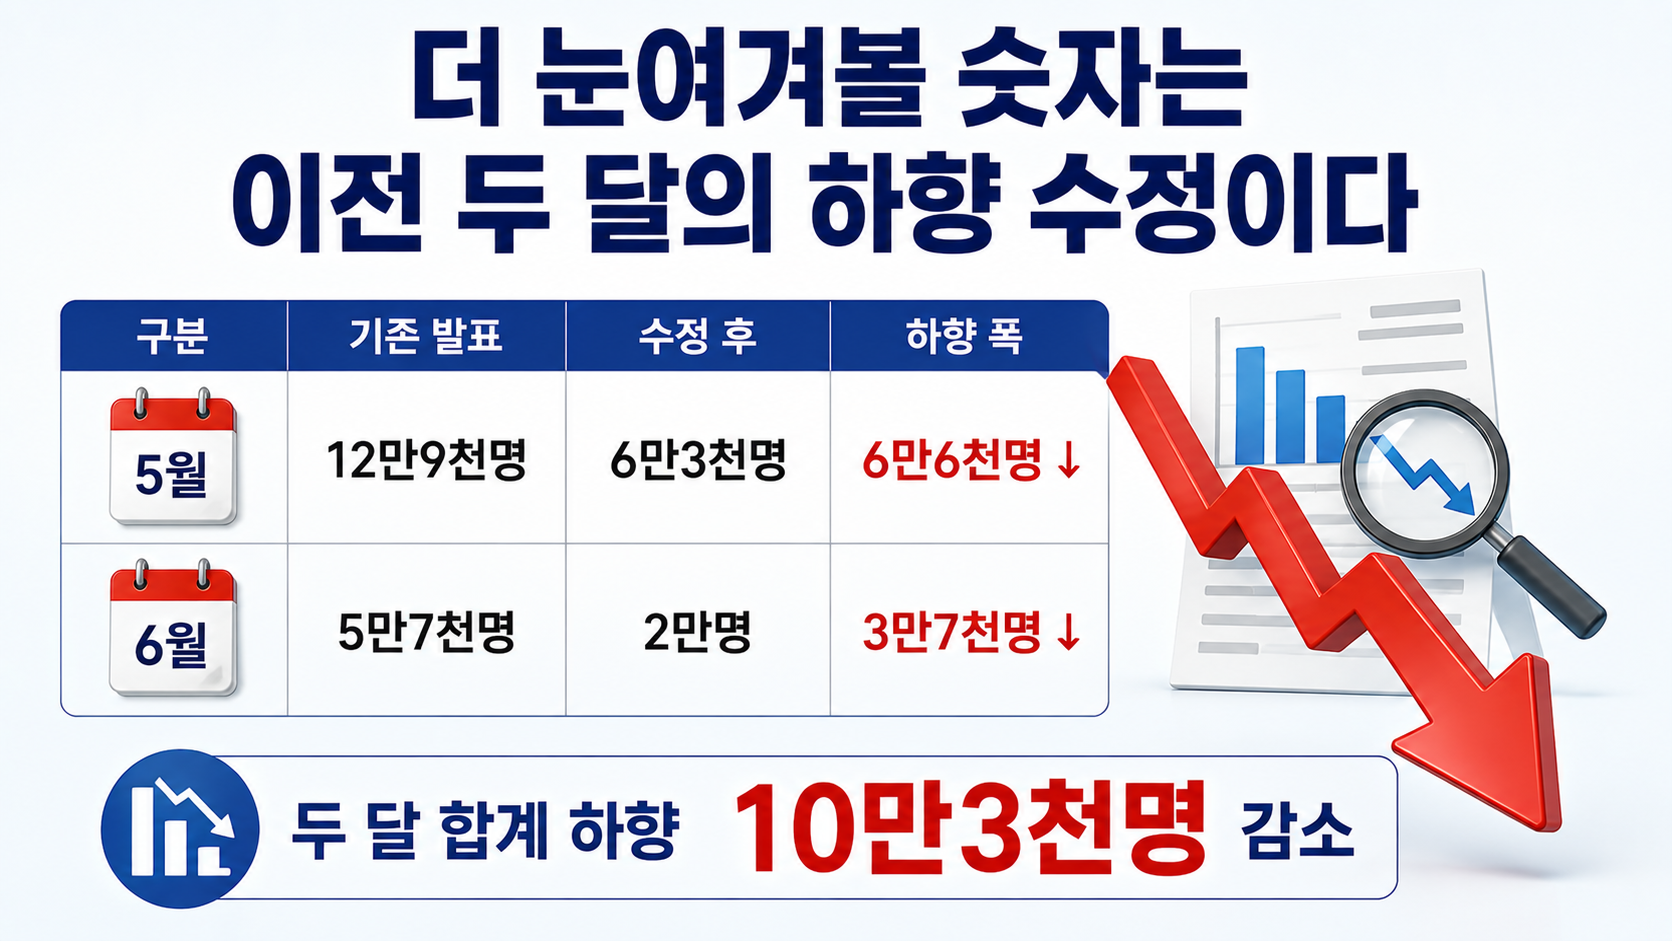
The weakness was not limited to the July figures. The U.S. Bureau of Labor Statistics revised nonfarm payroll gains for May downward from the previously reported 129 thousand jobs to 63 thousand. The figure for June was also reduced from 57 thousand to 2 thousand. Combined employment for the two months was 103 thousand jobs lower than previously reported.
It is important to distinguish between these figures.
The calculated shortfall of 103 thousand jobs relative to market expectations for July and the official downward revision totaling 103 thousand jobs for 5 and June are separate measures. Their numerical values happen to be identical, but they are based on different comparisons.
The evidence that slowing employment was not merely a one-month anomaly also changed market interest rate expectations. The market-implied probability of a rate hike at the next Federal Open Market Committee meeting fell from approximately 55% the previous day to around 44%. Compared with approximately 67% a week earlier, the probability had declined by 23% percentage points.
That Does Not Mean the Risk of an Interest Rate Hike Has Disappeared
At its July 29 meeting, the Federal Reserve maintained its target range for the federal funds rate at 3.50–3.75%. At the time, the Fed stated that inflation remained above its 2% target, while three committee members actually favored a 0.25%-percentage-point rate increase.
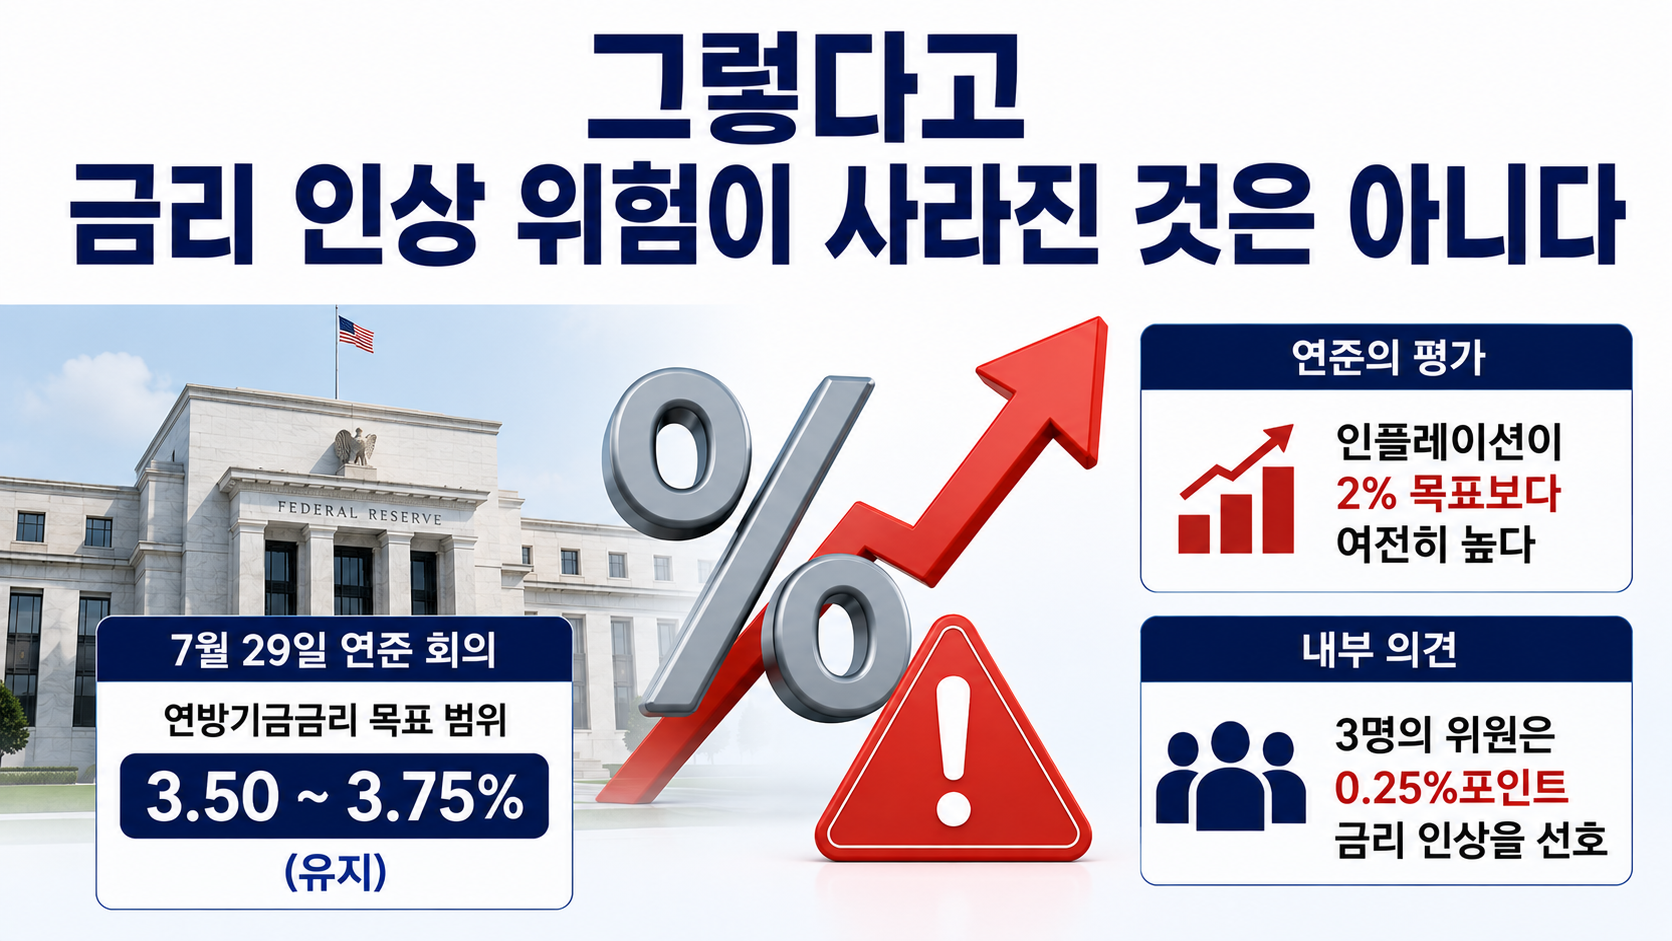
It would therefore be an overinterpretation to treat the latest stock market rally as confirmation that the rate-hiking cycle has definitively ended. Weaker employment can make it more difficult for the Fed to justify raising rates, but if inflation accelerates again, policymakers could face another difficult choice between controlling prices and supporting employment.
Following the release of the July employment report, the yield on 10-year U.S. Treasury securities fell to around 4.64%. Although this movement in interest rates was favorable for stocks, prolonged labor market weakness could eventually weigh on corporate revenue and earnings.
Weekly Gains Were Also Substantial
The rally was not confined to a single trading session. Over the week ending August 7, the S&P500 gained 3.58%, the Nasdaq advanced 5.19%, and the Dow rose 2.96%. All three indexes recorded their largest weekly percentage gains since mid-April.
Corporate earnings also supported stock prices. Among the 436 S&P500 companies that had reported earnings by the morning of August 7, 85.1% exceeded market profit expectations. In other words, easing interest rate pressures resulting from slower employment growth coincided with stronger-than-expected corporate earnings.
The Next Important Date to Watch Is August 12
Following the S&P500's record high, the nearest major market-moving indicator is the U.S. July Consumer Price Index (CPI). The report is scheduled for release at 8:30 a.m. U.S. Eastern Time on August 12. In South Korea, that corresponds to 9:30 p.m. on the same day.
Author's calculation: Applying the 13-hour time difference between U.S. Eastern Daylight Time and Korea Standard Time gives:
August 12 08:30 + 13 hours = August 12 21:30 Korea Standard Time.
Even with weaker employment, a higher-than-expected CPI reading could revive concerns about additional interest rate hikes. Conversely, if inflation also shows signs of stabilizing, it could strengthen the market's interpretation of the employment report as a signal of easing interest rate pressure.
The Federal Reserve's next regularly scheduled FOMC meeting is set for September 15–16. Inflation data and additional employment indicators released before that meeting will be important inputs into the September interest rate decision.
The next U.S. employment report is scheduled for release on September 4. As the latest report demonstrated, both headline employment figures and revisions to previous months can change substantially. For a more accurate assessment, investors should examine new job creation, the unemployment rate, labor force participation, and revisions to the previous two months rather than focusing solely on the headline number.
The S&P500's record high clearly reflects strong market momentum. However, the latest rally was driven less by an improvement in underlying economic strength than by the following sequence: weaker employment → reduced expectations of interest rate hikes → lower Treasury yields → easing pressure on stock valuations.
The next step is therefore to see whether the August 12 CPI report sends a signal in the same direction. Record highs and historical gains do not guarantee future returns, and U.S. stock prices may experience substantial volatility in response to inflation, interest rates, corporate earnings, and geopolitical developments.
※ This article is provided for informational purposes to help readers understand market developments. It does not constitute investment advice or a recommendation to buy any particular security or asset. Readers are responsible for their own final investment decisions and associated risks.