

5 Indicators to Use with RSI: Why Moving Averages and Trading Volume Come First
이 포스팅은 쿠팡 파트너스 활동의 일환으로, 이에 따른 일정액의 수수료를 제공받습니다.
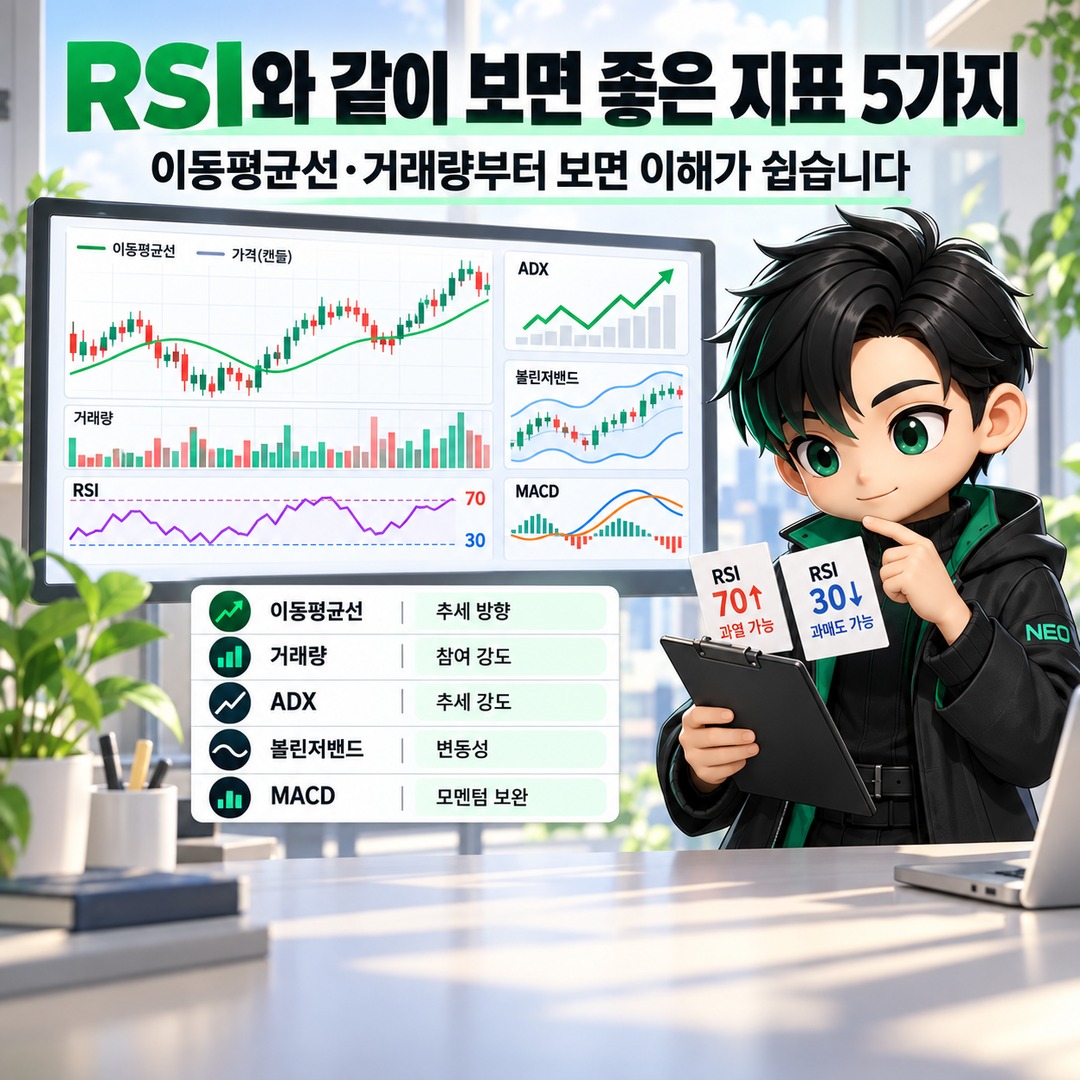
RSI is a momentum indicator that shows the speed and strength of price changes, so RSI alone cannot fully assess trend direction, trend strength, trading participation, and volatility. An easy approach is to start with moving averages and trading volume, then add ADX, Bollinger Bands, or MACD when necessary.

An RSI reading above 70 does not necessarily mean prices will immediately fall, just as a reading below 30 does not guarantee an immediate rebound. During strong trends, overbought or oversold conditions can persist longer than expected. That is why understanding current market conditions is more important than relying on a single number.
Indicators Used with RSI Should Serve Different Purposes
RSI compares recent price gains and losses to express price momentum numerically. It is generally interpreted within the 0~100 range, with readings of 70 or higher commonly considered overbought and readings of 30 or lower considered oversold.

The limitation is that RSI primarily provides information about momentum. A high RSI reading alone cannot tell you whether an uptrend has ended, whether rising prices are supported by trading volume, or whether volatility is increasing.
Rather than adding indicators indiscriminately, it is easier to interpret charts when each additional tool answers a different question.
| Complementary Indicator | Information It Adds to RSI | What to Check First |
|---|---|---|
| Moving averages | Trend direction | Whether the price is above or below the moving average |
| Trading volume | Participation behind price movements | Whether volume increased alongside the price change |
| ADX | Trend strength | Whether a trend is currently established |
| Bollinger Bands | Relative price position and volatility | Band width and the price's position within the bands |
| MACD | Changes in trend and momentum | The relationship between MACD, the signal line, and the 0 line |
Start with Moving Averages

If you add only one indicator to RSI, moving averages are a straightforward place to start. Moving averages smooth short-term fluctuations by averaging prices over a specified period, helping identify the broader direction of price movement.
For example, suppose RSI rises above 70.
If the price remains above a rising moving average, it is difficult to conclude that the uptrend has ended simply because RSI is at or above 70. Conversely, if the price falls below a major moving average and the moving average itself begins sloping downward, the same RSI reading should be interpreted in a different context.
South Korean stock charts commonly provide 5-day, 10-day, 20-day, 60-day, and 120-day moving averages, among others. However, there is no need to use every period simultaneously. Starting with a short-term and medium-term moving average suited to your trading horizon helps keep the chart manageable.
The key is to distinguish their roles: RSI shows how quickly prices have moved, while moving averages help identify the direction in which prices are moving.

Check Whether Trading Volume Supports RSI Signals
Even if RSI begins recovering from oversold territory or retreating from overbought territory, the amount of trading participation behind the actual price movement is a separate question.
Price movements of the same magnitude can be interpreted differently depending on whether they occur with unusually high or low trading volume. Comparing current volume with average volume also helps determine whether trading activity is above or below normal levels.
For example, if RSI rises back above 30 after falling below it, while the price rebounds and trading volume increases above its usual level, there is an additional piece of information to consider beyond the RSI change alone.
Conversely, if RSI recovers but trading volume during the price rebound remains weak, there is reason to examine subsequent price action rather than rushing to treat the movement as a definitive signal.
For beginners, a practical chart setup is therefore RSI + moving averages + trading volume, rather than adding several complicated oscillators.
Add ADX to Assess Whether a Trend Is Strong
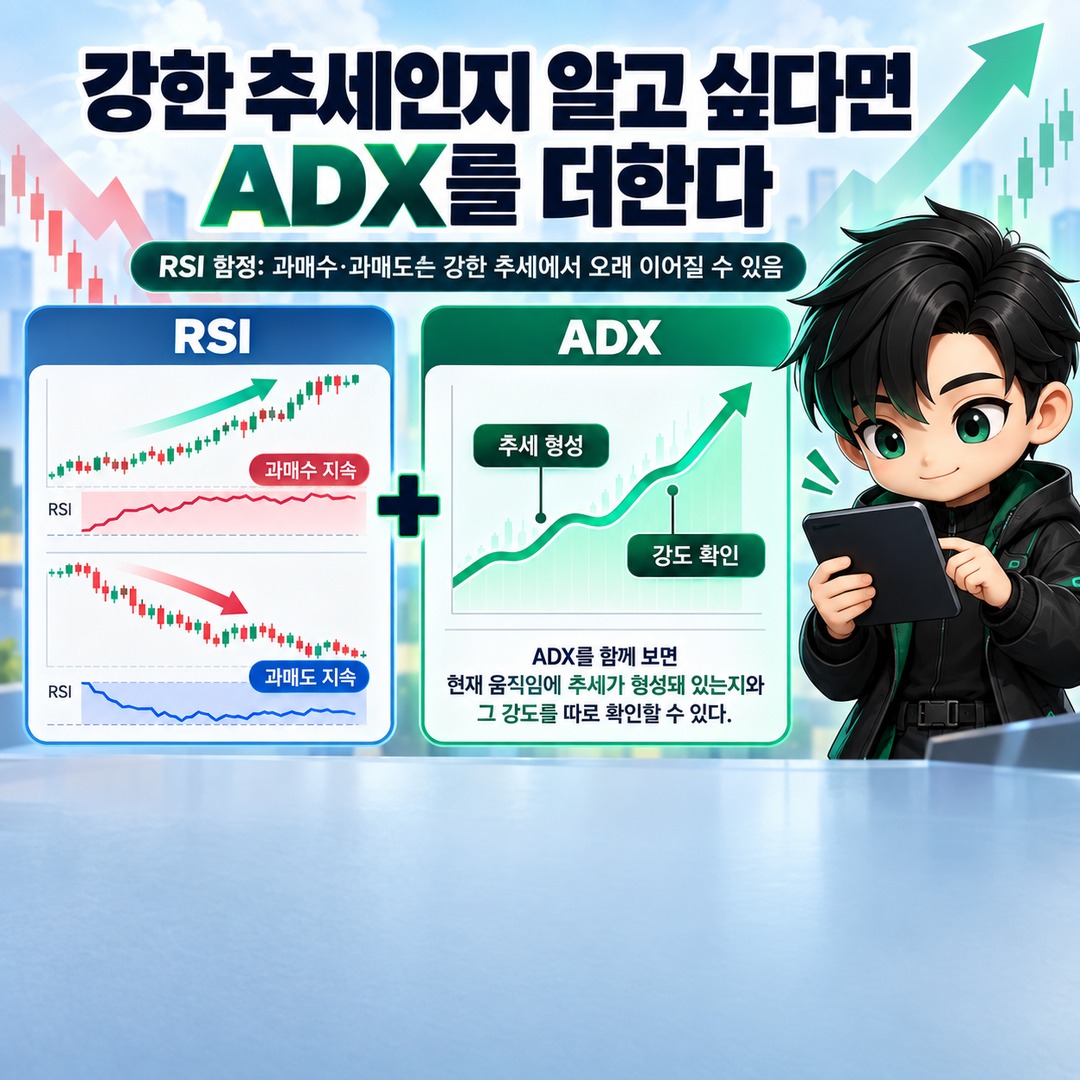
One of RSI's main pitfalls is that overbought or oversold conditions can persist during strong upward or downward trends. Adding ADX helps assess separately whether a trend is established and how strong it is.
ADX measures trend strength rather than direction. A rising ADX does not necessarily mean prices are rising; ADX can also increase during a strong downtrend.
Under a common interpretation, when ADX begins rising above 20, traders examine whether a trend is developing and use the price chart to distinguish between upward and downward trends.
Understanding this distinction helps reduce the mistake of automatically interpreting RSI readings of 70 or higher as sell signals.
For example, if an uptrend continues and ADX indicates that a trend is established while RSI enters overbought territory, the better approach is to look for actual signs of weakening momentum rather than immediately assuming a reversal simply because RSI is overbought.
Bollinger Bands Add Volatility Information to RSI
Bollinger Bands display upper and lower bands around a moving average to help assess a price's relative position and volatility. One widely used default configuration consists of a 20-period moving average with bands positioned 2 standard deviations above and below it.
When RSI and Bollinger Bands are used together, they answer different questions.
RSI shows the momentum of recent price movements, while Bollinger Bands indicate where the price stands within its recent range and how volatility is changing.
However, it is inappropriate to establish automatic rules to sell whenever the price touches the upper band or buy whenever it touches the lower band. During strong trends, prices may continue moving near one of the bands.
If the bands become narrower than usual, examine whether volatility has declined. Then use actual price movements and other confirming indicators to assess which direction prices subsequently take.
How Should MACD Be Interpreted Differently from RSI?
RSI and MACD are frequently used together. However, interpreting both in the same way may simply result in repeatedly checking similar signals.
MACD generally uses the difference between a short-term exponential moving average and a long-term exponential moving average. A standard example calculates the difference between the 12-period EMA and the 26-period EMA, with a signal line consisting of a 9-period EMA of MACD.
While RSI focuses on identifying overbought or oversold conditions and momentum, MACD is easier to understand as a tool for assessing changes in trends and momentum through the relationship between two moving averages.
You can compare crossovers between the MACD line and signal line, as well as whether MACD is above or below the 0 line, alongside the current RSI reading.
However, during sideways markets, the MACD and signal lines may cross repeatedly. Rather than treating RSI and MACD alone as automatic buy-and-sell rules, it is important to examine the prevailing price trend and trading volume as well.
Establishing a Checking Sequence Is Easier Than Adding More Indicators
You do not need to display all five indicators on your chart when using RSI. Establishing a checking sequence makes the process much simpler.

1. Check direction using price and moving averages.
First, determine whether the current price structure indicates an uptrend, downtrend, or sideways market.
2. Check momentum using RSI.
Rather than looking only at 70 and 30, examine whether RSI is rising or falling and whether the price and RSI are moving in different directions.
3. Confirm price movements using trading volume.
Compare whether breakouts or rebounds are accompanied by higher-than-usual trading activity.
If trend strength remains unclear after these checks, you can add ADX. If you want to understand volatility conditions, add Bollinger Bands. If you want another perspective on changes in trends and momentum, consider MACD.
In other words, rather than using every indicator simultaneously, add one indicator that answers a question you have not yet resolved. This keeps the chart less complicated.
Three Common Misconceptions About RSI
The first misconception is assuming prices will immediately fall whenever RSI reaches 70 or higher. During strong uptrends, RSI can remain elevated for an extended period.
The second misconception is interpreting RSI readings of 30 or lower as proof that an asset has become sufficiently cheap. RSI does not evaluate a company's fair value or determine whether a price is fundamentally undervalued. It is a technical indicator that calculates momentum based on recent price changes.
The third misconception is believing that adding more similar indicators automatically improves accuracy. Rather than continuously adding RSI, MACD, and other oscillators, it is easier to distinguish each indicator's purpose by examining different types of information, such as trend direction, trading volume, trend strength, and volatility.
A Simple Setup for Beginners
When starting out, it is better to keep the chart simple.
Price chart + moving averages + trading volume + RSI
Use this setup first to examine price direction, momentum, and trading participation.
If you have difficulty determining whether a trend is strong, add ADX. If you want to examine expanding or contracting volatility, add Bollinger Bands. MACD can be useful when you want another way to assess the relationship between moving averages and changes in momentum.
No combination of indicators guarantees future prices or returns. Technical indicators are reference tools that use historical prices and trading volume to describe current market conditions. Actual investment decisions should also consider company information, regulatory disclosures, market conditions, liquidity, and your personal risk tolerance.
※ This article is provided for informational purposes to help readers understand market trends and does not constitute an investment recommendation for any particular stock or asset. Final investment decisions and responsibility rest with the individual investor.
Related Articles
Gold Rebounds to 4,347 Dollars: Two Things to Check Now in September 16
이 포스팅은 쿠팡 파트너스 활동의 일환으로, 이에 따른 일정액의 수수료를 제공받습니다.