

How to Read the FOMC Dot Plot: The Number That Could Move Bitcoin More Than the Rate Announcement
이 포스팅은 쿠팡 파트너스 활동의 일환으로, 이에 따른 일정액의 수수료를 제공받습니다.

When assessing Bitcoin at the September FOMC meeting, checking only whether interest rates were raised or held unchanged tells only half the story. The September 2026 15~16 meeting will also release new economic projections (SEP) and a dot plot, meaning the Fed's expectations for where interest rates may go next could be just as important as its current decision.
In particular, if Bitcoin suddenly moves in the opposite direction even though the actual rate decision matches market expectations, investors should also examine the dot plot's year-end rate projections, inflation forecasts, and Powell's press conference.
What Does the FOMC Dot Plot Actually Show?
The dot plot is a chart showing the future federal funds rate levels that individual Federal Open Market Committee (FOMC) participants consider appropriate.
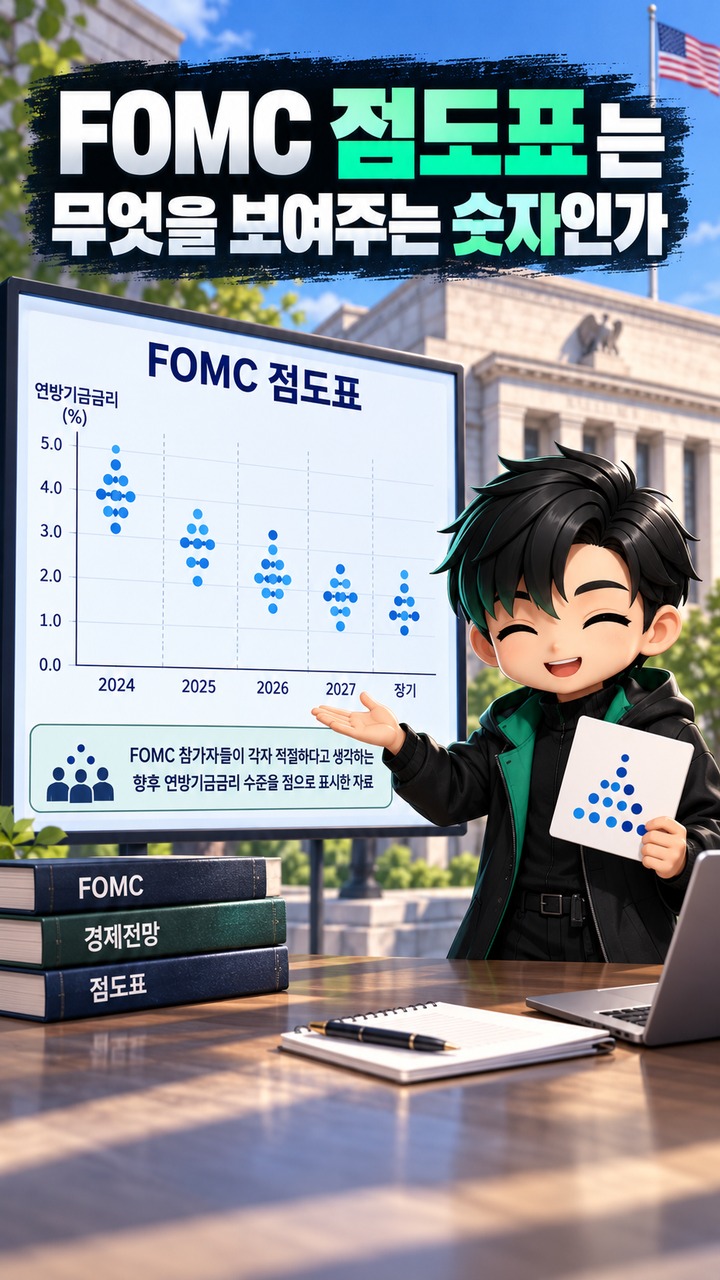
The important point is that each dot represents neither a finalized interest rate plan nor a voting result. According to the Fed's official explanation, each participant submits economic projections based on prevailing economic conditions and the monetary policy path they personally consider appropriate.
Therefore, a common interpretation in news reports such as
"The Fed has decided that next year's interest rate will be ○%"
is inaccurate.
A more accurate interpretation is that the chart shows
"where the median of current Fed participants' interest rate path projections stands."
Research published by the Federal Reserve Bank of New York in September 2026 also found that markets incorporate dot plot information when adjusting expectations for future interest rates, but do so partially and gradually rather than treating the projections as binding commitments.
At the September Meeting, the '2026 Year-End Dot' Matters More Than the Current Rate
At the July 2026 FOMC meeting, the Fed maintained the federal funds rate target range at 3.50~3.75%. The vote was 9 to 3, with the three dissenters favoring a 0.25%-point increase.
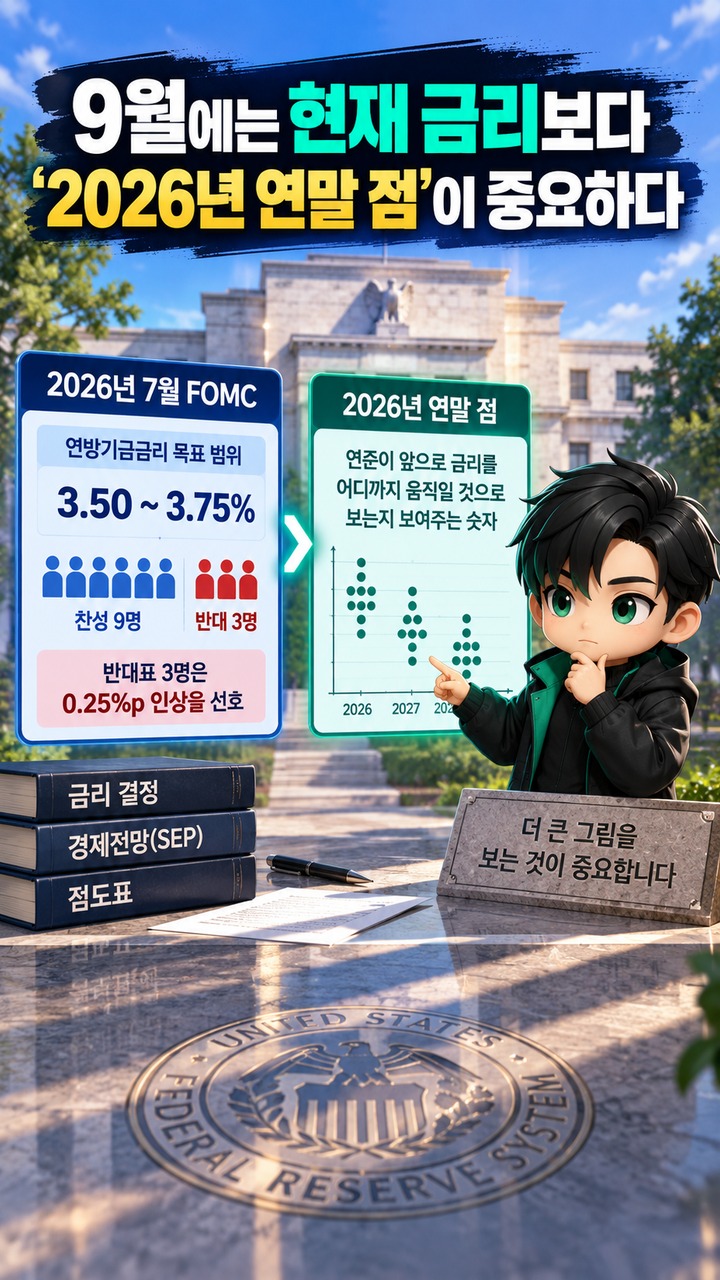
In the earlier June economic projections, the median federal funds rate projection for the end of 2026 was 3.8%.
| Category | June 2026 Projection |
|---|---|
| Median interest rate at the end of 2026 | 3.8% |
| End of 2027 | 3.6% |
| End of 2028 | 3.4% |
| Longer-run interest rate | 3.1% |
According to official Fed materials, the median year-end 2026 rate projection was 3.4% in March, but increased to 3.8% in June. Over the same period, the median 2026 PCE inflation projection rose from 2.7% to 3.6%, while the core PCE projection increased from 2.7% to 3.3%.
This means Fed participants had begun expecting higher inflation and a higher interest rate path than they had several months earlier.
That change is precisely what investors should compare first in the September dot plot.
June 3.8% → What percentage in September?
What matters is whether this number remains unchanged, rises further, or falls again.
Why Can Bitcoin Move in the Opposite Direction From the Actual Rate Decision?
FOMC announcements can trigger larger price movements when their contents differ from what markets expected.

For example, if markets have already fully anticipated a rate hold, the announcement itself may contain little new information. However, if the dot plot shows that future rate projections have risen more than expected, markets may interpret this as a sign that monetary tightening could last longer.
Conversely, even if the Fed raises its current policy rate, financial markets may not follow a simple 'rate hike = price decline' formula if there is a strong signal that further increases will be limited.
When analyzing Bitcoin, it is more useful to examine the following sequence together.
Changes in the dot plot → Movements in US Treasury yields and the dollar → Changes in risk appetite → Bitcoin's reaction
This relationship is not a rule that always produces movements in the same direction. Other factors can influence prices simultaneously, including spot Bitcoin ETF fund flows, leveraged position liquidations, and geopolitical risks.
Therefore, rather than predicting Bitcoin's direction based solely on a single line in a rate announcement, investors should distinguish what new information the market is pricing in.
What You Miss When You Look Only at the Dot Plot Median
The median is the most frequently cited figure in discussions of the dot plot. However, focusing only on the median can obscure differences of opinion within the Fed.
In the June projections, 18 participants submitted economic forecasts. The Fed publishes not only the median but also the central tendency and full range of projections.
Three steps are enough to review the chart.
First, check whether the median year-end 2026 rate projection has changed from 3.8% in June.
An increase in the median may signal an overall shift toward participants considering higher interest rates appropriate than before.
Second, examine how widely the dots are dispersed.
Even with the same median, tightly clustered dots suggest participants hold relatively similar views. A wider vertical spread indicates greater disagreement about the future monetary policy path.
Third, examine the 2027 and longer-run interest rate projections as well.
Markets do not price in only the single September decision. They also incorporate expectations for the interest rate path across multiple future meetings.
Inflation Projections You Must Examine Alongside the Dot Plot
At the September meeting, it is important to compare the entire set of economic projections rather than looking at the interest rate dots in isolation.
In the Fed's June projections, the median 2026 PCE inflation forecast was 3.6%, while the core PCE forecast was 3.3%. Both were above the Fed's longer-run inflation target of 2%.
The key points to check in the September projections are straightforward.
Determine whether interest rate projections are falling alongside inflation forecasts, or whether rate projections are rising again while inflation forecasts remain elevated.
In particular, Fed officials had not reached a completely unified position ahead of the September meeting. In a September 3 speech, Fed Governor Christopher Waller said he could support maintaining the current interest rate if disinflation continued, but that a rate increase at the September meeting could be appropriate if the improvement proved temporary.
Ultimately, the September FOMC meeting should be assessed by considering the rate decision + new inflation projections + new dot plot together.
Follow This Order Immediately After the September 16 Announcement
When checking FOMC results from South Korea, there is no need to examine every number at once.
First, determine whether the policy rate was raised, held unchanged, or lowered.
Next, compare the median year-end 2026 interest rate projection with 3.8% from June.
Third, check the direction of revisions to the 2027 interest rate projection and the 2026 PCE and core PCE inflation forecasts.
Finally, listen to the Fed chair's press conference to identify the conditions associated with possible additional policy adjustments.
According to the Fed's schedule, the September 15~16 meeting will include the release of economic projections. The policy statement and projection materials are scheduled for 16 at 2 p.m. US Eastern Time, followed by the press conference at 2:30 p.m.
If there is one number to remember this time, the reference value is 3.8%.
When the new September dot plot is released, do not stop at asking whether rates were raised or held unchanged. Instead, first check which direction the year-end 2026 interest rate projection has moved from 3.8% in June.
Bitcoin's short-term price reaction is not determined by the dot plot alone. Interest rate expectations, Treasury yields, the dollar, ETF fund flows, and derivatives positions can all exert influence simultaneously. The dot plot is therefore better used as a reference for understanding how markets are reassessing monetary policy, rather than as a direct buy or sell signal.
※ This article is provided for informational purposes to help readers understand market developments and does not constitute an investment recommendation for any specific security or asset. Final investment decisions and responsibility rest with the individual investor.
Related Articles
Bitcoin and the FOMC September 16 Rate Decision: Three Key Variables BTC Investors Should Watch
Trump's Pressure for Rate Cuts: The Fed Is Watching 3.7% Inflation and the September Meeting
이 포스팅은 쿠팡 파트너스 활동의 일환으로, 이에 따른 일정액의 수수료를 제공받습니다.