

A Sharp Drop After a CAN SLIM Follow-Through Day: When Is the Uptrend Invalidated?
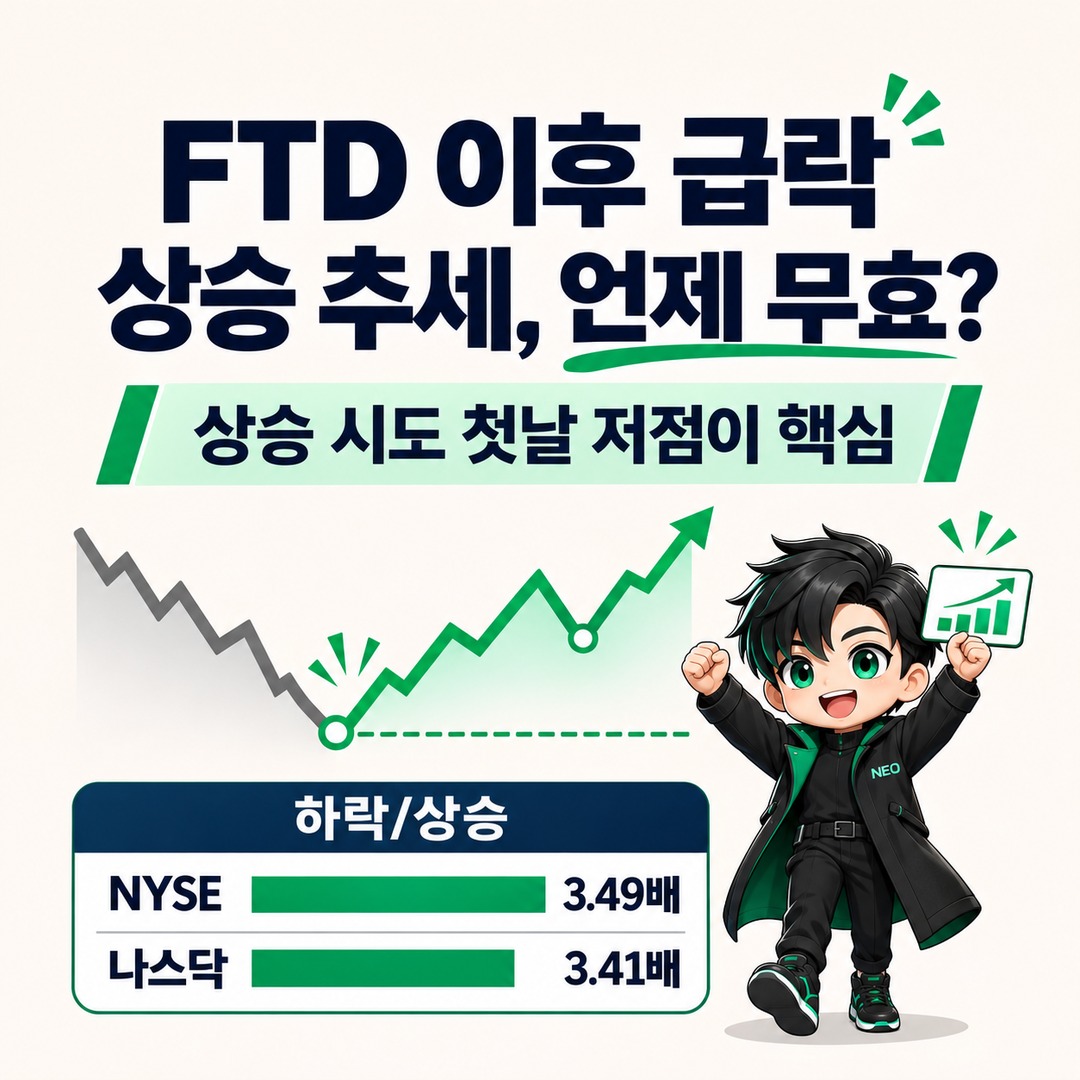
A Follow-Through Day (FTD) in CAN SLIM does not confirm that an uptrend is in place. If the index then plunges, you need to check market breadth, subsequent selling accompanied by volume (Distribution Days), and the low of the rally attempt that was underway on the Follow-Through Day. A Follow-Through Day is a signal that confirms the potential for a rally, not a guarantee that the trend will continue.
In particular, distinguish between the fact that an index fell sharply in a single day and the judgment that the uptrend has been invalidated. The size of the price drop matters, but so do trading volume, how widely declines are spreading across stocks, the action of market leaders, and whether the low of the existing rally attempt holds.
How to Assess a Sharp Drop After a Follow-Through Day
A Follow-Through Day and the invalidation of a trend are judgments made at different stages.
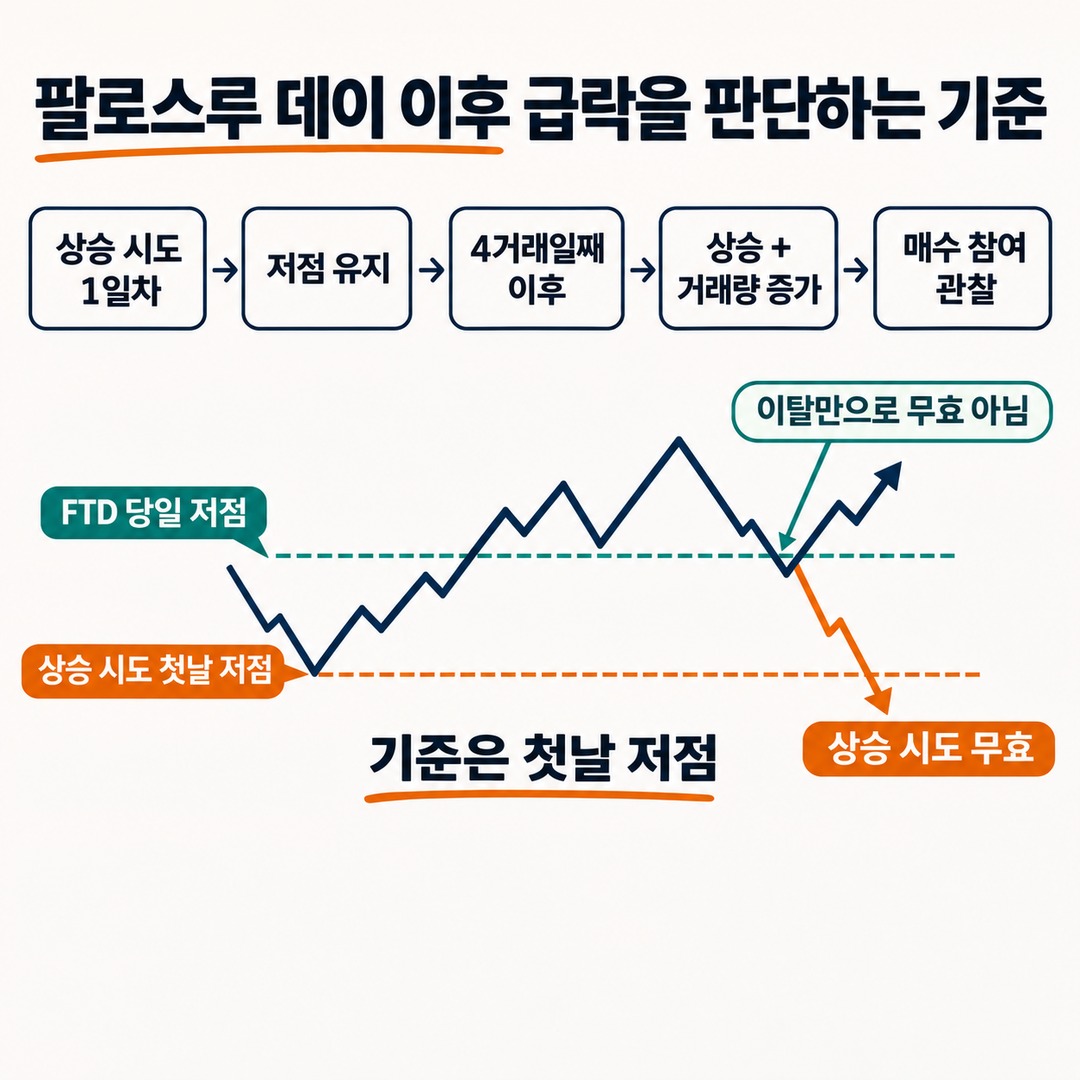
In William O’Neil’s CAN SLIM market analysis, a Follow-Through Day is a signal used to assess whether a rally attempt that began after a decline can develop into an actual uptrend.
The general process is as follows.
1. A major index stops falling and records the first day of a rally attempt (Rally Day 1).
2. Trading days then pass while the rally attempt’s low holds.
3. On or after the 4 trading day, a major index posts a meaningful gain.
4. If trading volume on that up day is higher than on the previous trading day, it is considered a Follow-Through Day.
5. Afterward, watch to see whether buying participation actually expands across the index and the broader market.
The most important condition here is the low of the first day of the rally attempt. The low on the Follow-Through Day and the low on the first day of the rally attempt are different prices, so do not confuse them.
The fact that the index briefly fell below the low on the Follow-Through Day does not automatically invalidate the existing rally attempt. Conversely, if the low on the first day of the rally attempt does not hold, the established rebound attempt is considered invalidated, and the general rule is to wait for a new rally attempt.
The gain threshold for a Follow-Through Day can vary depending on market conditions and the IBD criteria being applied. Therefore, a single specific percentage gain should not be treated as an absolute rule that applies in every period.
The Imbalance That Also Appeared in the November 2026 Market After a Follow-Through Day
2026-11-11, the U.S. Nasdaq Composite Index rose 1.6% on the 4 day of its rally attempt, accompanied by higher trading volume. Investor's Business Daily identified this as a Follow-Through Day and raised its recommended market exposure to 20~40%.
However, subsequent market action showed why the confirmation signal alone was not enough to feel reassured.
On November 12, IBD's market indicators showed that advancing stocks on the New York Stock Exchange and Nasdaq were far fewer than declining stocks. On November 13, the Nasdaq fell 0.9% again.
This example shows that a Follow-Through Day and broader buying participation across the market do not necessarily occur at the same time.
Changes That Actually Followed November 11
| Date | Confirmed movement | Caution when interpreting it |
|---|---|---|
| November 11 | Nasdaq +1.6%, with increased trading volume | Follow-Through Day occurred |
| November 12 | S&P 500 -0.4% | Selling pressure accompanied by higher trading volume |
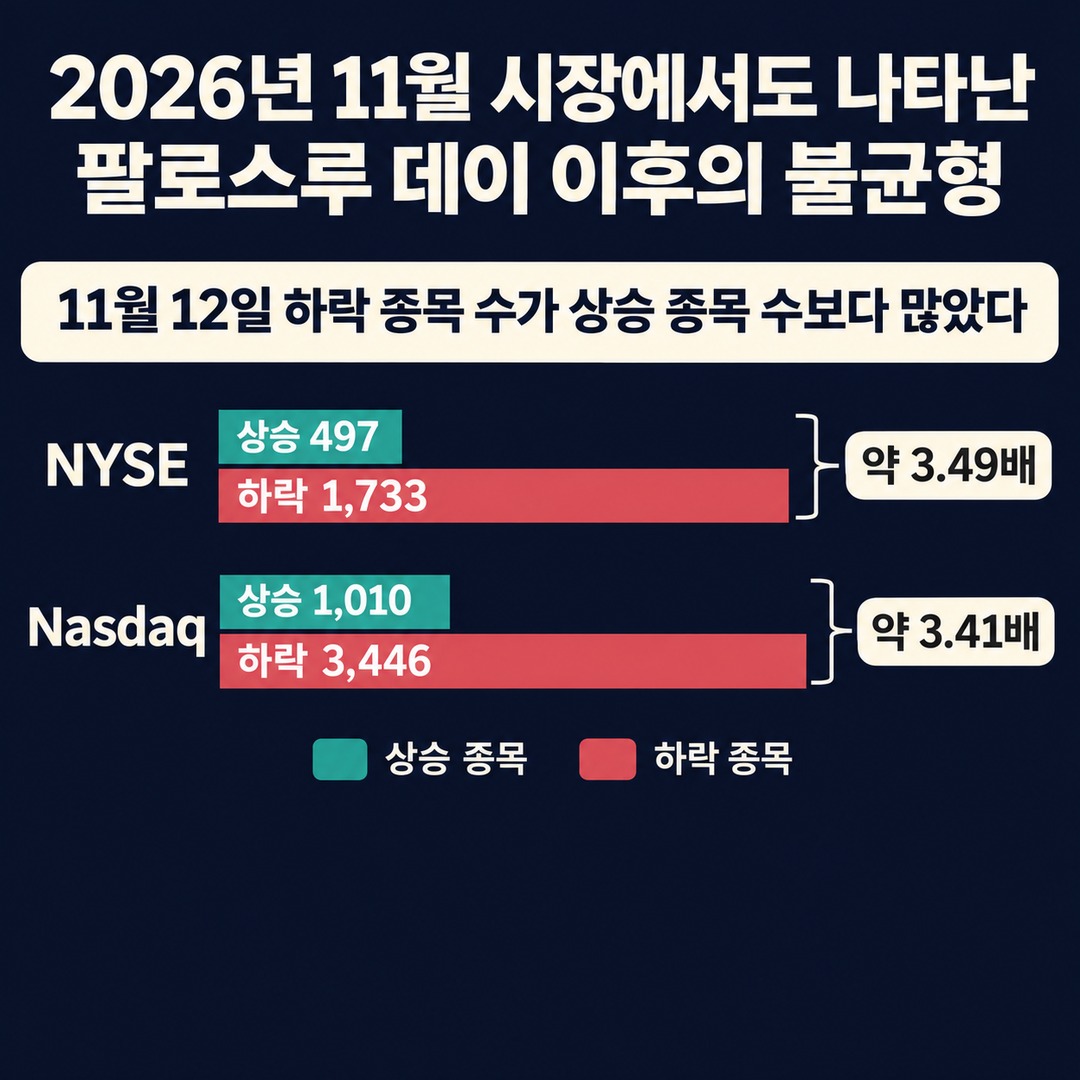
| November 12 | NYSE: 1,733 declining stocks, 497 advancing stocks | Weak market breadth |
| November 12 | Nasdaq: 3,446 declining stocks, 1,010 advancing stocks | Declining stocks outnumbered advancing stocks |
| November 13 | Nasdaq -0.9%, S&P 500 -0.4% | Weakness returned after the rally |
At the November 13 close, the Nasdaq stood at 25,136.27, while the S&P 500 stood at 7,561.67. On a weekly basis, however, the Nasdaq rose 2.3%, while the S&P 500 rose 2.5%. This is a case where the daily decline and weekly gains should be considered together. This can be confirmed using AP's November 13 U.S. market closing data and IBD's analysis of the Follow-Through Day.
What does a numerical calculation of market breadth reveal?
Market breadth shows how many individual stocks are actually participating in an index's rise.
Using IBD's General Market Indicators data for November 12, let's compare advancing and declining stocks.
Author's calculation · 2026-11-12 closing data
| Market | Advancing stocks | Declining stocks | Decliners/advancers ratio |
|---|---|---|---|
| NYSE | 497 | 1,733 | About 3.49 times |
| Nasdaq | 1,010 | 3,446 | About 3.41 times |
The calculations are as follows.
NYSE: 1,733 ÷ 497 = about 3.49
Nasdaq: 3,446 ÷ 1,010 = about 3.41
In both markets, declining stocks outnumbered advancing stocks by approximately 3.4~3.5 times.
This shows that participation in the market's gains was weak that trading day. Even if the index fell only about 0.4%, the movements of individual stocks may have weakened much more broadly.
However, this single day's market breadth is not enough to conclude that the medium-term uptrend has ended.
The data is available in IBD's official General Market Indicators for 2026-11-12.
How should subsequent selling signals be distinguished?
After a Follow-Through Day, check whether selling pressure is recurring rather than looking only at a simple decline. One key concept used in CAN SLIM is the Distribution Day.
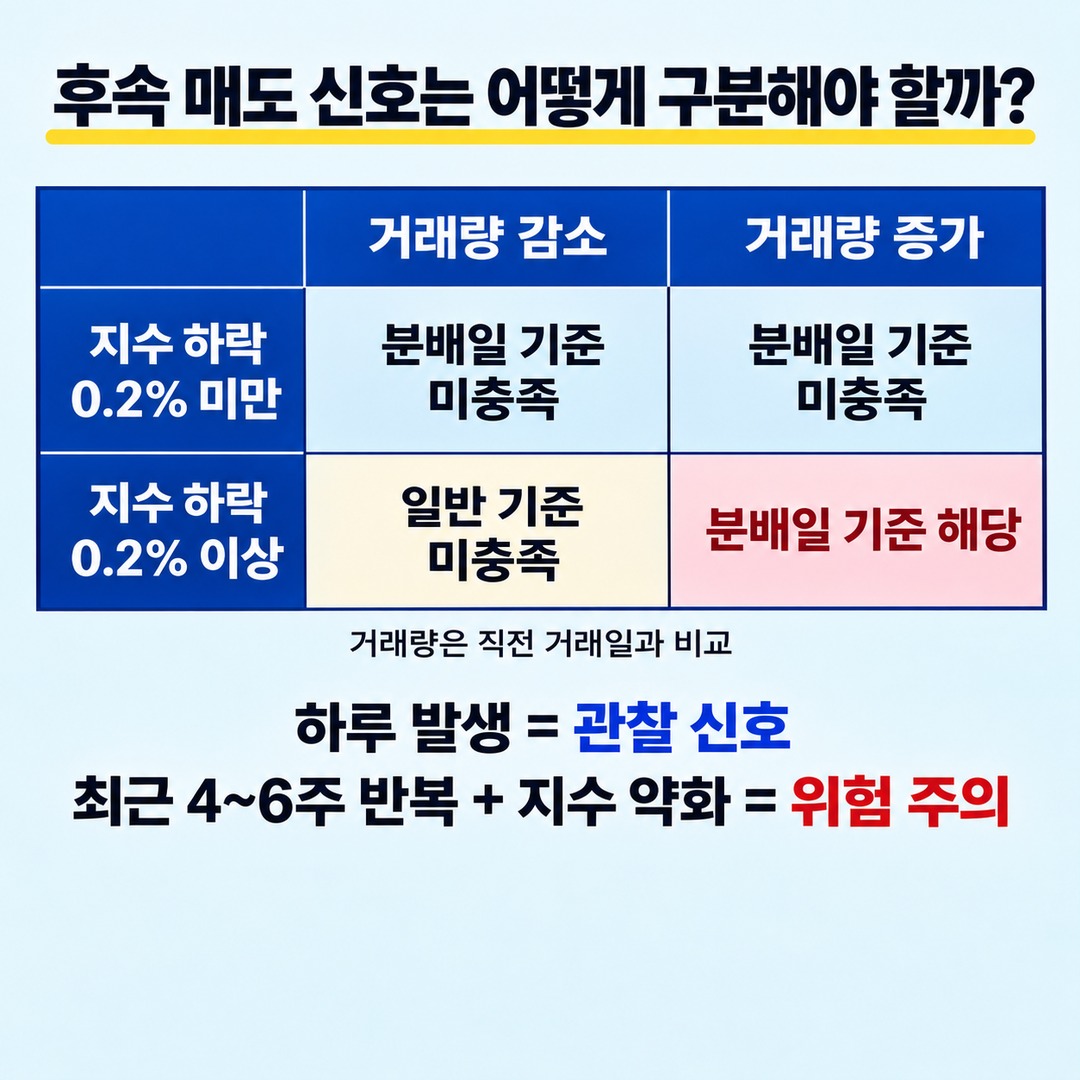
A Distribution Day generally means a day when a major index falls by at least 0.2% from the previous trading day and trading volume increases compared with the previous trading day.
It is important to note that volume is compared with the previous trading day's volume, not with average volume.
1. When a Distribution Day occurs
A single Distribution Day is an observed signal that selling pressure has emerged.
By itself, it does not mean the uptrend has ended.
In particular, distinguish between the following:
If the index falls but trading volume declines, it does not meet the usual criteria for a Distribution Day.
If the index falls and trading volume increases, it may qualify as a Distribution Day.
If the decline is steep and trading volume also rises sharply, the selling pressure warrants closer attention.
2. When Distribution Days recur over a short period
Rather than viewing each Distribution Day in isolation, it is important to consider how concentrated they are within a given period.
For example, if Distribution Days recur over the recent 4~6 weeks and the index's price action also weakens, you should consider risks beyond a routine correction.
However, the occurrence of 4 or 5 Distribution Days does not automatically mean that a market top has formed.
Distribution Days should be counted separately for each exchange and index. A decline on the same date confirmed in several indexes should not be counted multiple times for a single index.
3. The Follow-Through Day low and the rally attempt's first-day low
These two price levels are particularly important for trading decisions.
| Price level | What to check |
|---|---|
| Rally attempt's first-day low | Whether the existing rally attempt remains valid |
| Follow-Through Day low | Price support after the Follow-Through Day |
| 21-day moving average | Short-term trend and whether it is recovering |
| 50-day moving average | Technical condition of the medium-term trend |
The 21-day and 50-day moving averages are supplementary tools for assessing the trend. A single break below a moving average does not automatically invalidate a rally attempt.
Conversely, holding above the first-day low does not mean that all risks have disappeared.
Structural invalidation in price and an increase in selling pressure should be tracked as distinct signals.
Market breadth can weaken before the index does

Looking only at advancing and declining stocks when assessing market breadth can cause you to miss important information.
It is useful to consider the following four factors together.
1. The ratio of advancing to declining stocks
Check whether advancing stocks outnumber declining stocks.
Even if the index rises, if declining stocks outnumber advancing stocks, consider the possibility that a small number of large-cap stocks are lifting the index.
2. The share of stocks above the 50-day moving average
Check whether the proportion of stocks above the 50-day moving average is increasing.
If the index is making higher highs while the share of stocks above the 50-day moving average keeps shrinking, consider whether participation in the market's advance is weakening.
3. The number of stocks hitting new highs and new lows
Watch the difference between stocks hitting 52-week highs and those hitting new lows.
In a healthy advance, check whether stocks are hitting new highs across multiple sectors, not just whether the index is rising.
Conversely, if the index rebounds while the number of stocks hitting new lows continues to rise, question whether the advance is broad enough.
4. Participation from sectors and leading stocks
In CAN SLIM, leading stocks matter as much as the indexes.
If only a few large-cap semiconductor or AI-related stocks are rising while the number of strong stocks in other sectors is shrinking, it is difficult to interpret that as a broad market advance.
It is useful to compare the following:
Is the number of strong sectors increasing?
Are new market leaders emerging?
Are breakout stocks holding their buy points?
Are established leaders finding support at the 21-day and 50-day moving averages?
Are more stocks giving back their gains soon after breaking out?
Market breadth is a tool for assessing the range of market participation, not a single indicator.
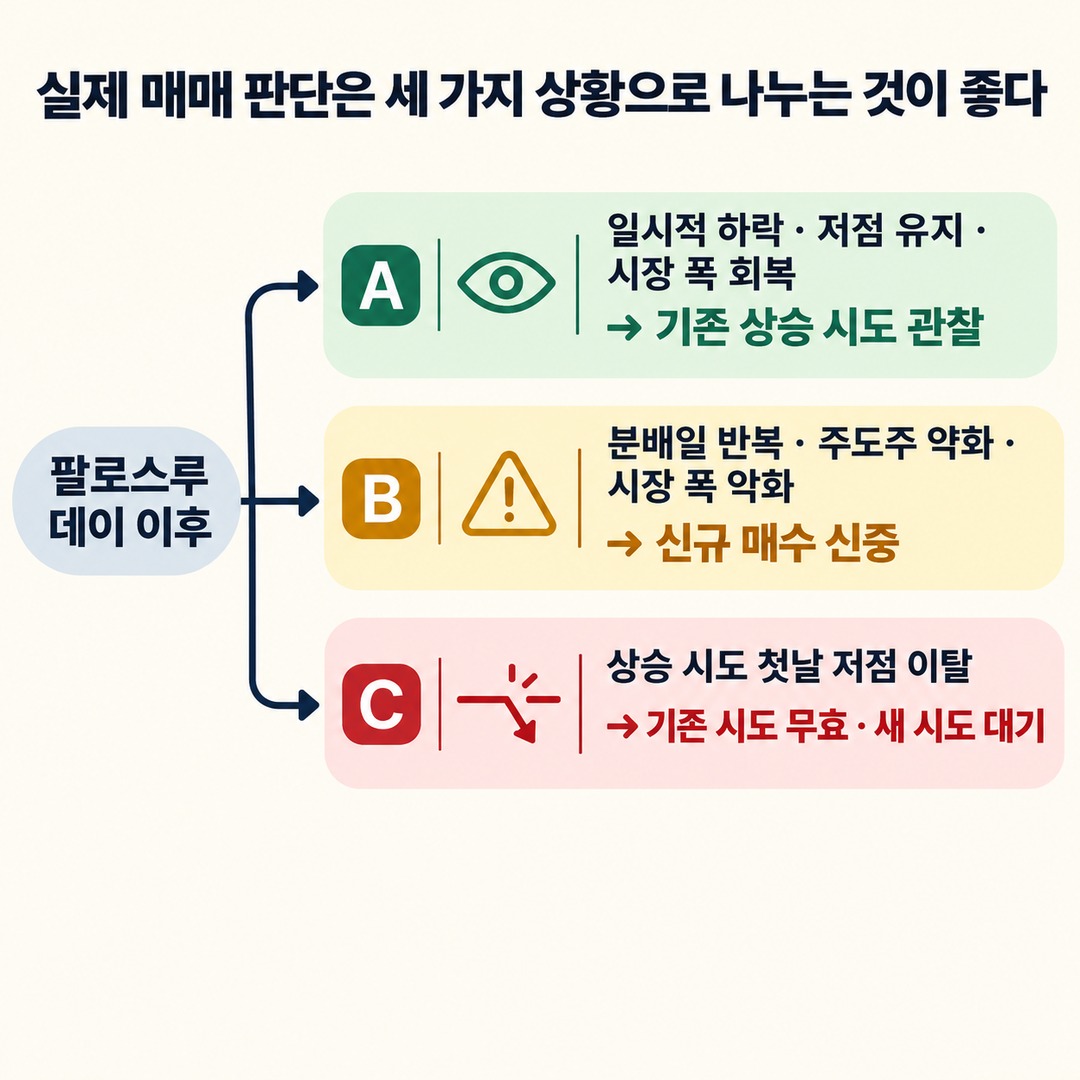
Trading decisions are best divided into three scenarios
Classifying conditions after a Follow-Through Day as follows can help you avoid overreacting to a sharp drop or, conversely, ignoring the risk.
| Scenario | Market conditions | How to assess it |
|---|---|---|
| A | Temporary pullback, rally attempt low holds, market breadth recovers | Monitor the existing rally attempt |
| B | Distribution Days recur, leading stocks weaken, market breadth deteriorates | Be cautious about new purchases |
| C | The rally attempt's first-day low is breached | Invalidate the existing rally attempt and wait for a new attempt |
Scenarios B and C are different.
In B, the uptrend may still hold, but the risk is increasing. In C, a key price condition for the existing rally attempt has been broken.
Therefore, do not classify the situation as C just because several Distribution Days have occurred, or as A just because the low has held.
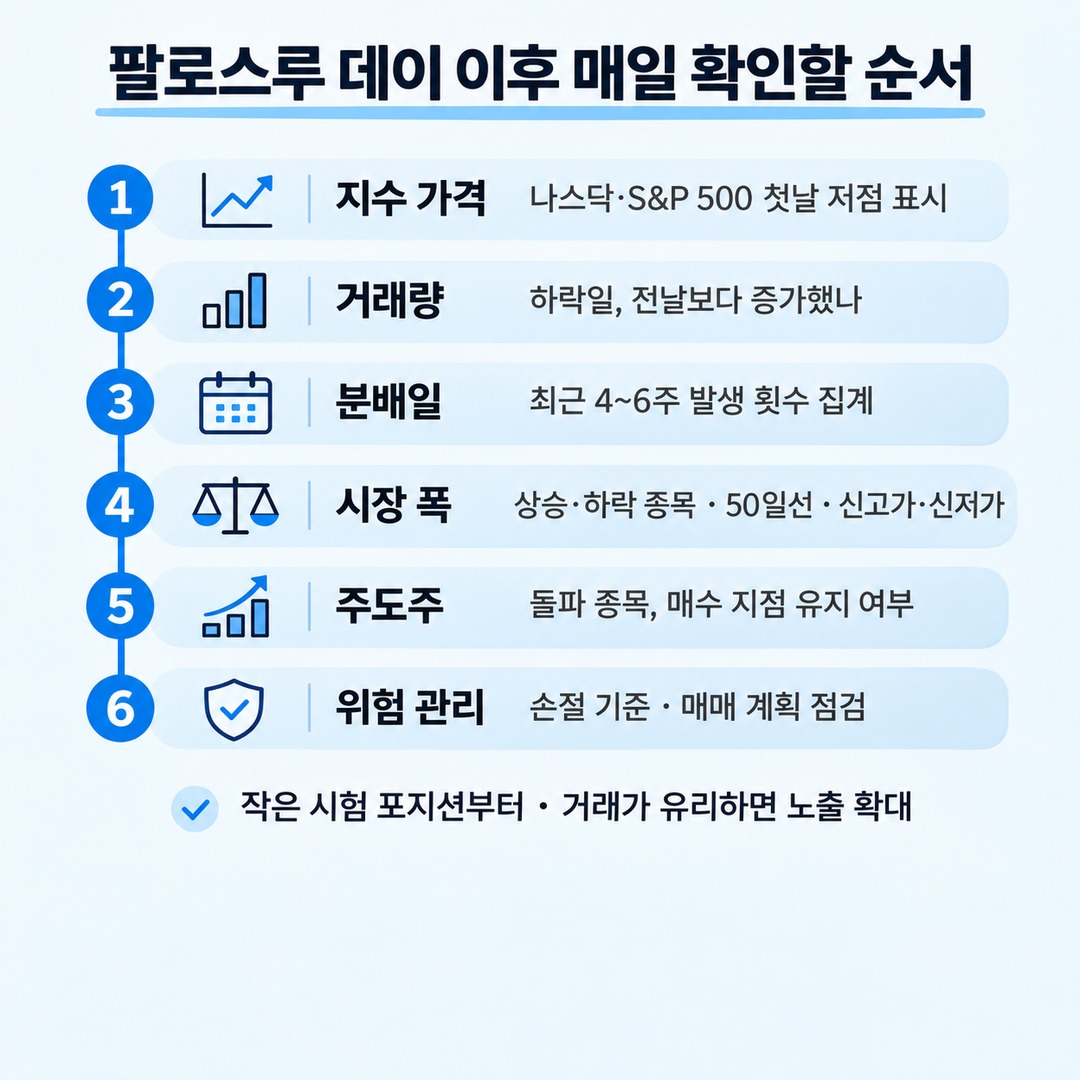
What to check each day after a Follow-Through Day
When reviewing an actual chart, check the following in order.

1. Index prices: Mark the rally attempt's first-day low for the Nasdaq and S&P 500.
2. Volume: Check whether volume on down days increased from the previous day.
3. Distribution Days: Count how many Distribution Days occurred in each of the recent 4~6 weeks.
4. Market breadth: Check the number of advancing and declining stocks, the share of stocks above the 50-day moving average, and new highs and new lows.
5. Leading stocks: Check whether breakout stocks are holding their buy points.
6. Risk management: Review the stop-loss levels for your holdings and your existing trading plan.
In its 2024 MarketSurge Stock Guide, IBD introduced a 5-stage portfolio exposure system in place of the previous 3-stage market direction system. It explained that even after a Follow-Through Day, investors could start with small test positions rather than moving all their cash into stocks at once, then increase exposure when trades are working in their favor.
This reinforces the point that a Follow-Through Day should not be treated as an unconditional signal to buy with full exposure. IBD MarketSurge Stock Guide
Conclusion: Check the structure of the rally attempt before focusing on the sharp drop
If an index plunges after a Follow-Through Day, you should not continue to assume that an uptrend has been confirmed. But you should not conclude that the uptrend has ended based on a single day's decline, either.
In practice, prioritize these three factors:
Market breadth: Is the balance between advancing and declining stocks improving?
Selling pressure: Are Distribution Days recurring, and is volume increasing on down days?
Trend invalidation: Is the rally attempt's first-day low holding?
If all three deteriorate at the same time, it may be prudent to be more cautious about new purchases.
Conversely, even if the index corrects, the rally attempt may still have room to continue if it holds above its first-day low, market breadth improves again, and leading stocks hold their buy points.
The essence of CAN SLIM is not just identifying a Follow-Through Day. It is adjusting risk exposure in response to the market's subsequent behavior.
In the stock market, it is important to check whether a bullish confirmation signal holds afterward, not just whether it appears.
※ This article is for informational purposes to help readers understand market trends and is not a recommendation to invest in any particular stock or asset. You are responsible for your final decisions and investments.