

CAN SLIM 7~8% Stop-Loss Rule: Calculate from the Actual Purchase Price, Not the Chart Buy Point
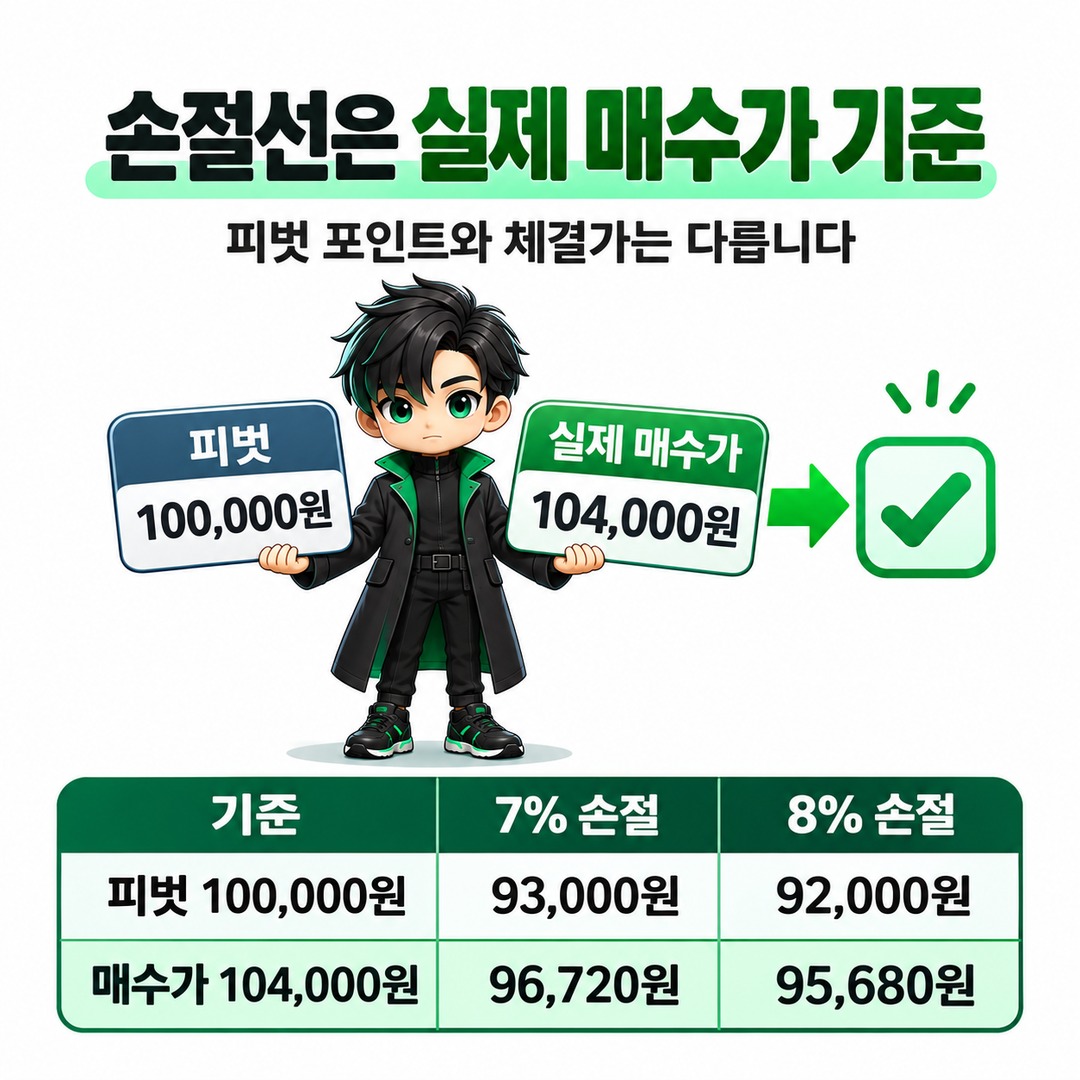
As a rule, CAN SLIM’s 7~8% stop-loss level is calculated from the price at which the stock was actually purchased (Purchase Price), not the pivot point (Pivot Point) shown on the chart. William O’Neil’s explanation and Investor’s Business Daily (IBD)’s 2023 4-quarter investment guide also advise calculating the stop-loss level based on the actual price paid.
The chart’s pivot point is still important in its own right. It helps determine an appropriate entry price and the risk area on the chart, while the actual execution price reflects the investor’s purchase cost.
Why Is the CAN SLIM 7~8% Stop-Loss Level Based on the Actual Execution Price?
The 7~8% stop-loss rule is intended to limit losses to the investment principal when a purchased stock moves contrary to expectations.
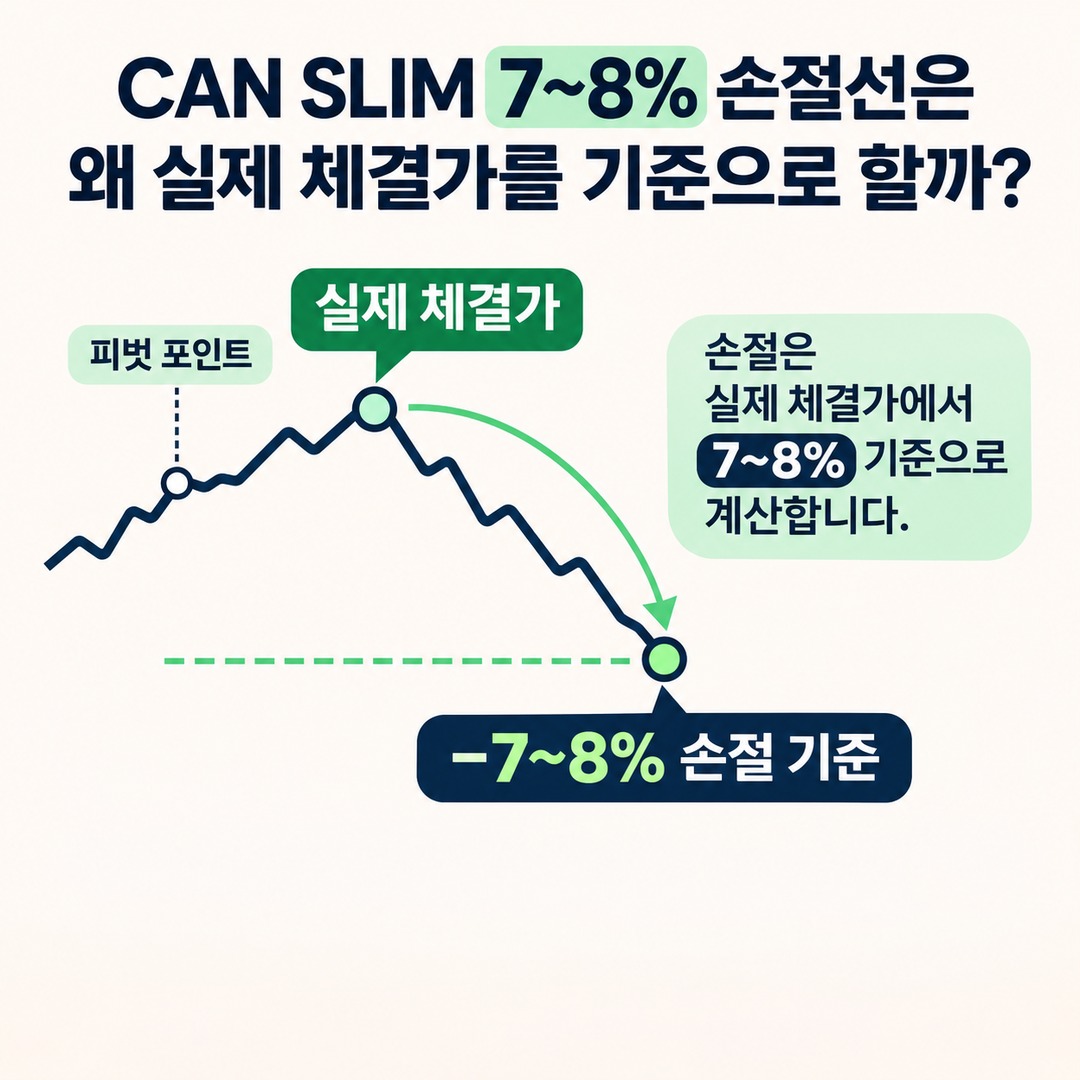
In a 2002-06-20-published interview with The Motley Fool, William O’Neil explained his rule of selling a stock he had purchased if it fell 7~8% below his actual purchase price.
The basis used in the interview was the price at which he actually bought the stock, not the ideal buy point on the chart.
This standard is also confirmed in the 2023 4-quarter MarketSmith Stock Guide published by IBD.
The original Investor’s Business Daily official investment guide distinguishes between the following two items:
7~8% stop-loss level: calculated from the actual purchase price paid
Chart stop zone: a reference area shown in relation to the pivot point
It also explains that when the stop zone shown on the chart differs from the actual purchase price, investors need to calculate the stop price separately.
Therefore, using the stop level shown on the chart as is must be distinguished from recalculating the stop level to reflect the actual execution price.
What If You Buy at KRW 104,000 When the Pivot Is KRW 100,000?
Let’s work through a hypothetical example.
Assume the pivot point identified on the chart is KRW 100,000 and the actual purchase execution price is KRW 104,000.
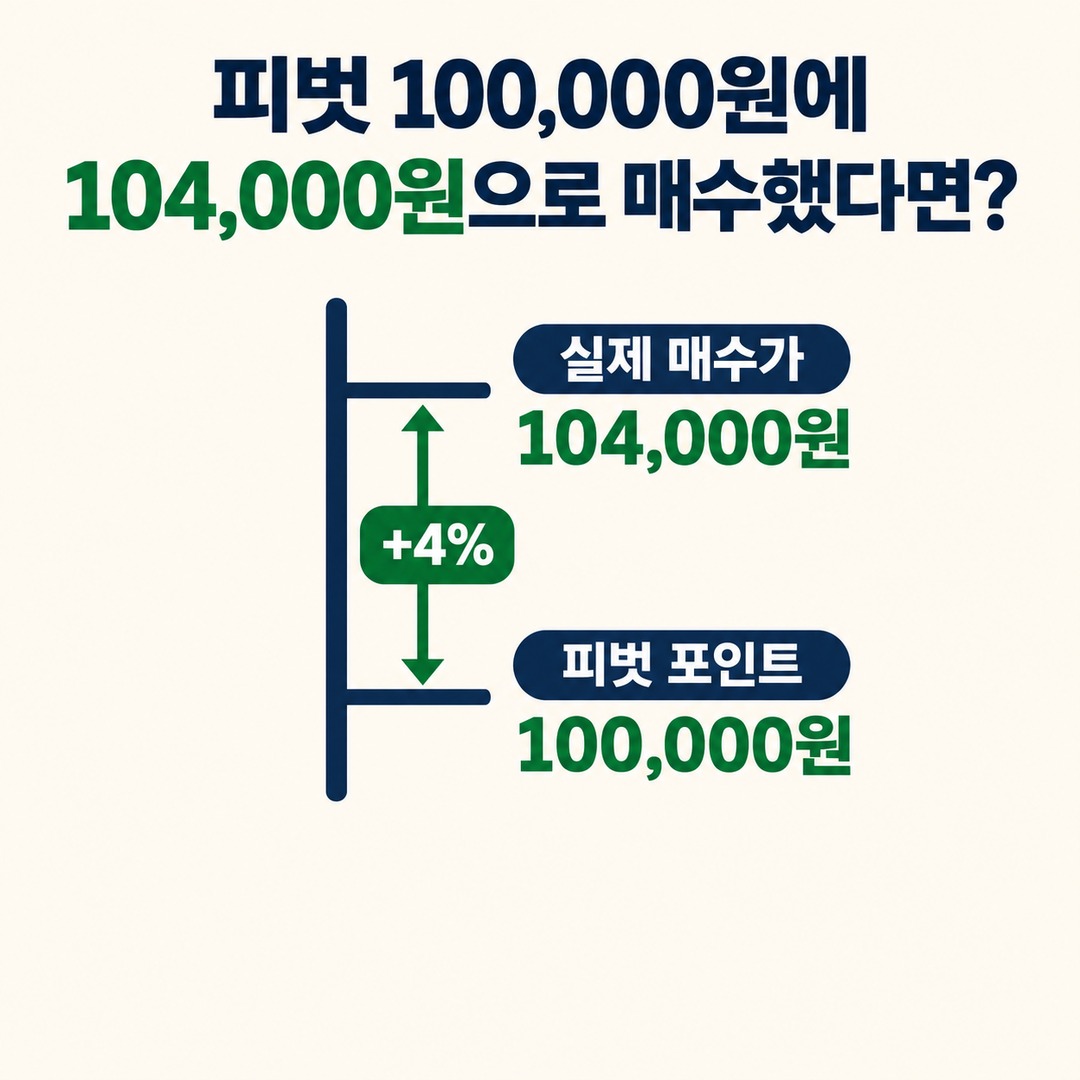
The stock was purchased at a price 4% above the pivot point.
Hypothetical Calculation Example
| Category | Price |
|---|---|
| Chart pivot point | KRW 100,000 |
| Actual purchase execution price | KRW 104,000 |
| Purchase price difference from pivot | +4% |
| 7% stop-loss based on actual purchase price | KRW 96,720 |
| 8% stop-loss based on actual purchase price | KRW 95,680 |
Author’s Calculation
7% stop-loss price:
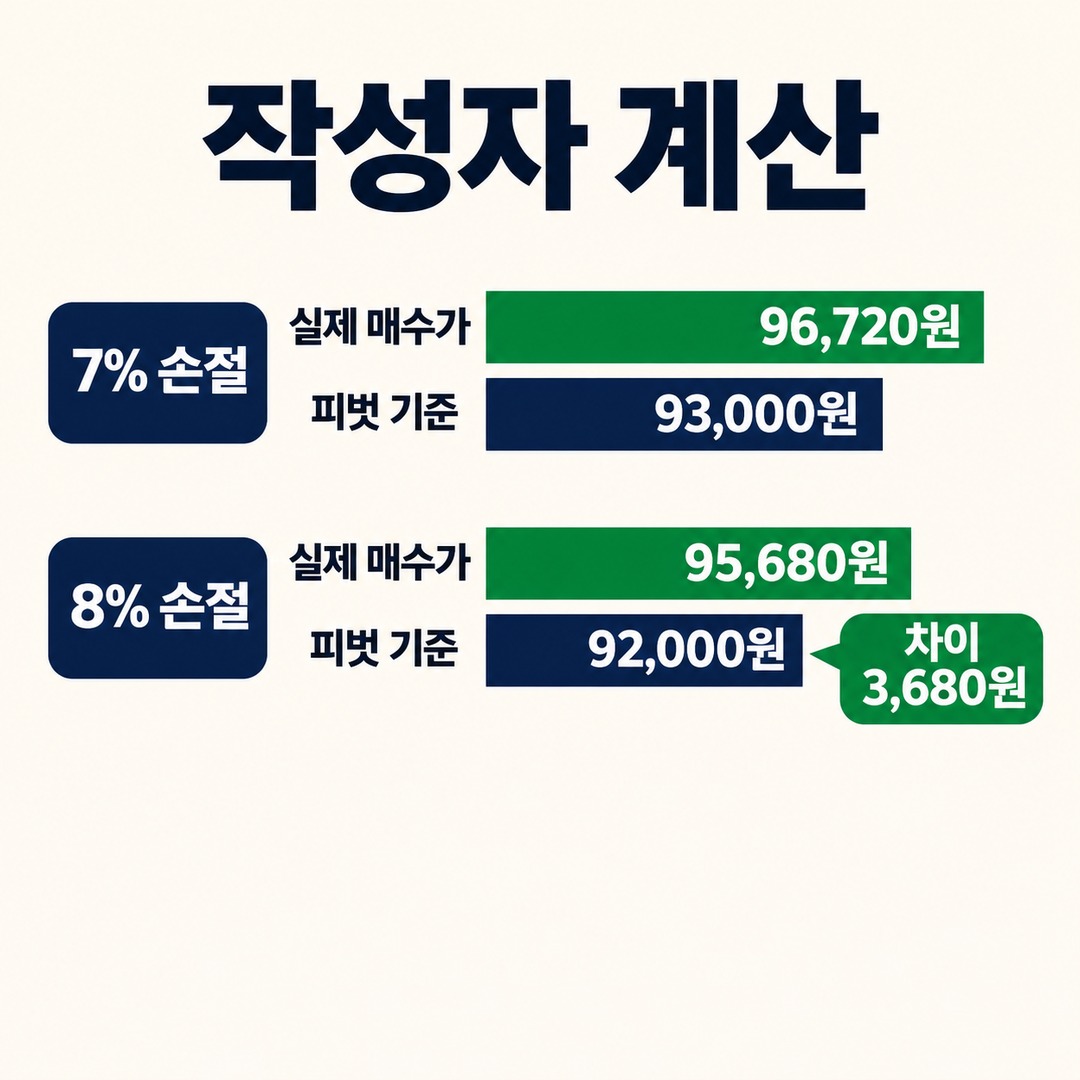
KRW 104,000 × (1 - 0.07) = KRW 96,720
8% stop-loss price:
KRW 104,000 × (1 - 0.08) = KRW 95,680
By comparison, calculating from the pivot point KRW 100,000 gives the following:
7% decline: KRW 93,000
8% decline: KRW 92,000
Comparing the two methods shows that the stop-loss prices differ considerably.
The 8% stop-loss price based on the actual execution price is KRW 95,680, while the 8% stop-loss price based on the pivot is KRW 92,000.
The difference is KRW 3,680.
Calculating the stop-loss level from the pivot point allows the loss to extend to a price below the purchase price the investor actually paid.
That is the key reason to calculate the stop-loss level from the actual purchase price.
How Does the Chart’s 5~8% Stop Zone Differ from the Actual Stop Price?
IBD’s MarketSmith Stock Guide describes the stop zone shown on the chart as an area 5~8% below the pivot point.
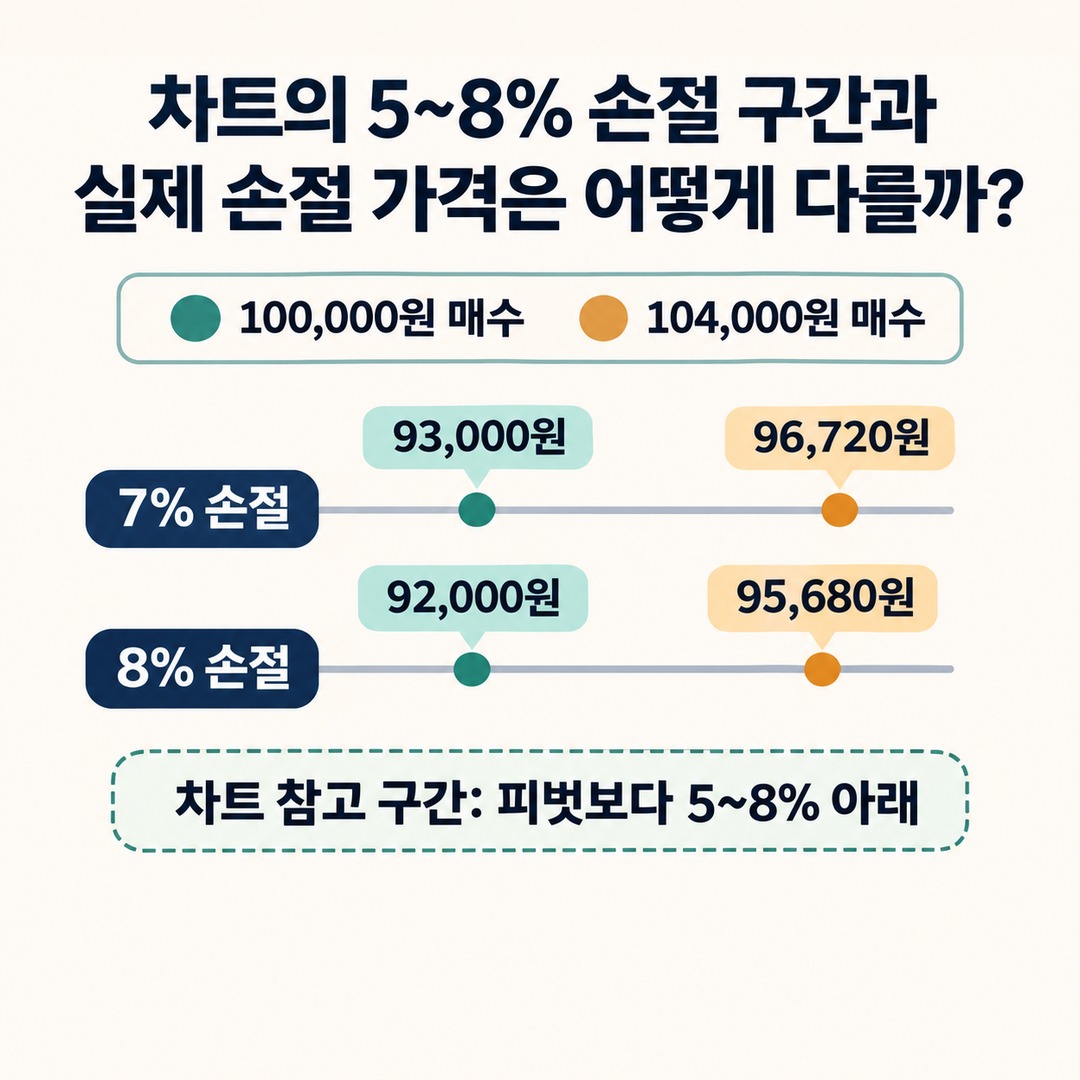
However, this area is not a fixed stop-loss level that matches every investor’s actual execution price.
For example, the stop-loss level differs for someone who buys a stock with a pivot point of KRW 100,000 at KRW 100,000 and someone who buys it at KRW 104,000.
| Comparison | Bought at KRW 100,000 | Bought at KRW 104,000 |
|---|---|---|
| 7% stop-loss level | KRW 93,000 | KRW 96,720 |
| 8% stop-loss level | KRW 92,000 | KRW 95,680 |
The key is to use the chart’s stop zone as a reference when assessing the timing and price of a purchase, then calculate the actual stop price based on your own execution price.
Also, if you bought at more than 5% above the pivot point, the issue is not simply how to adjust the stop price. You should also consider whether the purchase was a chase buy outside the appropriate buy zone.
Steps for Calculating the Actual Stop Price After Buying
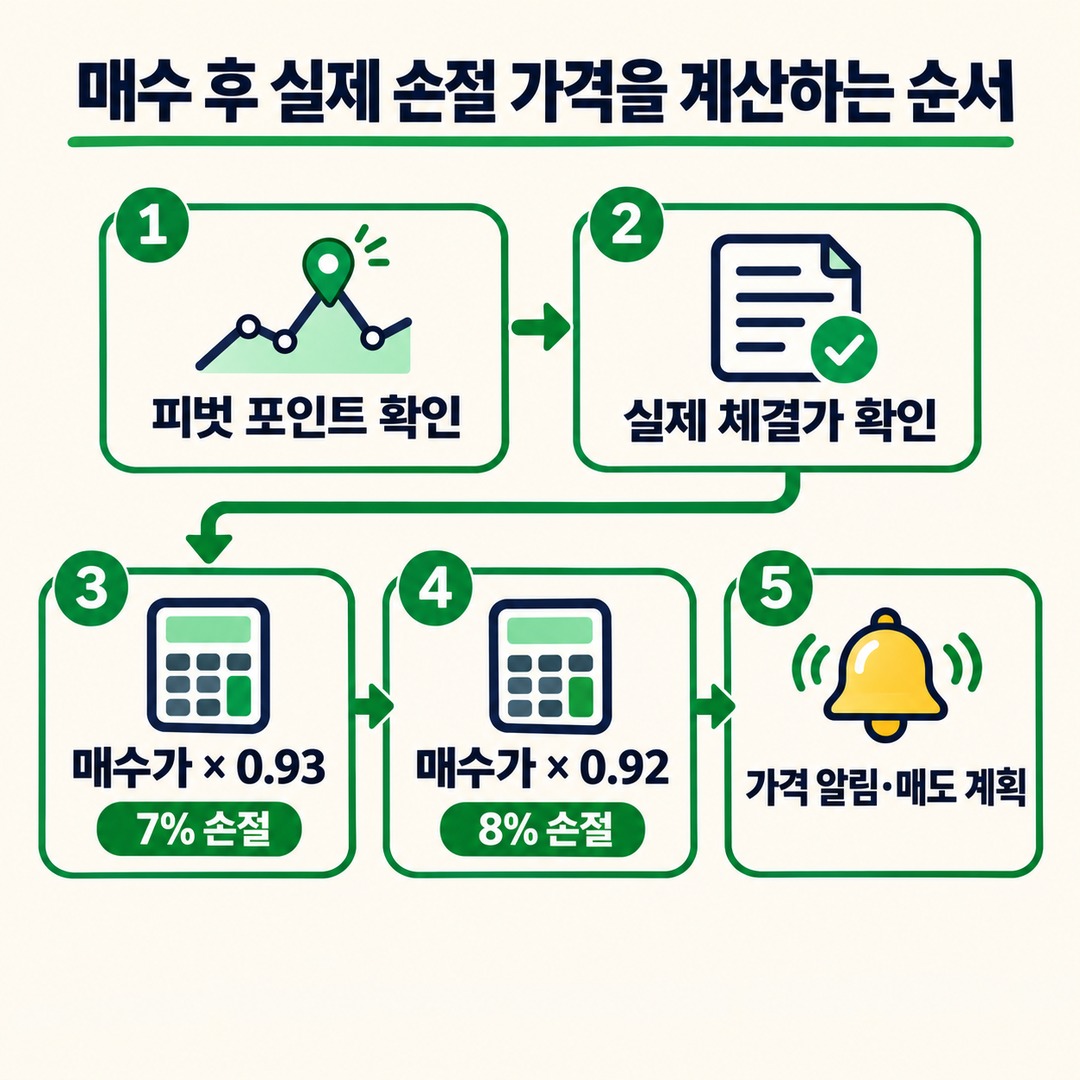
When applying this in an actual trade, check the following in order.
1. Identify the appropriate pivot point for the stock on the chart.
2. Check the actual purchase execution price in your brokerage transaction history.
3. Multiply the actual purchase price by 0.93 to calculate the 7% stop-loss price.
4. Multiply the actual purchase price by 0.92 to calculate the 8% stop-loss price.
5. Set a price alert or create a sell plan based on the calculated price.
If the order was filled in multiple executions, check the price and quantity of each fill. If you manage the entire position as a single unit, you can separately calculate the weighted average purchase price, taking quantity into account. If you manage each purchase separately, you can record a separate stop-loss level for each fill.
The key is not to mistake the pivot price shown on the chart for the actual execution price.
Will the Stock Definitely Sell at the Stop Price Once It Reaches That Level?
No. The stop price is a reference for planning a sale; it does not guarantee the actual execution price.
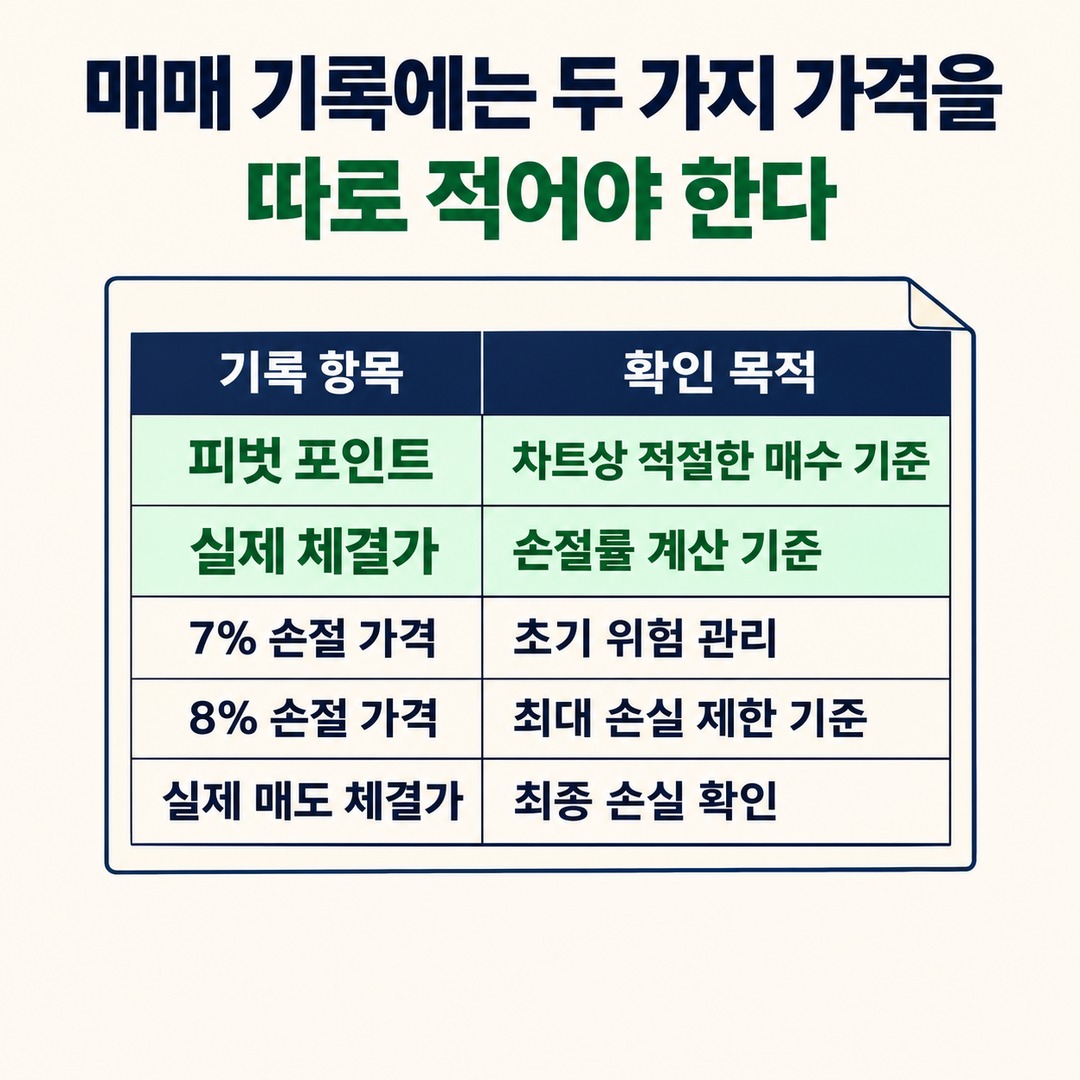
An investor guide updated by the U.S. Securities and Exchange Commission’s (SEC) Investor.gov on 2026-08-18 also explains how stop orders work and the associated price risks.
A stop order becomes a market order when the specified price is reached.
The actual execution price may differ from the specified stop price.
A sharp price move or lack of liquidity may result in an execution at a less favorable price than expected.
A stop-limit order can limit the price, but the order itself may not be executed.
Therefore, setting a 8% stop-loss price does not mean that the actual loss will end exactly at 8%.
The execution price may differ, especially during price movements around the market open or in a sharp decline.
Record These Two Prices Separately in Your Trade Log
If you manage growth stocks using the CAN SLIM method, it is a good idea to record the pivot point and the actual execution price separately in your trade log.
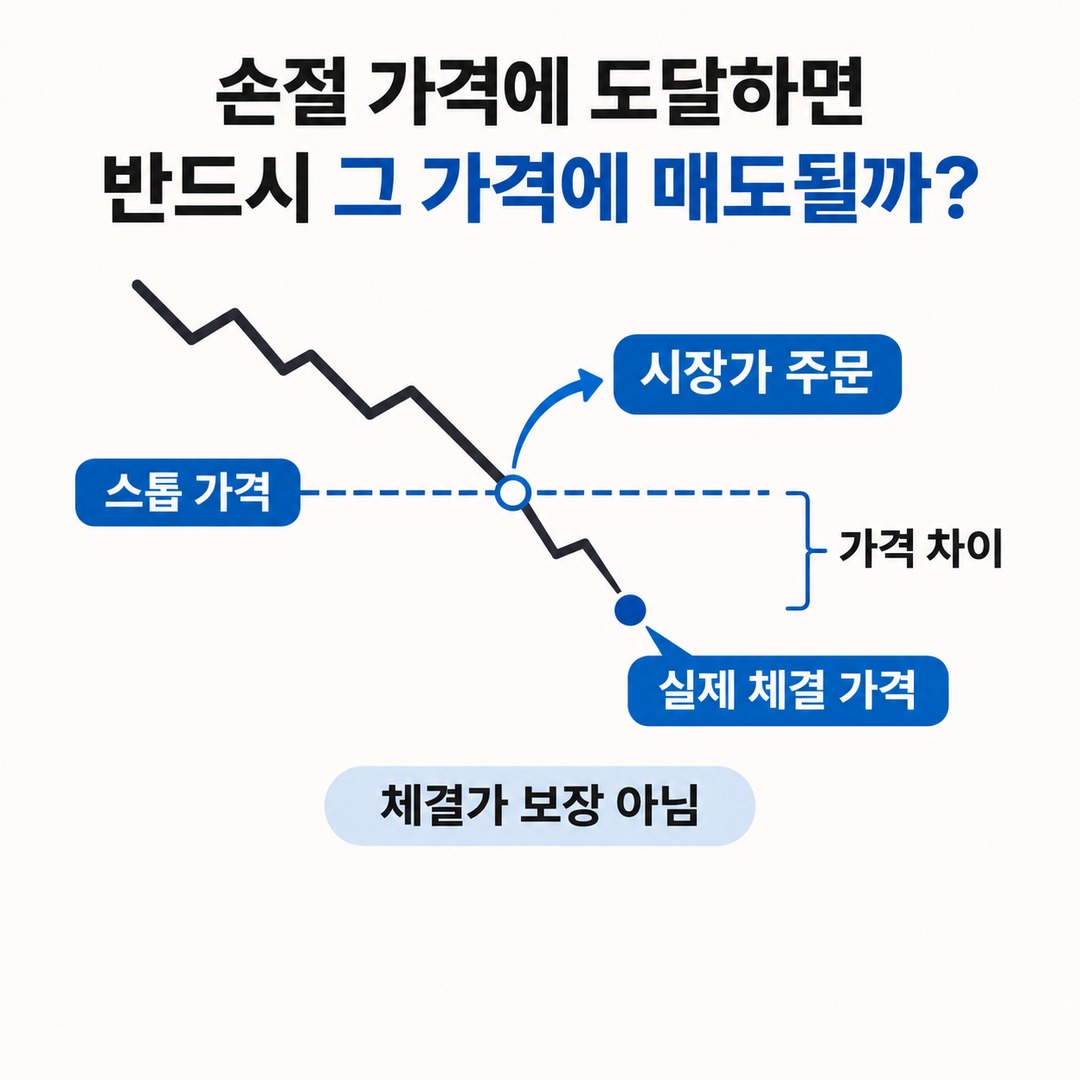
| Log item | Purpose |
|---|---|
| Pivot point | Appropriate buy level on the chart |
| Actual execution price | Basis for calculating the stop-loss percentage |
| 7% stop-loss price | Initial risk management |
| 8% stop-loss price | Maximum loss limit |
| Actual sale execution price | Confirming the final loss |
Keeping these records makes it possible to review afterward whether the purchase timing was appropriate and how buying above the pivot affected the stop-loss range.
The principle to remember when calculating the CAN SLIM 7~8% stop-loss level is clear.
The pivot point is the price used to assess the buy location, while the actual execution price is the price used to calculate the stop-loss percentage.
After identifying the pivot on the chart, calculate the 7% and 8% prices separately using the actual purchase execution price. However, the actual execution price of a stop order and the loss percentage may vary depending on market conditions.
※ This article provides reference information for understanding market trends and is not a recommendation to invest in any particular stock or asset. You are responsible for your own final decisions and investments.