

Stock RSI Breaks Above 70: Why You Shouldn’t Sell Immediately and How to Check Trend and Volume
This post contains Coupang Partners affiliate links. We may earn a commission from qualifying purchases.
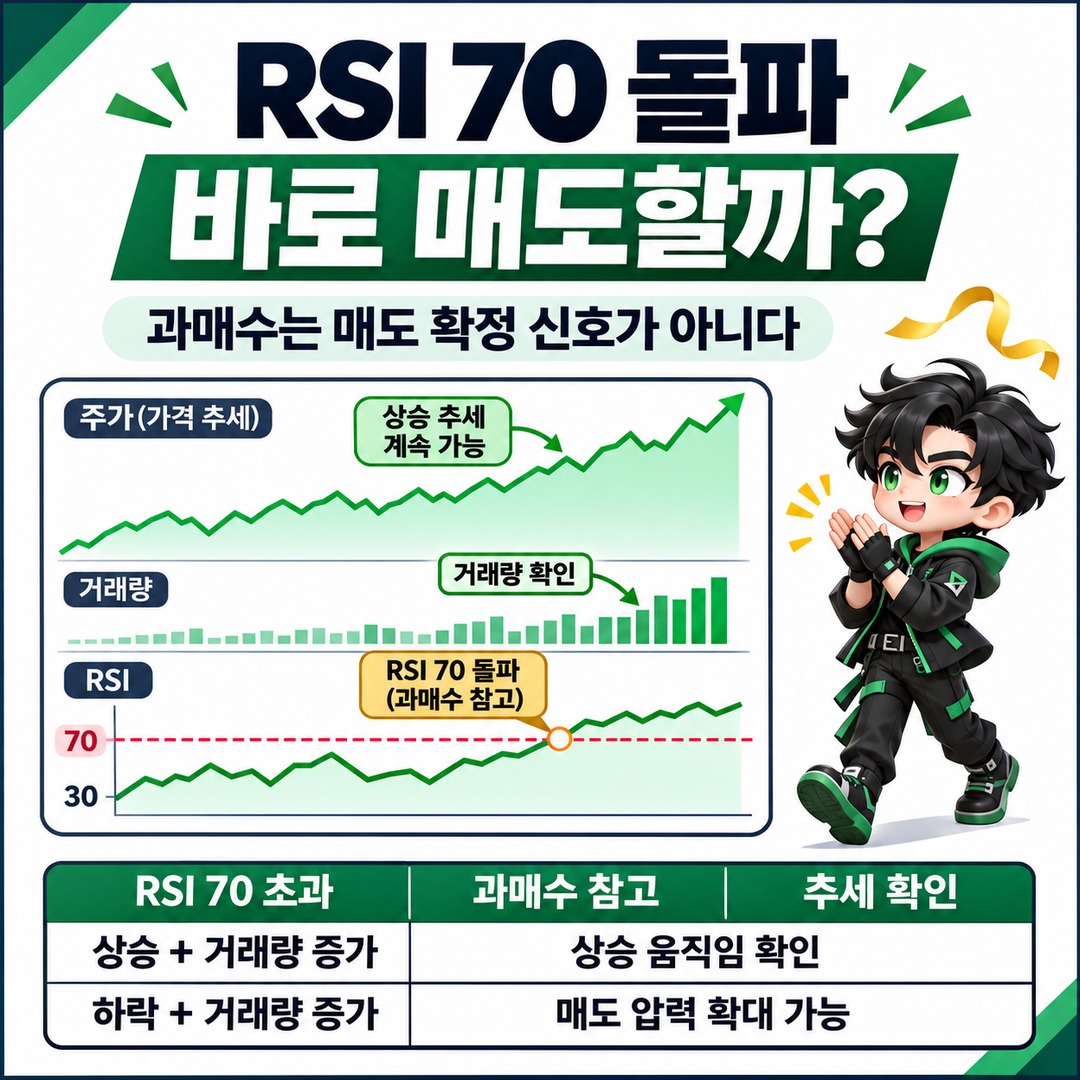
You do not need to sell immediately just because the RSI (Relative Strength Index) rises above 70. RSI 70 is generally a reference point for identifying overbought conditions, not a sell signal meaning that the stock price must fall. In a strong uptrend, the RSI can remain at or above 70 while the stock price continues to rise.
Therefore, when deciding whether to sell, check whether the uptrend is holding, how trading volume is changing, and whether the RSI falls back below 70 rather than relying on the RSI number alone.
RSI 70 is a signal to reassess price action, not a definitive sell signal
The RSI is a technical indicator that compares gains and losses over a recent period to express a stock’s upward or downward momentum on a scale of 0~100.
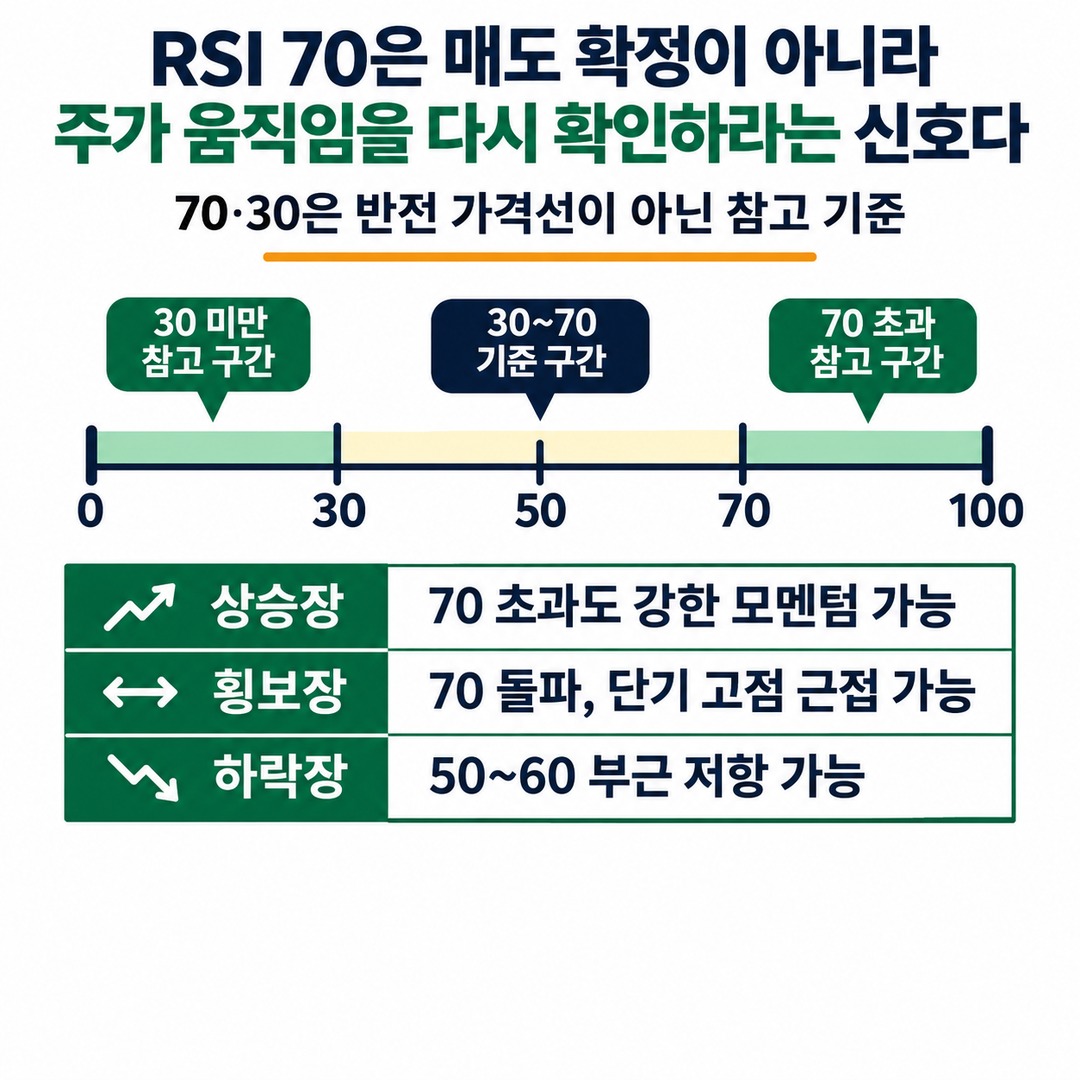
The following thresholds are commonly used.
| RSI level | General interpretation | What to check |
|---|---|---|
| Above 70 | Overbought | Whether the uptrend continues |
| 50~70 | Potentially stronger upward momentum | Whether the trend holds |
| 30~50 | Potentially weaker momentum | Whether support holds |
| Below 30 | Oversold | Whether downward pressure is easing |
These are the traditional RSI interpretation zones introduced by J. Welles Wilder. However, 70 and 30 are not price levels at which a stock must reverse.
TradingView’s official RSI guide also presents RSI 14 as a common setting and describes overbought and oversold thresholds.
The important distinction is this:
In a sideways market, a break above RSI 70 can be used as a signal that the price is approaching a short-term high.
In an uptrend, a break above RSI 70 may reflect strong upward momentum.
In a downtrend, the RSI may meet resistance around 50~60 and remain weak.
So when you see RSI 70, first determine whether the stock is in an uptrend, a sideways market, or a downtrend.
In an uptrend, the stock price can keep rising even after RSI moves above 70
In a strong uptrend, the stock price may continue to rise even while the RSI stays at or above 70.
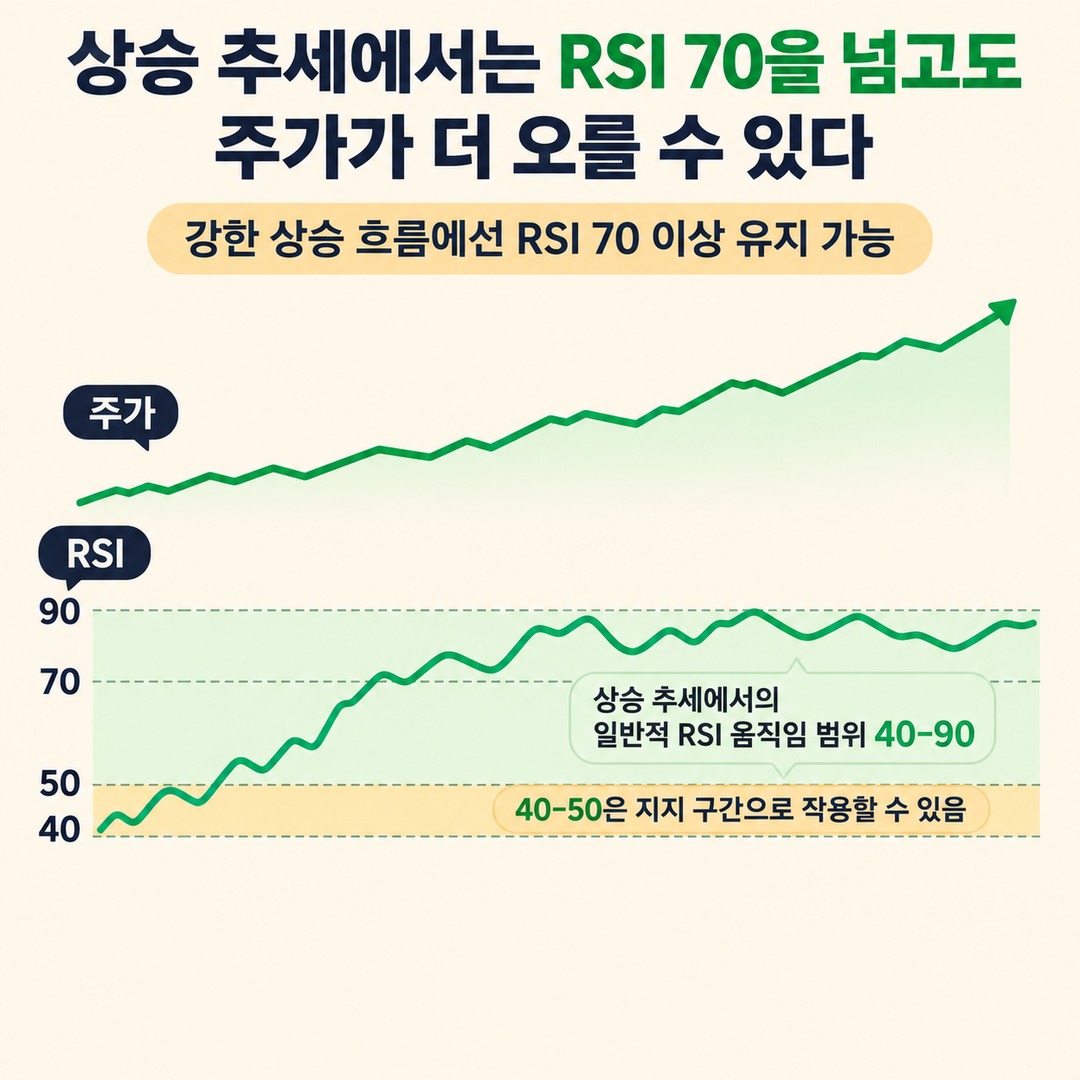
This can be explained by understanding how the RSI works. Because it measures the relative strength of recent gains and losses, it can remain high when gains continue to outweigh losses.
Fidelity’s U.S. financial education guide to the RSI technical indicator explains that, in a strong trend, the RSI can remain in overbought or oversold territory for an extended period.
It also suggests that, in an uptrend, the RSI generally moves within the 40~90 range, with the 40~50 zone tending to act as support. This is not a fixed rule that applies to every stock; the interpretation varies with trend strength and RSI settings.
When checking for an uptrend, it helps to look at these three things.
1. Is the stock price breaking above previous highs and making higher lows?
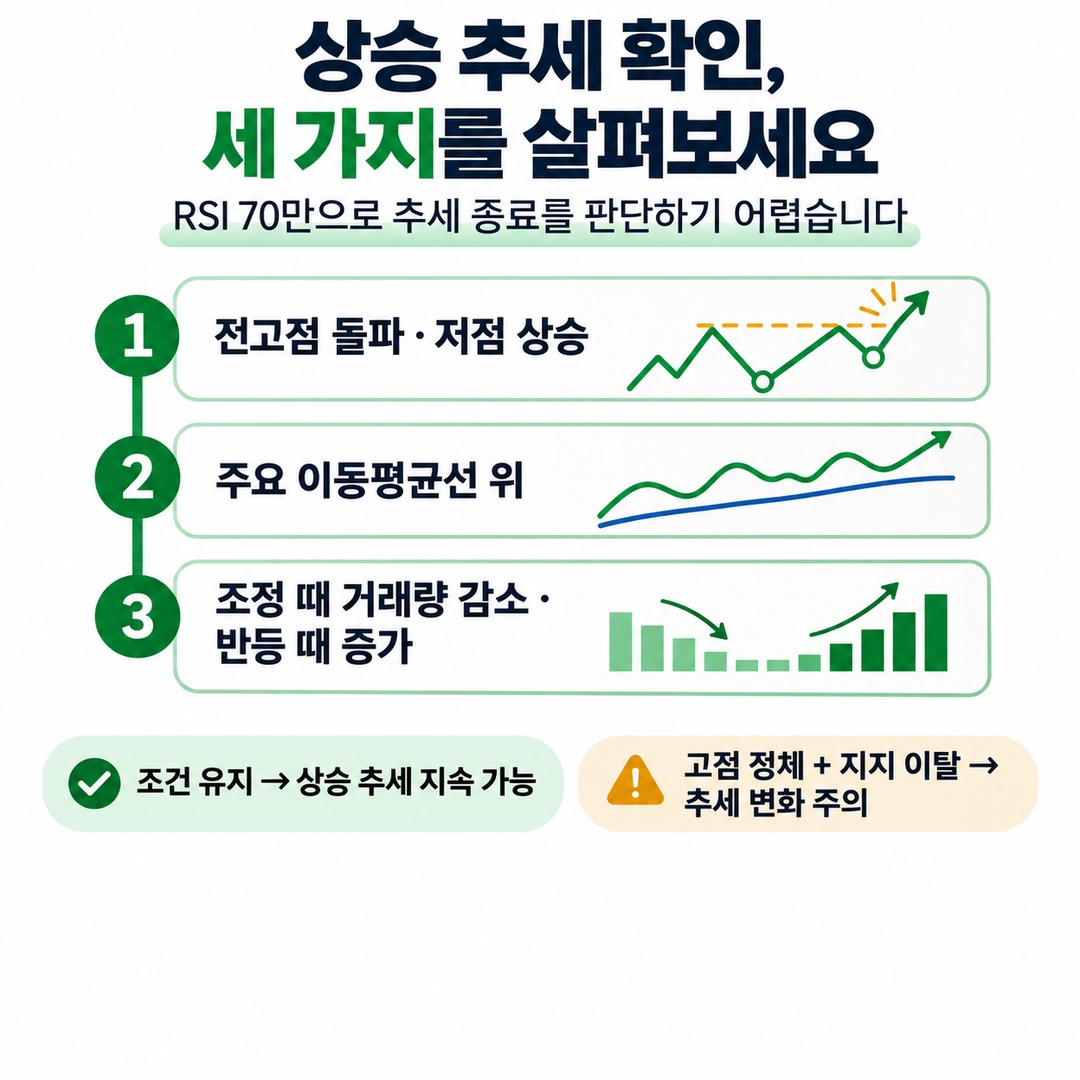
2. Is the stock price trading above key moving averages?
3. When the price pulls back, does volume decline, then pick up again during a rebound?
If these conditions hold, it is difficult to conclude that the uptrend has ended based only on RSI breaking above 70.
Conversely, if the stock fails to make higher highs and begins to break below key support, watch for a possible trend change even if the RSI remains above 70.
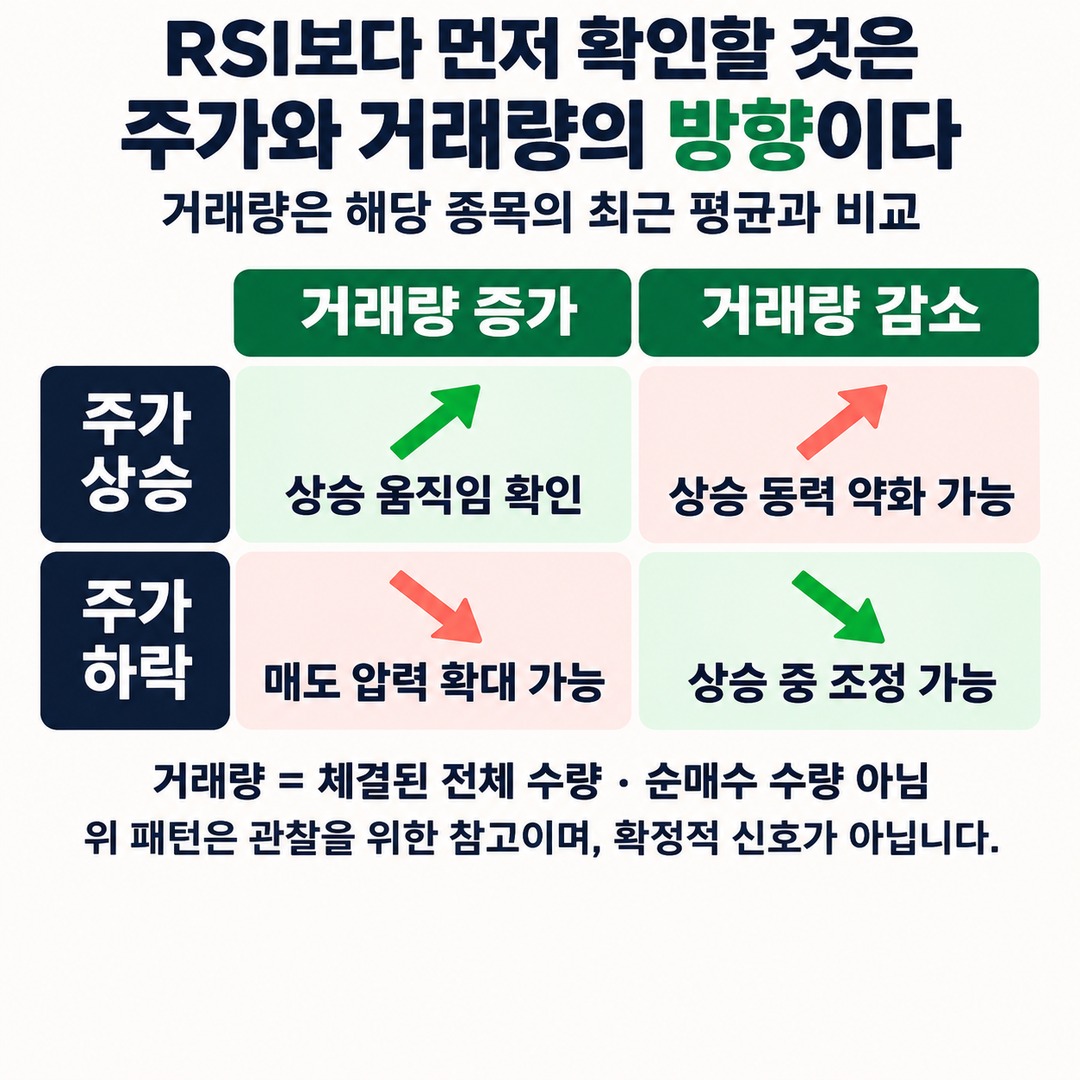
Check the direction of price and volume before focusing on the RSI
Volume is the number of shares actually traded over a given period. High volume does not necessarily mean strong buying pressure, but it can show how much trading accompanied a price move.
Charles Schwab’s 2026-06-05 guide to volume analysis explains how to check whether volume is above its recent average and whether it supports the price trend.
Here are some basic guidelines for interpreting volume in an uptrend.
| Price movement | Change in volume | Interpretation |
|---|---|---|
| Rising | Increasing | Confirms upward movement |
| Rising | Decreasing | Possible weakening of upward momentum |
| Falling | Decreasing | Possible pullback within an uptrend |
| Falling | Increasing | Possible increase in selling pressure |
The important point is not to compare volume as an absolute number of shares.
Large-cap stocks with active trading and small-cap stocks with light trading typically have different baseline volumes. So compare a stock’s volume with its recent average.
Note: Volume is the total number of shares traded in completed buy and sell transactions, not the net number of shares bought.
How should you interpret declining volume when RSI is at or above 70?
If the stock keeps making higher highs while volume gradually declines, check whether participation supporting the upward move is weakening.
Conversely, if volume declines during a pullback and increases again when the price rises, that can be a reason to watch whether the existing uptrend is holding.
However, a decline in volume alone is not enough to confirm a peak or a reversal to a downtrend.
That is why it is important to look at the relationship between volume and price together.
Does bearish RSI divergence strengthen the case for selling?
Bearish RSI divergence occurs when the stock price makes a higher high than before, while the RSI peak is lower than its previous peak.
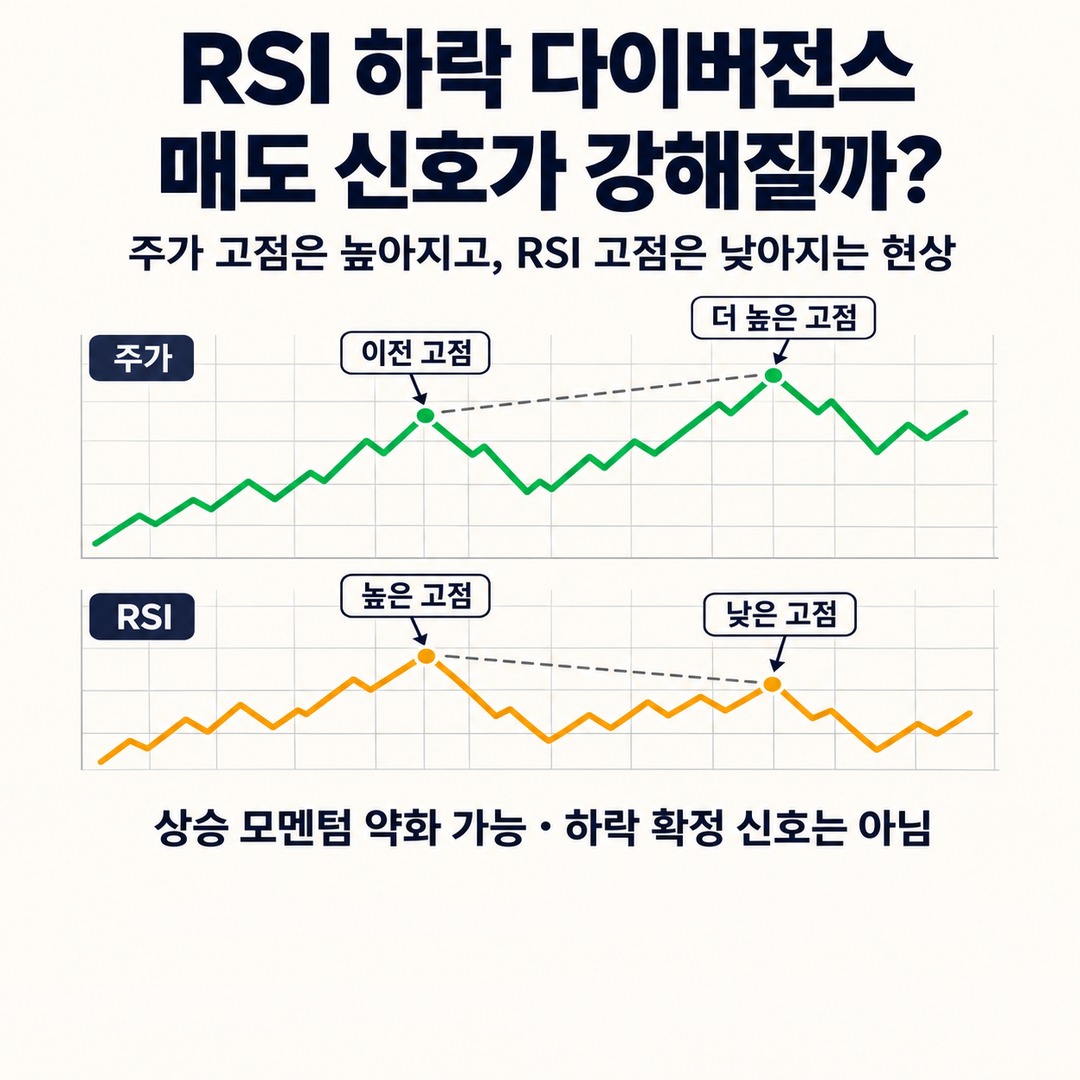
For example, the movement might look like this:
First stock price peak: the previous high
Second stock price peak: higher than the previous high
First RSI peak: a higher reading
Second RSI peak: a lower reading than before
This may be interpreted to mean that the price rose, but upward momentum was not as strong as it had been.
This is a technical pattern in which price and RSI move in different directions; it does not confirm that a future decline will occur.
StockCharts’ RSI analysis explains that, in actual chart examples, a strong uptrend may not end immediately even after bearish RSI divergence appears.
So if divergence appears, it is a good idea to check the following as well.
1. Has the stock price made a new high?
2. Has the RSI made a lower high than its previous peak?
3. Has volume declined compared with the previous advance?
4. Did the stock price then break below its recent short-term low?
Checking all four conditions together can help distinguish a simple loss of upward momentum from an actual weakening in the price trend.
You can also check for an RSI failure swing
An RSI failure swing is an analytical method that uses the RSI’s own movement, independently of the highs and lows on the price chart.
A bearish failure swing unfolds in this order.
1. The RSI rises above 70.
2. The RSI falls back below 70.
3. The RSI rebounds but fails to recover 70.
4. The RSI breaks below its previous low again.
Once these four stages are complete, the RSI itself is interpreted as confirming a bearish signal.
However, this signal should also be assessed alongside breaks below price support, trading volume, and the broader market trend.

TradingView’s explanation of RSI failure swings describes these conditions step by step.
How should you decide whether to sell when analyzing a chart?
The following is a hypothetical example to explain the conditions; it is not based on a real stock’s past returns or trading record.
Hypothetical example: The price of a stock with RSI 75 keeps rising
Let’s compare two situations.
Situation A · Uptrend holds
The RSI breaks above 70 and rises to 75.
The stock price breaks above its previous high.
Volume declines during the pullback.
Volume picks up again during the rebound.
The stock price stays above key support.
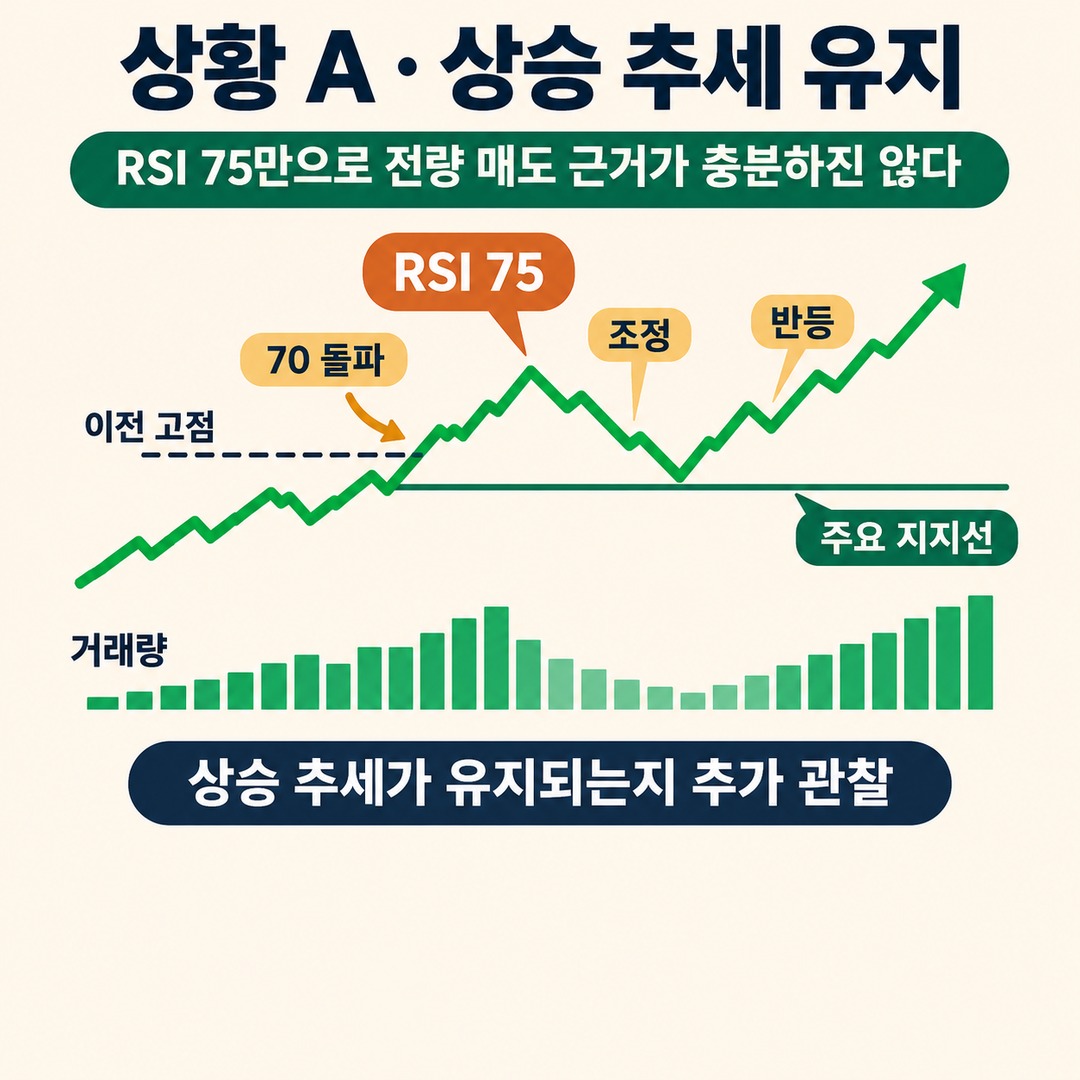
At this point, the number RSI 75 alone is not enough to justify selling the entire position. You can continue monitoring whether the uptrend is holding.
Situation B · Upward momentum weakens
The RSI rises above 70 and reaches 75.
The stock price makes a new high, but the RSI peak is lower.
Volume declines as the stock price rises.
Volume increases during declines.
The stock price later breaks below its recent short-term low.
In this situation, check whether the uptrend is weakening rather than focusing only on overbought conditions. You may consider reducing part of your position or reviewing your predefined exit criteria.
The key difference between the two examples is not the RSI reading.
It is whether price highs and lows, volume direction, and trend support are holding together.
A 5-step checklist after RSI breaks above 70
When reviewing an actual chart, following these steps can help you apply your decision criteria consistently.
Step 1. Check the RSI settings
Indicator setting: Check that you are analyzing based on RSI 14. The signal’s meaning also changes with the time interval, such as 5-minute, daily, or weekly charts.
Step 2. Check the uptrend
Check whether the stock is making higher highs and higher lows, and whether it is above key moving averages such as the 20-day and 60-day moving averages.
Step 3. Compare trading volume
Compare recent volume with the 50-day average. Check whether volume increases during advances and declines during pullbacks.
Step 4. Check for RSI divergence
Check whether the stock has made a new high while the RSI peak has fallen. Do not sell based on divergence alone; examine price movement further.
Step 5. Check your actual exit criteria
Review predefined price levels, such as the previous low, support, and trend lines. If the trend breaks, decide whether to adjust your position size or follow your stop-loss criteria.
The key is not to decide on the price levels in Step 5 on the spur of the moment after checking the RSI.
Prioritize your predefined loss tolerance and exit criteria.
When RSI breaks above 70, should you sell or hold?
The table below offers a set of conditions to consider when making a trading decision.
| What you observe on the chart | How to interpret it |
|---|---|
| RSI breaks above 70, uptrend holds | Reassess the conditions for holding |
| RSI at or above 70, with rising volume | Watch whether the trend continues |
| RSI at or above 70, with declining volume | Watch for weakening upward momentum |
| Price makes a higher high, RSI makes a lower high | Check for bearish divergence |
| RSI failure swing completes | Look for additional exit signals |
| Key support breaks, volume rises during declines | Prioritize risk management |
As the table shows, RSI 70 is more like a warning light.
The actual decision to sell depends on whether price movement and volume support the signal.
Long-term investors and short-term traders may respond differently even when they see the same RSI 70. Short-term traders may look at daily and shorter-term charts together, while medium- and long-term investors should also consider weekly trends and changes in a company’s earnings and value.
Three limitations that are easy to overlook when using RSI 70
First, RSI is calculated from lagging price data. A falling RSI does not mean that the stock price must fall at the same time.
Second, the RSI 70 threshold is not equally suitable for every stock. More volatile stocks may enter overbought territory more often, and the reading also varies depending on the RSI lookback period.
Third, a surge in volume is not a definitive signal that the price will rise or fall. Volume can change sharply around earnings announcements, disclosures, and market events.
Technical indicators should therefore be used alongside a company’s earnings, market conditions, investment time horizon, and your own loss tolerance.
If RSI rises above 70, it is more reasonable to first check whether the uptrend and volume still support the stock price rather than selling immediately.
The key sequence I recommend is check whether RSI is overbought → check the price trend → compare volume → check for divergence → check whether support has broken.
Selling hastily just because RSI has moved above 70 could lead you to exit your position too early, in the middle of a strong uptrend. Conversely, you should also be wary of holding simply because the stock is overbought when the trend is actually breaking down.
Ultimately, it is better to use RSI as an indicator that prompts you to reassess the risk of your holdings, rather than as a signal to press the sell button.
※ This article is for informational purposes to help readers understand market trends and is not an investment recommendation for any particular stock or asset. You are responsible for your own final decisions and investments.
This post contains Coupang Partners affiliate links. We may earn a commission from qualifying purchases.