

Does Stock RSI 14 Mean 14 Days? Why a Break Above 70 Means Something Different on Daily, Weekly, and Intraday Charts
This post contains Coupang Partners affiliate links. We may earn a commission from qualifying purchases.
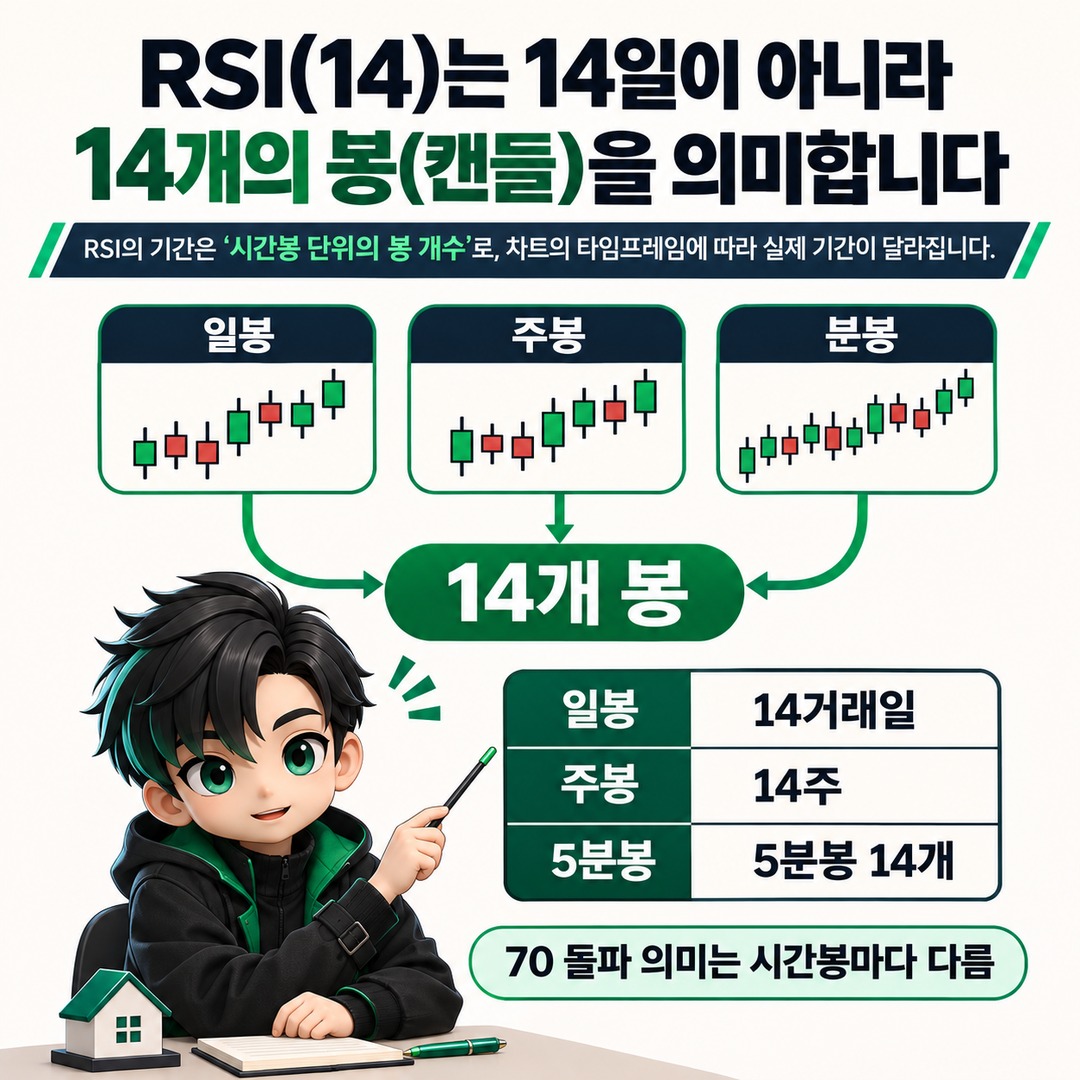
Even when RSI(14) on a stock chart rises above 70, its meaning depends on whether you are viewing a daily, weekly, or intraday chart. That is because the number 14 in the RSI settings generally refers to 14 candles, not 14 days. This article explains why RSI values change when you switch chart intervals for the same stock, and which interval to use as a reference.
What exactly does the number 14 in RSI 14 mean?
RSI 14 is the Relative Strength Index calculated from price changes across the most recent 14 candles on the selected chart.
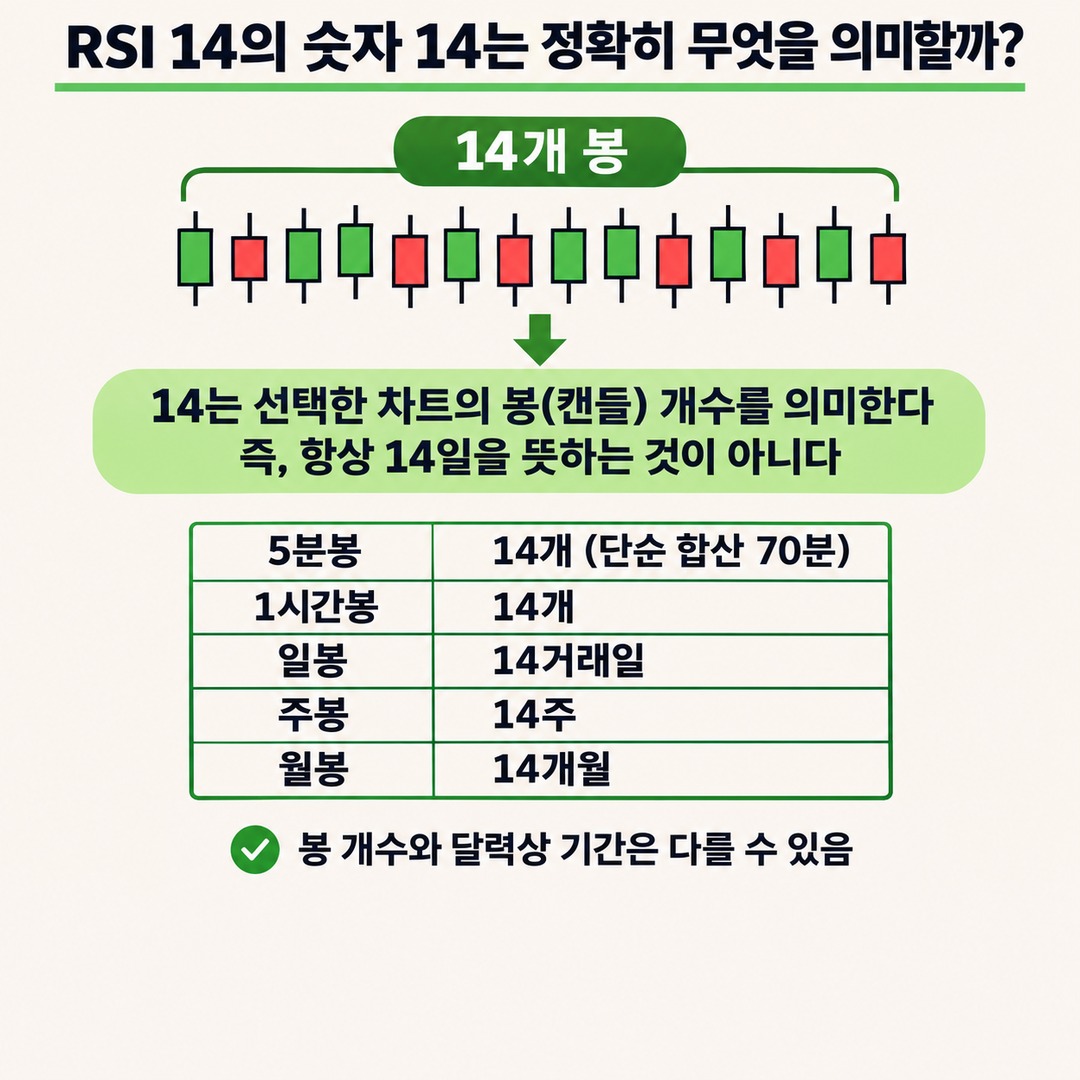
So on a daily chart, it is based on price changes over 14 trading days; on a weekly chart, it is based on price changes over 14 weeks. On an 1-hour chart, 14 hourly candles are included in the calculation.
The U.S. charting service TradingView also describes the RSI setting “Length” as the number of candles used in the calculation, with a default value of 14. TradingView
The differences by chart interval are as follows.
| Chart type | Period represented by RSI(14) |
|---|---|
| 5-minute chart | 5-minute candles 14 times |
| 15-minute chart | 15-minute candles 14 times |
| 1-hour chart | 1-hour candles 14 times |
| Daily chart | 14 daily candles |
| Weekly chart | 14 weekly candles |
| Monthly chart | 14 monthly candles |
For example, an RSI(14) on a 5-minute chart uses 14 5-minute candles, which corresponds to 70 minutes if you simply add up the candle intervals.
By contrast, daily RSI(14) uses price changes over 14 trading days.
The key point is that the stock market is not open all the time. Because of market holidays and closing times, the number of candles should be distinguished from the actual elapsed time on the calendar.
Why daily RSI and weekly RSI differ for the same stock
It is possible for the same stock's RSI to show 75 on the daily chart and 58 on the weekly chart.
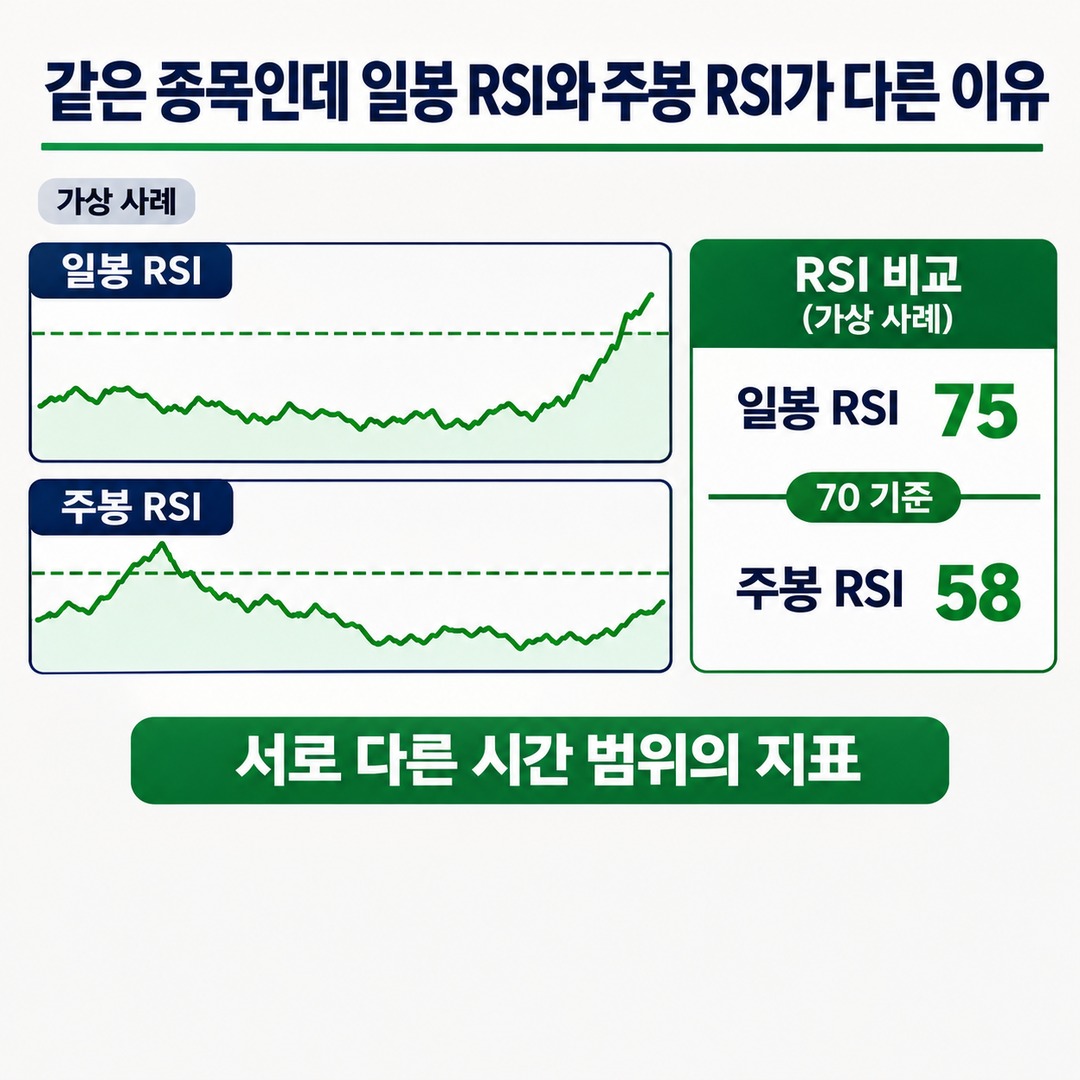
Neither indicator is wrong. They use different price data and time intervals in their calculations.
Consider the following hypothetical situation:
The stock price rose rapidly over the past few days.
But over the past several weeks as a whole, it has not fully recovered its earlier losses.
In this situation, daily RSI may rise above 70, reflecting the recent short-term uptrend.
Weekly RSI, by contrast, may remain below 70 because it reflects price action over several weeks.
This is a hypothetical example to illustrate the difference between chart intervals, not an observed reading for a specific stock.
Chart interval affects interpretation as follows:
| Comparison | Daily RSI | Weekly RSI |
|---|---|---|
| What it measures | Short-term price changes | Medium-term price changes |
| Main use | Checking short-term movement | Checking the broader trend |
| Break above 70 | Stronger recent upward momentum | Stronger upward pressure over several weeks |
| Caution | Intraday volatility and short-term noise | Signals are relatively slower |
Therefore, a daily RSI reading above 70 does not mean that weekly RSI is also in overbought territory.
The two indicators provide separate information about different time ranges.
Does the RSI 70 threshold apply in the same way to daily and weekly charts?
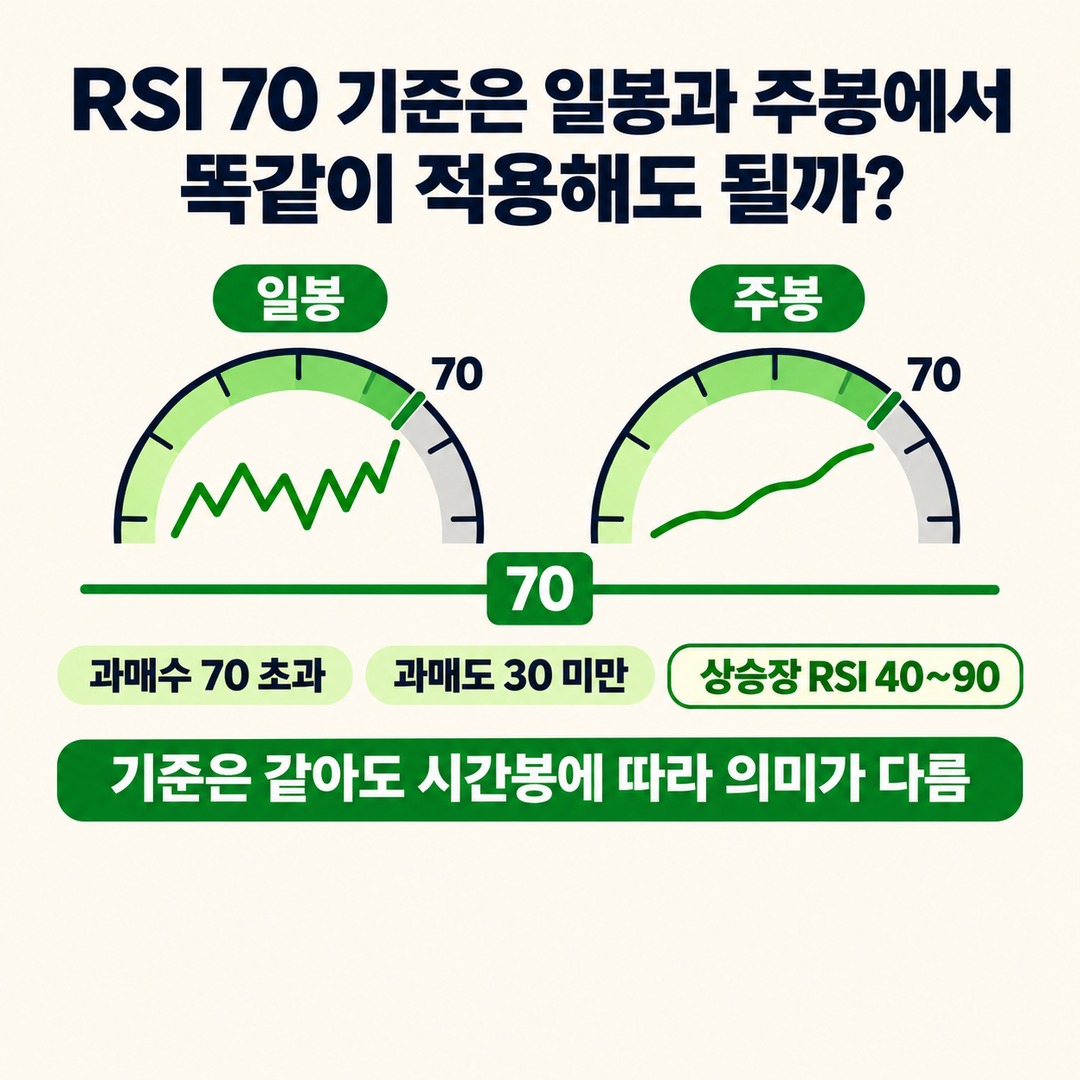
Traditional RSI interpretation classifies readings above 70 as overbought and readings below 30 as oversold.
This threshold can be used as a reference on both daily and weekly charts. However, the price movement represented by the number 70 covers a different range on each chart.
Fidelity, a U.S. investment company, also explains in its RSI guidance that RSI can remain in overbought territory for an extended period during a strong uptrend. It also notes that in a rising market, RSI tends to stay in the 40–90 range. Fidelity
The key is which chart interval recorded 70, rather than the threshold line at 70 itself.
For example, these two situations should be distinguished.
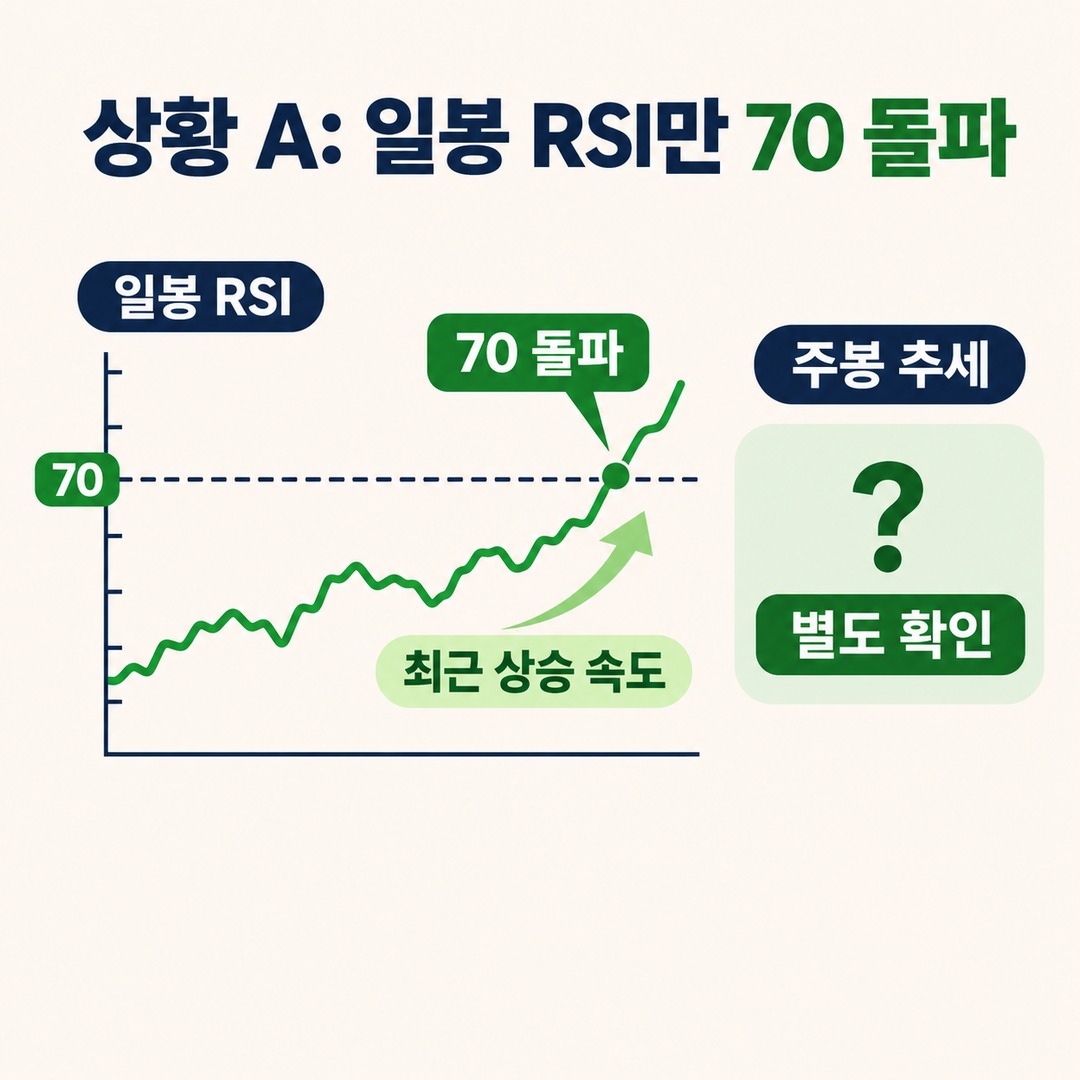
Situation A: Only daily RSI breaks above 70
This means the stock rose faster on recent trading days. Whether the weekly uptrend is still holding needs to be checked separately.
Situation B: Both daily and weekly RSI break above 70
This can be interpreted as strong upward pressure in weekly price movements as well as in the short term.
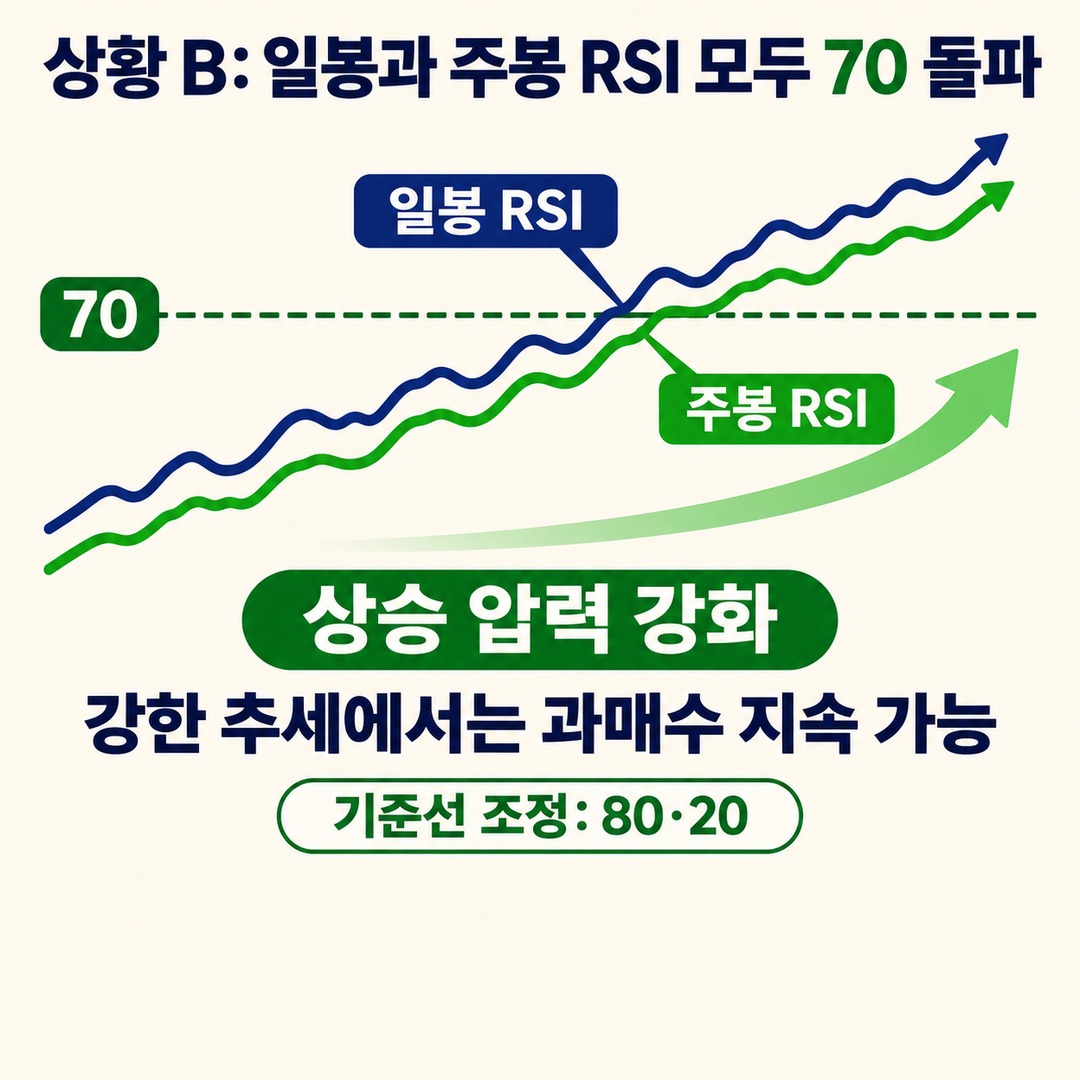
That said, the second situation does not automatically mean the stock price will fall. In a strong trend, overbought conditions can persist.
You can also adjust the RSI thresholds to 80 and 20, or to other values, but changing the settings also changes how often signals appear on historical charts and their characteristics.
How should you choose an RSI chart interval?
When choosing an RSI chart interval, it helps to start by deciding how long you plan to hold the stock.
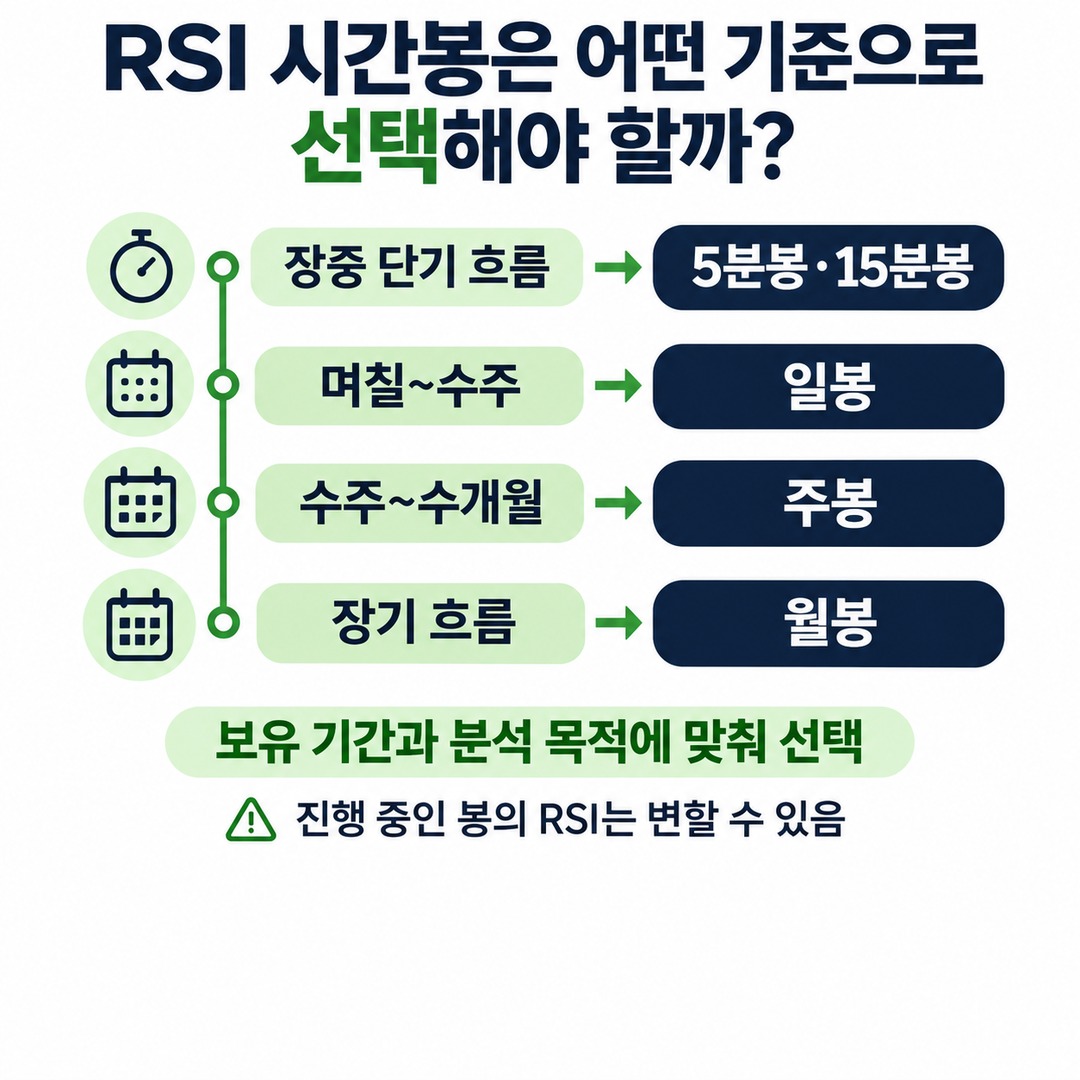
If you trade short term but only check monthly RSI, its response may be too slow. Conversely, long-term investors who focus only on 5-minute RSI may overreact to short-term price fluctuations.
General guidelines are as follows:
Short-term intraday movement: 5-minute and 15-minute charts
Movement over several days to a few weeks: daily chart
Trends over several weeks to a few months: weekly chart
Long-term price movement: monthly chart
These are reference points based on your analysis goals, not absolute trading rules.
You can reduce confusion by checking the chart in this order:
1. Check the chart interval currently selected at the top of the chart.
2. Check whether Length in the RSI settings is 14.
3. Check whether the price input is the closing price (Close).
4. Open the daily and weekly charts separately and compare their RSI readings.
5. Distinguish between a candle that is still forming and one that has closed.
In particular, the daily candle is not complete during the trading session, so its RSI value can still change.
The weekly RSI value may also remain unconfirmed until the last trading day of that week has passed.
TradingView's official help documentation also explains that RSI uses the closing price as its default input and lets users set the number of candles used in the calculation. TradingView
Why might RSI readings differ between brokerage firms?
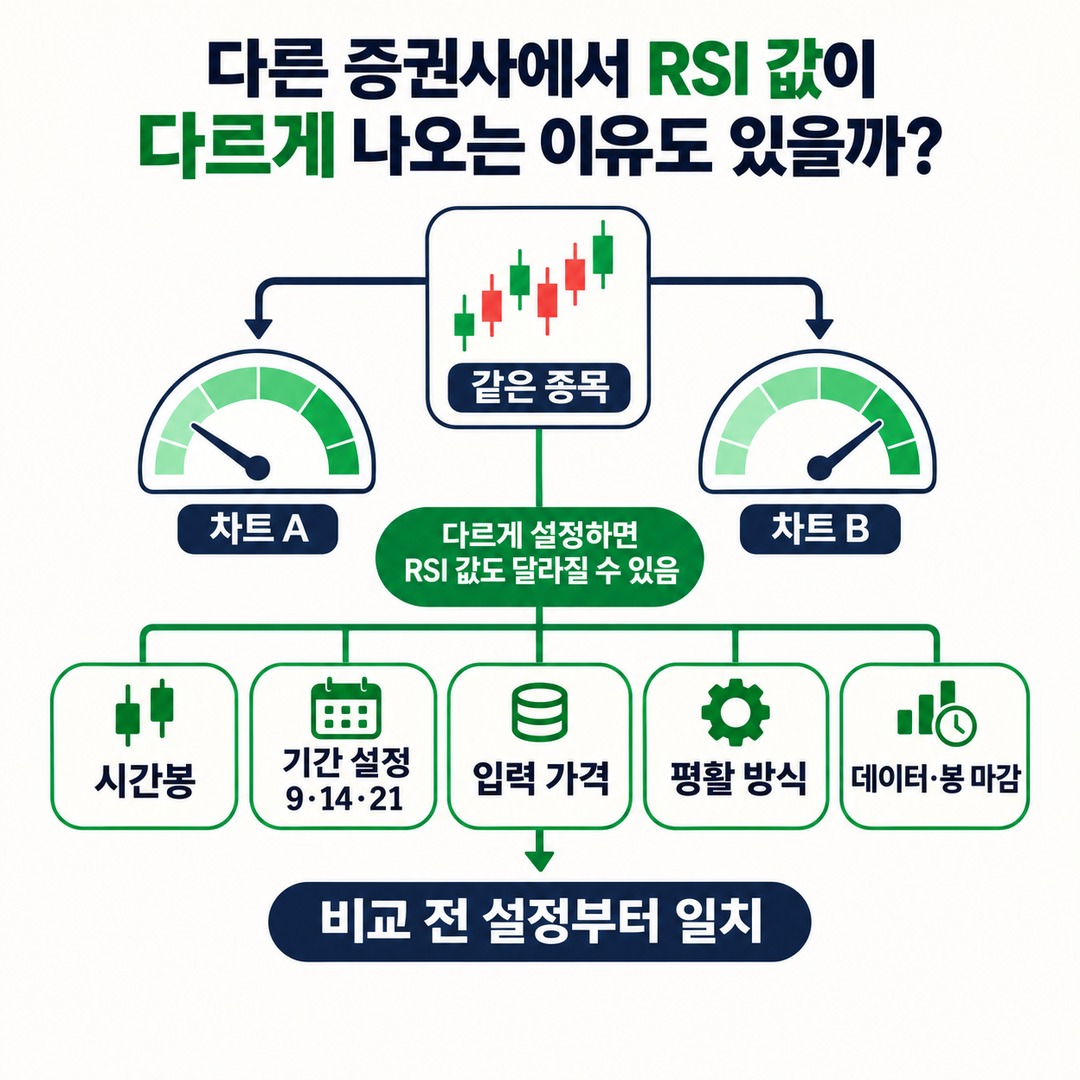
If the RSI readings differ between a brokerage app and a charting service for the same stock, there is no need to assume immediately that one is simply wrong.
First, compare the following settings:
| Item to check | Possible cause of the difference |
|---|---|
| Chart interval | Differences between daily, weekly, and intraday charts |
| Period setting | RSI 9, 14, 21, and so on |
| Input price | Close, open, high, or low |
| Calculation method | Smoothing method for average gains and losses |
| Data source | Differences in exchange and price data |
| Candle status | Difference between a candle still in progress and a confirmed candle |
Pay particular attention to the calculation method.
RSI is generally calculated as follows:
RSI=100−1001+RS. Here, RS is the average gain divided by the average loss.
TradingView provides an example of RSI calculated using Wilder's smoothing method (RMA) in its official help documentation. The method calculates the initial average, then incorporates the previous average and the latest price change. TradingView
So even when the label shows RSI(14), the reading can differ if the detailed inputs and calculation settings are different.
When comparing charts, match the chart interval and settings as well as the RSI reading.
3 things to keep in mind before checking RSI 70
To wrap up, here are the points about RSI that are easiest to misunderstand.
First, RSI 14 does not always mean 14 days.
It means 14 candles on the selected chart.
Second, daily and weekly RSI show different information.
Daily RSI reflects relatively short-term price movements, while weekly RSI reflects a longer period.
Third, RSI 70 is not an automatic sell order.
An overbought reading means recent upward pressure has been strong; it does not mean the stock price must fall.
RSI is a secondary indicator for interpreting price movements. Investment decisions should also take into account price trends, trading volume, company earnings, and market conditions.
RSI alone cannot determine when to buy or sell, or guarantee a profit.
※ This article is for reference to help readers understand market movements and is not a recommendation to invest in any specific stock or asset. You are responsible for your own final decisions and investments.
This post contains Coupang Partners affiliate links. We may earn a commission from qualifying purchases.