

Wyckoff Spring: How Is It Different from a Support Breakdown? From Confirming the Rebound to Setting a Stop-Loss
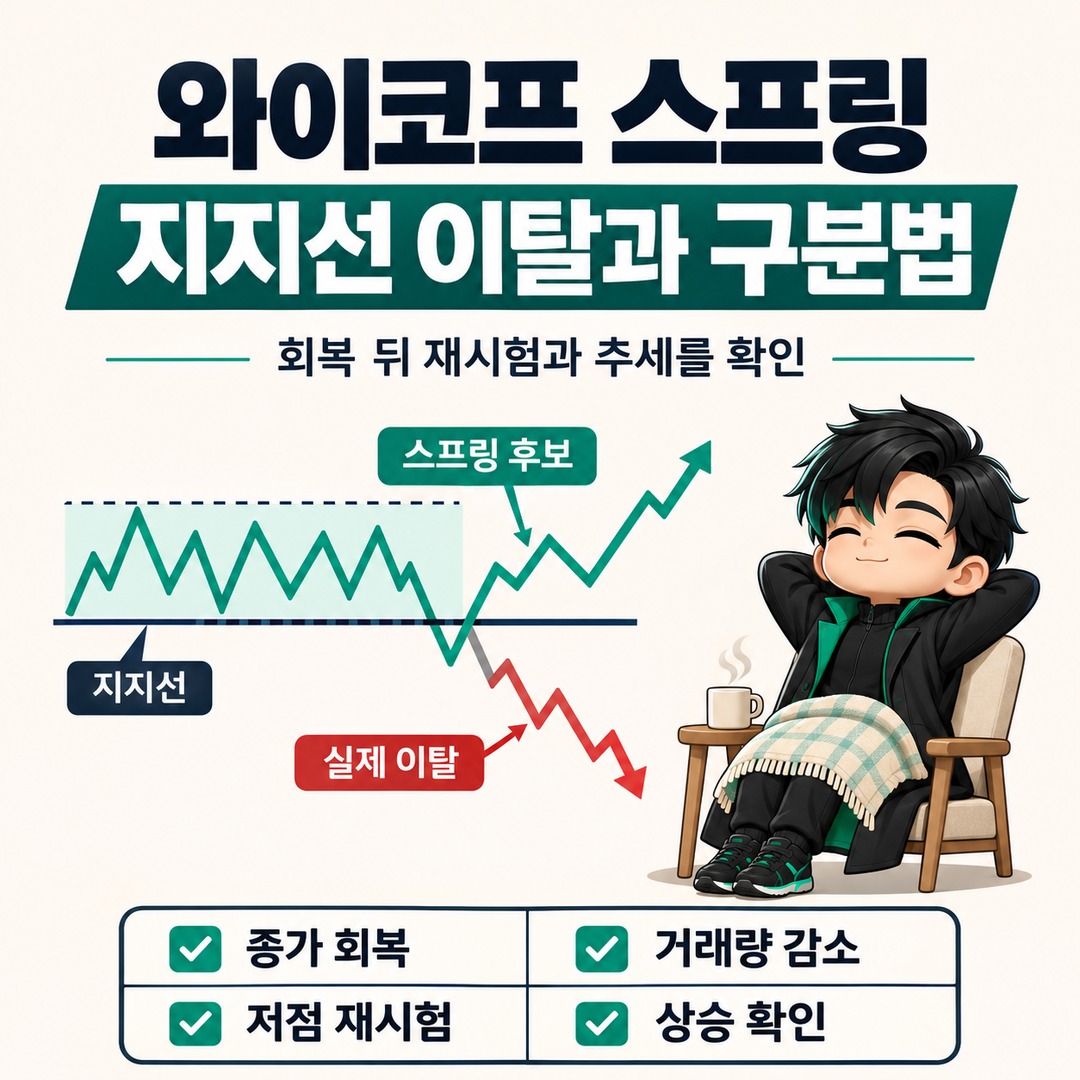
A Wyckoff Spring is a move in which a stock briefly falls below support in a trading range and then recovers. But the fact that it broke support and rebounded does not, by itself, confirm a buy signal. The key is whether a Test with declining volume follows the recovery of support, and whether an upward trend can be confirmed.
To distinguish a Spring from an actual breakdown, look at the closing price, volume, price range, and the result of the Test together, rather than focusing only on how far the price fell below support.
Rather than setting a stop-loss simply at a fixed percentage below support, it is more reasonable to base it on whether the Spring low breaks and the loss amount relative to your entry price.
A Wyckoff Spring Is Different from a Typical Support Bounce
A Wyckoff Spring occurs when a stock briefly breaks below the lower support of an Accumulation Trading Range formed over a period of time, then returns to the range.
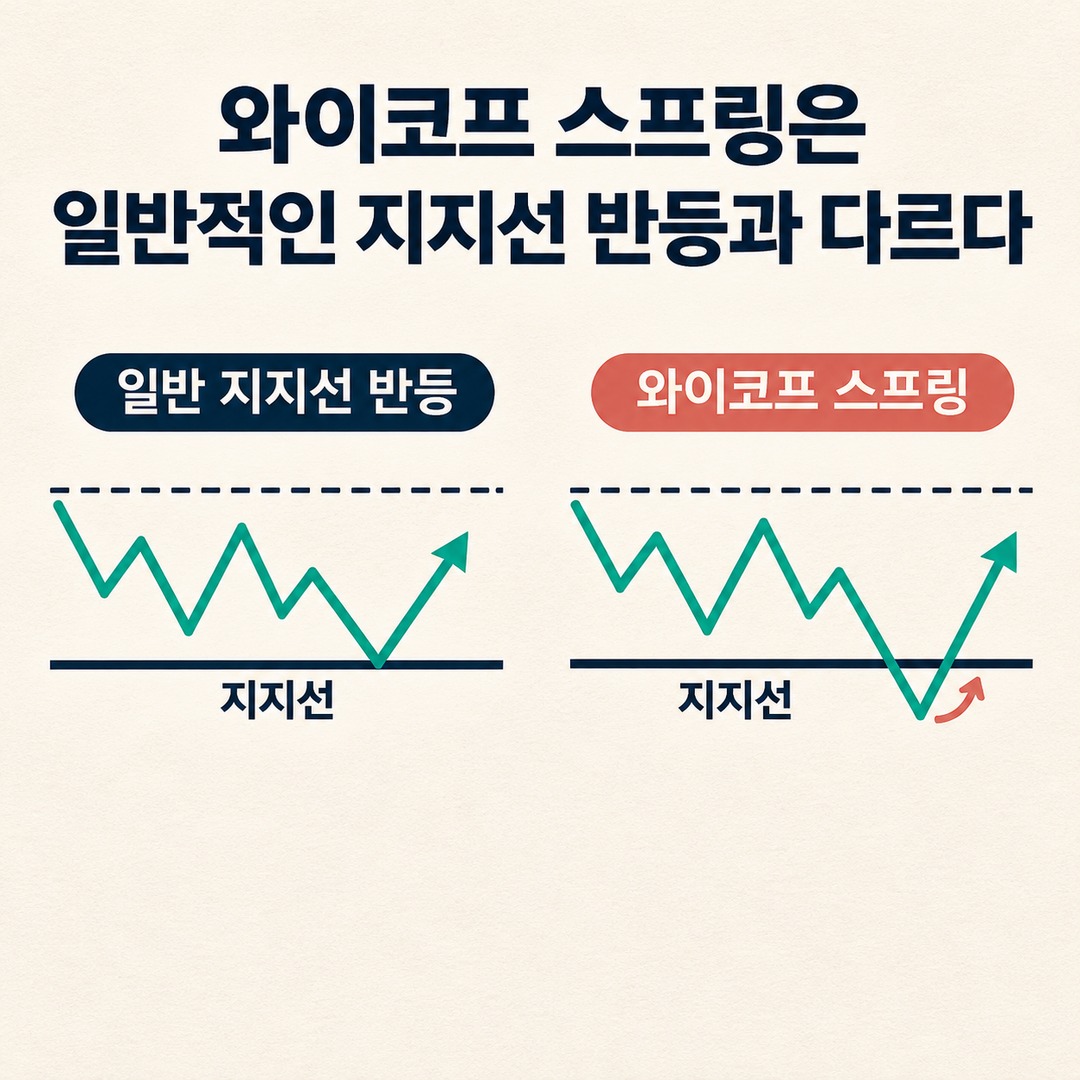
A typical support bounce is a move upward after the price touches or approaches support. A Spring differs in that the price falls below support before recovering.
Key Terms Used in Wyckoff Analysis
Trading Range (TR): A sideways range in which a stock moves within a defined price band
Support: A price area where buying pressure comes in and limits further declines
Spring: A move that breaks below the lower boundary of a trading range and then recovers back into it
Test: The process of checking whether additional selling emerges near the low after a Spring
SOS (Sign of Strength): An upward move showing that buying pressure has strengthened
LPS (Last Point of Support): The final support point where support is confirmed during a pullback after an advance
The important point is that accumulation does not necessarily require a Spring to occur.
StockCharts’ Wyckoff analysis materials also explain that an accumulation structure can form without a Spring. Therefore, a Spring alone should not be taken as confirmation that accumulation is complete or that the trend has reversed upward.
4 Conditions for Determining Whether It Is a Genuine Spring
It is useful to check the following four conditions in order when assessing the reliability of a Spring.
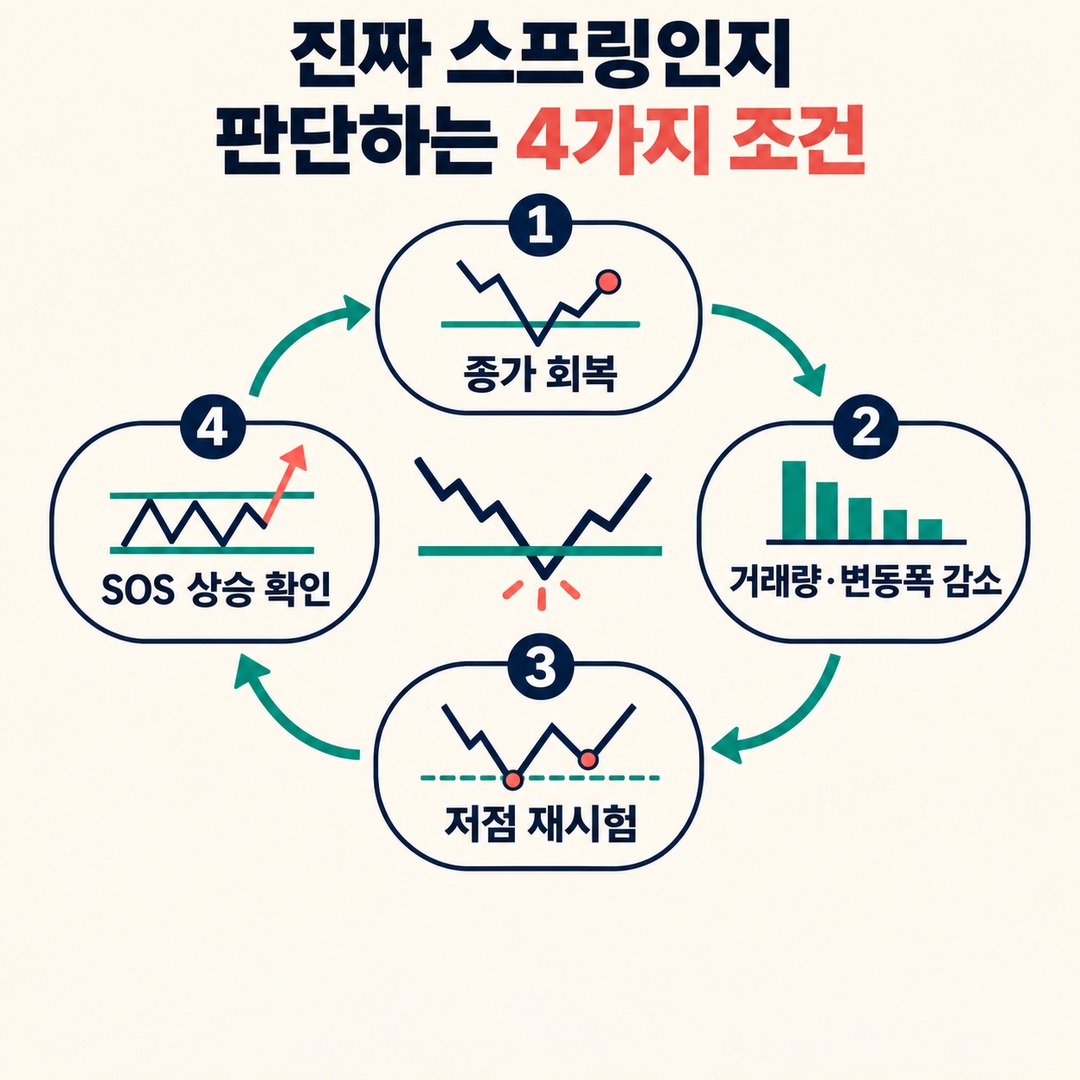
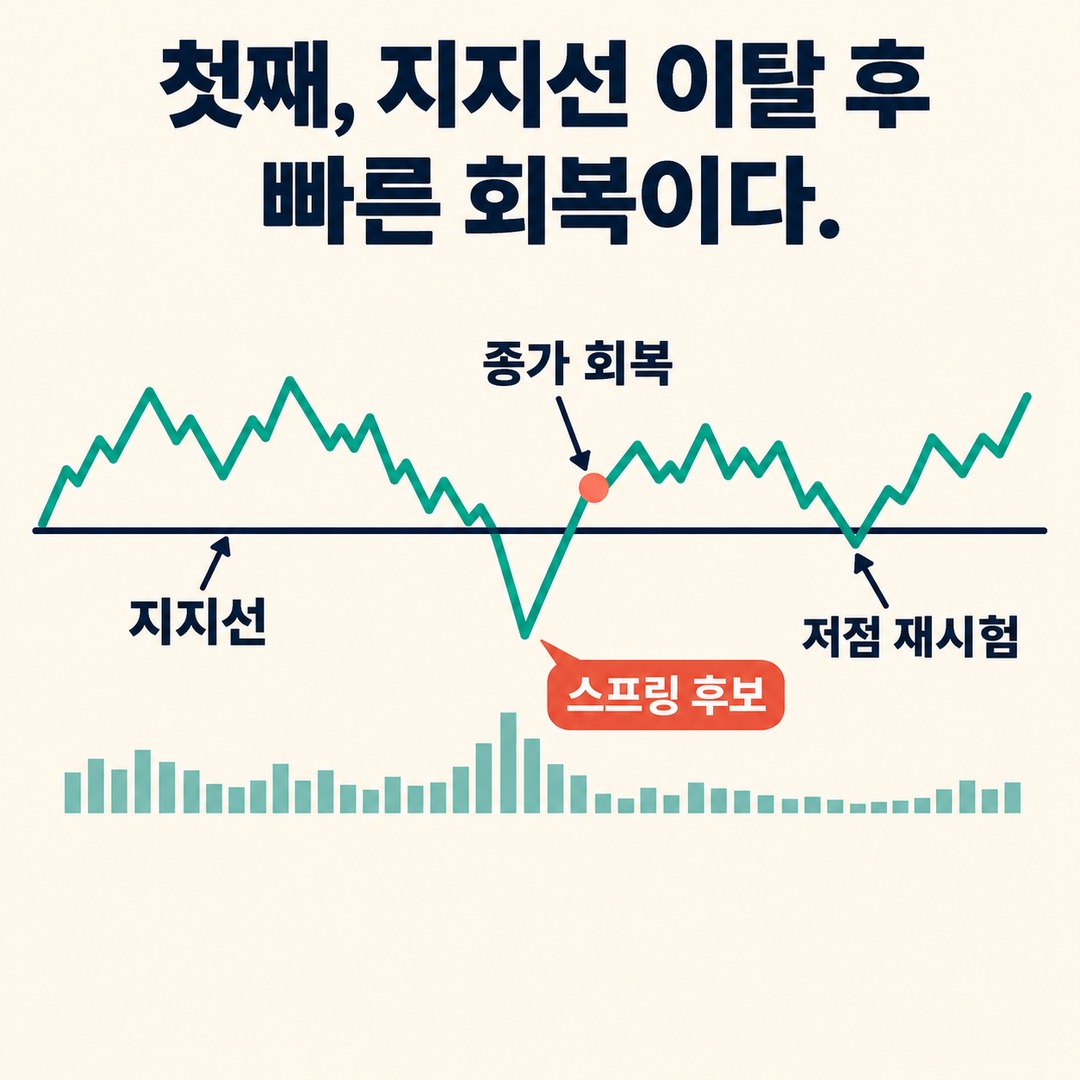
1. Does the price fall below support and then recover by the close?
The first condition is that, after breaking below support, the price returns to the previous trading range.
If the price briefly recovers above support intraday but closes below it again, it is still difficult to classify the move as a Spring.
Conversely, if the price breaks below support intraday but buying pressure comes in and it closes above the previous support level, it can be monitored as a potential Spring.
However, it is important not to make a judgment based on a single day’s recovery.
2. Does selling pressure ease as the price approaches support?
The second factor is volume and the size of price moves.
In Wyckoff analysis, narrowing price swings and declining volume as the price approaches and breaks below support are viewed as favorable conditions for a Spring.
This involves watching whether the additional selling below support is relatively limited.
However, low volume does not necessarily mean selling pressure has been exhausted. Trading activity itself may be insufficient to sustain a rebound.
Therefore, accumulation should not be confirmed based on volume alone.
3. Does the low rise during the Test after the Spring?
The third factor is the Test.
Even if the stock rebounds after a Spring, an uptrend does not necessarily begin right away. The price may return to the area around the Spring low to check how much selling pressure remains.
The following are signs that may be viewed favorably.
The Test low is higher than the initial Spring low.
Volume during the Test is lower than during the initial decline.
Price swings gradually narrow.
The stock rises again after the Test.
Conversely, if volume surges during the Test and the price breaks below the initial Spring low again, the original bullish thesis should be reassessed.
4. Does an SOS appear during the subsequent advance?
The final factor to check is SOS (Sign of Strength).
An SOS is an upward move that shows buying pressure taking the lead. In general, the advance is accompanied by wider price swings and increased volume.
A move that breaks through the midpoint resistance or the upper boundary of the previous trading range can further support the Spring interpretation.
Wyckoff analysis explains that an SOS appearing after a Spring can help confirm the initial Spring assessment.
However, until an SOS appears, this is only a stage of watching for the possibility of a rebound; it is difficult to say that an uptrend has been confirmed.
How Can You Tell a Spring from an Actual Support Breakdown?

The biggest difference between the two is how the market responds after support is breached.
| Category | Potential Spring | Potential Actual Breakdown |
|---|---|---|
| Support break | Temporary break | Sustained break to the downside |
| Closing price | Returns above support | Closes below support |
| Volume during decline | Tends to decrease | Tends to increase |
| Price swings | Tend to narrow | Tend to widen |
| Test | The low may rise | The rebound may fail |
| Subsequent movement | An SOS may appear | Former support may act as resistance |
This table compares typical features in Wyckoff analysis; these are not absolute rules that appear the same way in every stock.
In particular, distinguish between the following two situations.
First: A quick recovery after a break below support.
If the price falls below support but closes back inside the range, and selling pressure eases during a subsequent retest of the low, the move may be viewed as a potential Spring.
Second: A rebound after a break below support that fails to recover the level.
If the stock rebounds to its former support level but selling pressure strengthens there and the price falls again, consider the possibility of an actual breakdown.
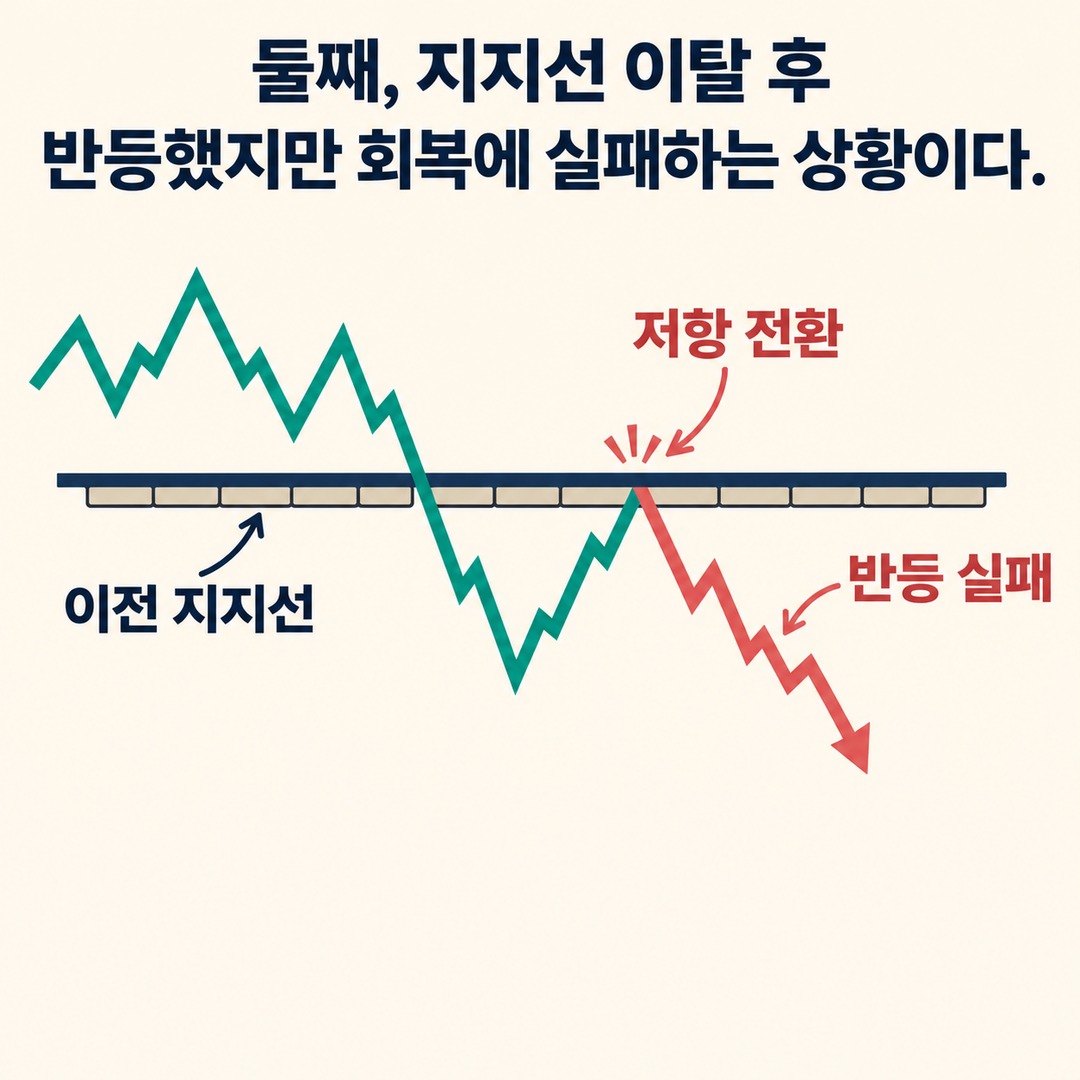
In Wyckoff analysis, the second situation is explained as a shift in which former support turns into resistance. This is called a Rally Back to the Ice after a downside break from the Ice area.
Therefore, it is risky to call a move a Spring simply because it rebounded.
Where Should You Actually Set the Stop-Loss Price?
When setting a stop-loss for a Spring trade, the first price to examine is the initial Spring low.

The Spring low is the lowest price formed below the previous support level. If this price is breached, the basis for the Spring analysis weakens.
However, setting a stop order exactly at the Spring low is not suitable in every situation.
The following three methods can be considered separately.
Method 1. Set the stop-loss level below the Spring low
If the Spring low is KRW 97,000, that price can serve as the invalidation level for the analysis.
When placing an actual order, consider price volatility, the bid-ask spread, and the possibility of a sharp decline.
If the stop-loss price is set too close to the low, a temporary price fluctuation may trigger an exit.
Method 2. Use the Test low as the reference point
If a higher low forms during the Test after the initial Spring, that Test low is also an important point to watch.
For example, if the initial low is KRW 97,000 and the Test low is KRW 98,000, the price action between those two levels should be assessed separately.
A break below the Test low does not necessarily mean the initial Spring has failed. However, check whether selling pressure is increasing again.
Conversely, if the price breaks below the initial Spring low, the key evidence supporting the bullish thesis is undermined.
Method 3. Calculate the stop-loss price and investment amount together
If you set a stop-loss price without deciding on the investment amount, the actual loss could be larger than expected.
Consider a hypothetical calculation using these figures.
Hypothetical example · Not the price or trading result of an actual stock
Previous support: KRW 100,000
Initial Spring low: KRW 97,000
Test low: KRW 98,000
Entry price after confirmation: KRW 101,000
Assumed stop-loss price: KRW 96,500
Author’s calculation:
101,000−96,500=KRW 4,500The loss risk per share is KRW 4,500.
The loss risk as a percentage of the entry price is calculated as follows.
4,500101,000×100≈4.46%If the maximum loss you are willing to accept on a single trade is KRW 450,000, excluding trading fees and taxes, the number of shares you can buy is calculated as follows.
450,0004,500=100 sharesIn other words, under these assumptions, 100 shares is the calculated maximum quantity.
In actual trading, fees, taxes, slippage, and differences in execution price due to a gap down may arise, so the actual loss could exceed the calculated amount.
The key point of this calculation is not to choose a stop-loss level arbitrarily after buying, but to first set the price at which the analysis is invalidated and then determine the position size accordingly.
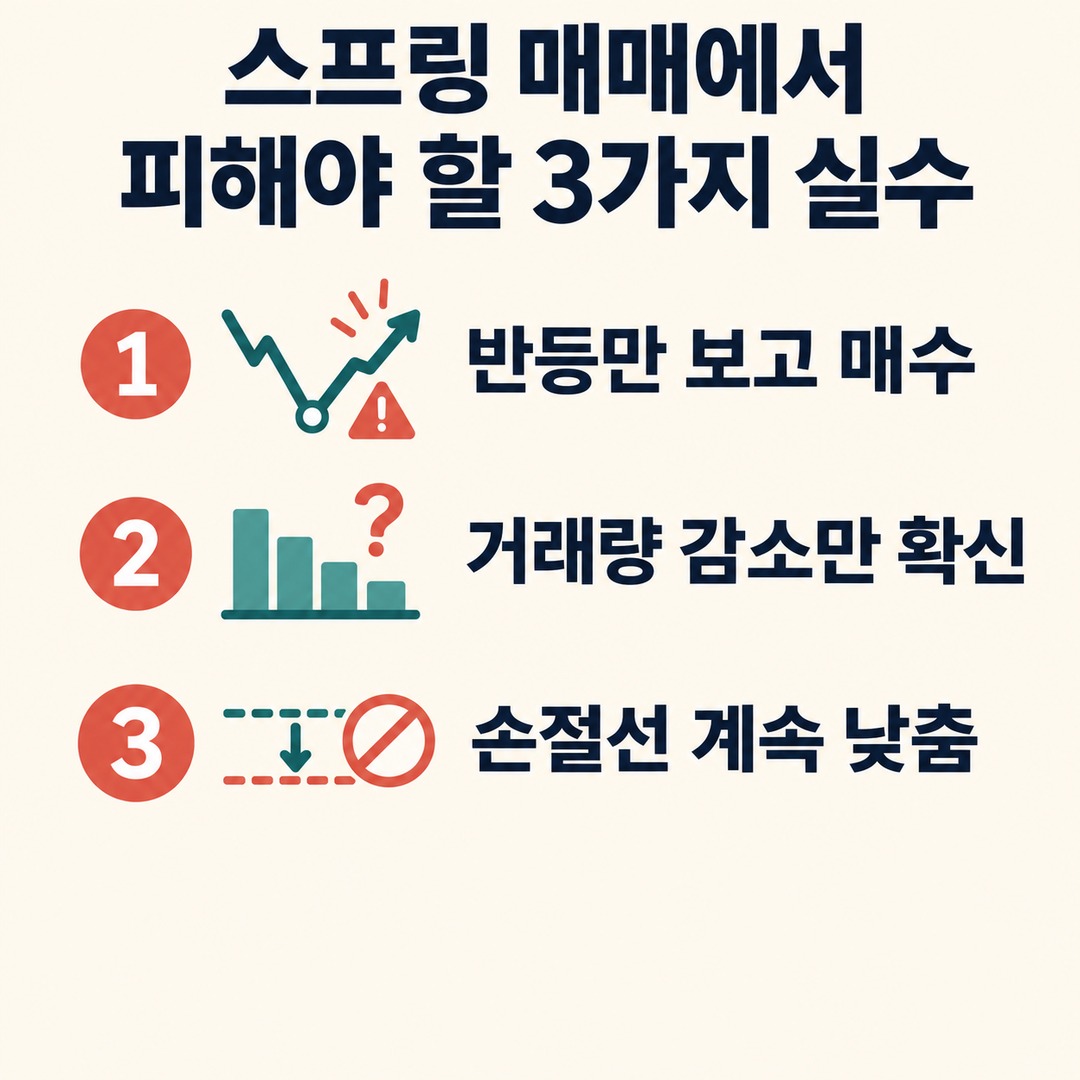
3 Mistakes to Avoid When Trading Springs
Buying just because the price rebounded after breaking support
A Spring depends not only on a recovery above support, but also on the subsequent Test and changes in supply and demand.
A single rebound is not enough to conclude that an uptrend has begun.
Mistaking declining volume alone for proof of accumulation
Declining volume may be a clue that selling pressure is easing, but it may also mean that trading activity is low.
Check price swings, the closing price, and the Test results together.
Repeatedly lowering the stop-loss after entering a trade
If the Spring low set in the initial analysis breaks but you keep lowering the stop-loss price, the basis for the trade changes.
It is important to recognize that the original analysis may have been wrong and manage the loss.
A Practical Checklist for Reading the Chart
When analyzing a Wyckoff Spring, review the chart in the following order.
1. Mark the upper and lower boundaries of the range that traded sideways over a period of time.
2. Check whether the price fell below the previous lower support level.
3. Check whether the closing price recovered back into the trading range.
4. Compare volume and price swings as the price approached and broke below support.
5. Watch whether the Test ends at a price above the initial Spring low.
6. Check whether an SOS appears after the Test.
7. Use the initial Spring low to calculate the price that would invalidate the analysis and the potential loss amount.
Following this sequence can help distinguish a simple technical rebound from the typical structure of a Wyckoff Spring.
Frequently Asked Questions — Q. Does a Spring mean the price will definitely rise?
No. A Spring is a technical pattern used to assess the possibility of a rise, not a signal that guarantees future stock prices. The analysis may fail if selling increases during the Test or the Spring low breaks.
Q. Must volume decline when a Spring occurs?
Not necessarily. In a typical, high-quality Spring, narrowing price swings and declining volume as the price approaches and breaks below support are presented as favorable conditions. It is also important to see whether volume declines during the subsequent Test. However, volume patterns can vary depending on market conditions.
Q. Should I avoid buying if there is no Test after a Spring?
A Test is an important process for assessing the reliability of a Spring, but it does not necessarily take the same form in every accumulation structure. If there is no Test, consider that there is less evidence available for confirmation.
Q. Should I exit if the price briefly falls below the Spring low intraday?
The decision should depend on the trading time frame and the stop-loss rules set in advance. If you analyze the chart on a daily basis but make decisions based only on intraday prices, the signals may conflict. Conversely, if you have set an intraday stop-loss rule, waiting until the daily close is not always appropriate.
The key to identifying a Wyckoff Spring is not simply that the price fell below support and then recovered.
Check whether the sequence of recovery above support → easing selling pressure → Test → SOS confirmation unfolds.
Use the initial Spring low as the level that invalidates the analysis, but set the actual order price and position size according to the stock’s volatility and the amount of loss you can afford.
A Spring is not a magic signal that predicts a rebound; it is an analytical method for checking whether selling pressure is easing through price and volume.
※ This article is for informational purposes to help readers understand market movements and is not a recommendation to invest in any particular stock or asset. You are responsible for your final decisions and investments.