

Why Are U.S. Stocks Weak in September? How to Assess Whether the S&P500 'September Effect' Will Hold in 2026

The 'September effect' in U.S. stocks is supported by long-term historical data, but it does not mean stock prices inevitably fall in September. Since 1928, the S&P500 has recorded an average September return of approximately -1.1%, indicating weaker performance than in other months. However, in September 2026, Treasury yields, oil prices, and Federal Reserve (Fed) decisions are more likely to determine the market's actual direction than seasonality alone.

As the stock market, which had remained strong through August, began to fluctuate in September, a familiar question resurfaced: 'Is September traditionally a month when stocks decline?' What matters is not treating historical averages as trading signals, but understanding why this pattern emerged and whether the same conditions apply this year.
Has September Really Been the Weakest Month for the S&P500?
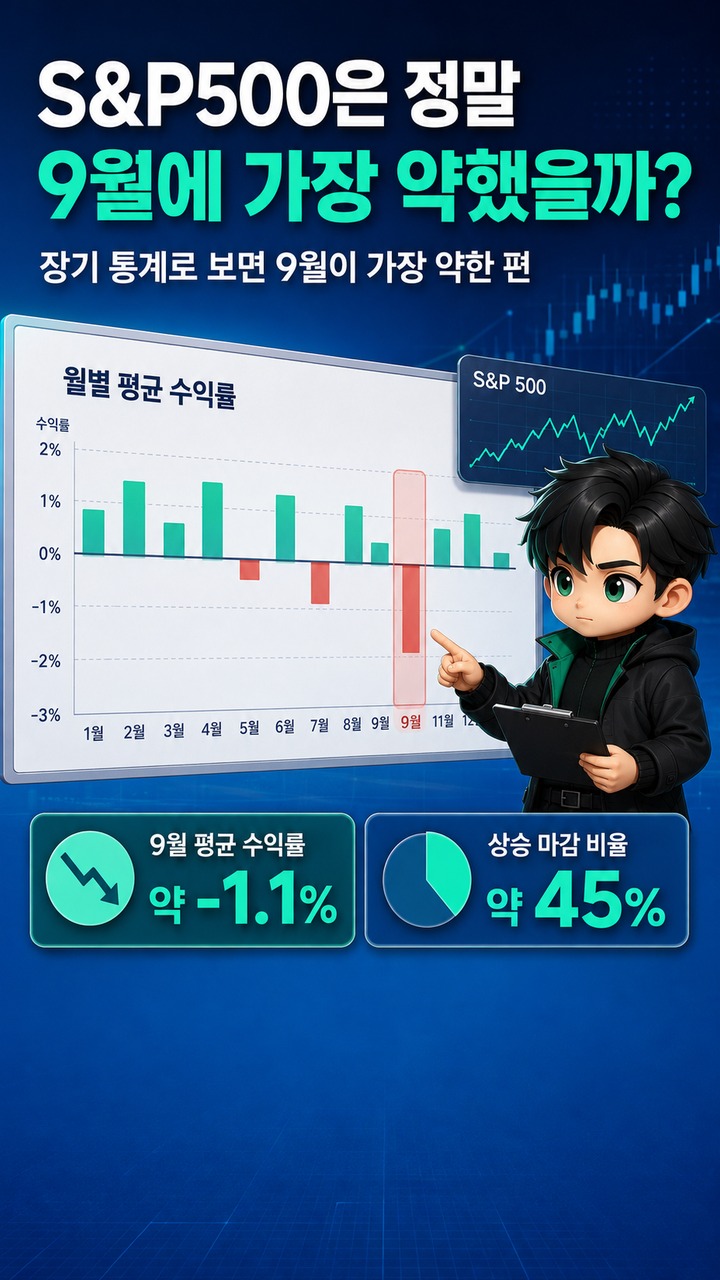
According to long-term statistics, yes. Some historical calculations show that since 1928, the S&P500 has delivered an average September return of approximately -1.1%, with positive monthly returns occurring only about 45% of the time. In other words, historically, there have been slightly more declining September periods than rising ones.
However, there is an important distinction to make first.
An average return of -1.1% does not mean stocks fell by 1.1% every September.
A few years with particularly large declines can pull down the average, while the actual range of monthly returns is quite wide. J.P. Morgan Wealth Management also explains that although the long-term seasonal weakness of September is evident, outcomes vary substantially from year to year, meaning seasonality should not be treated as a market forecast.
Therefore, the 'September effect' is more accurately understood as a seasonal tendency repeatedly observed in historical data rather than a definitive rule.
Why Did September Gain a Reputation for Weak Stock Performance?
No single cause has been conclusively established. Market participants point to several possible contributing factors, including the normalization of trading activity after summer, portfolio adjustments, fiscal year-end schedules at certain institutions, and overlapping macroeconomic events.
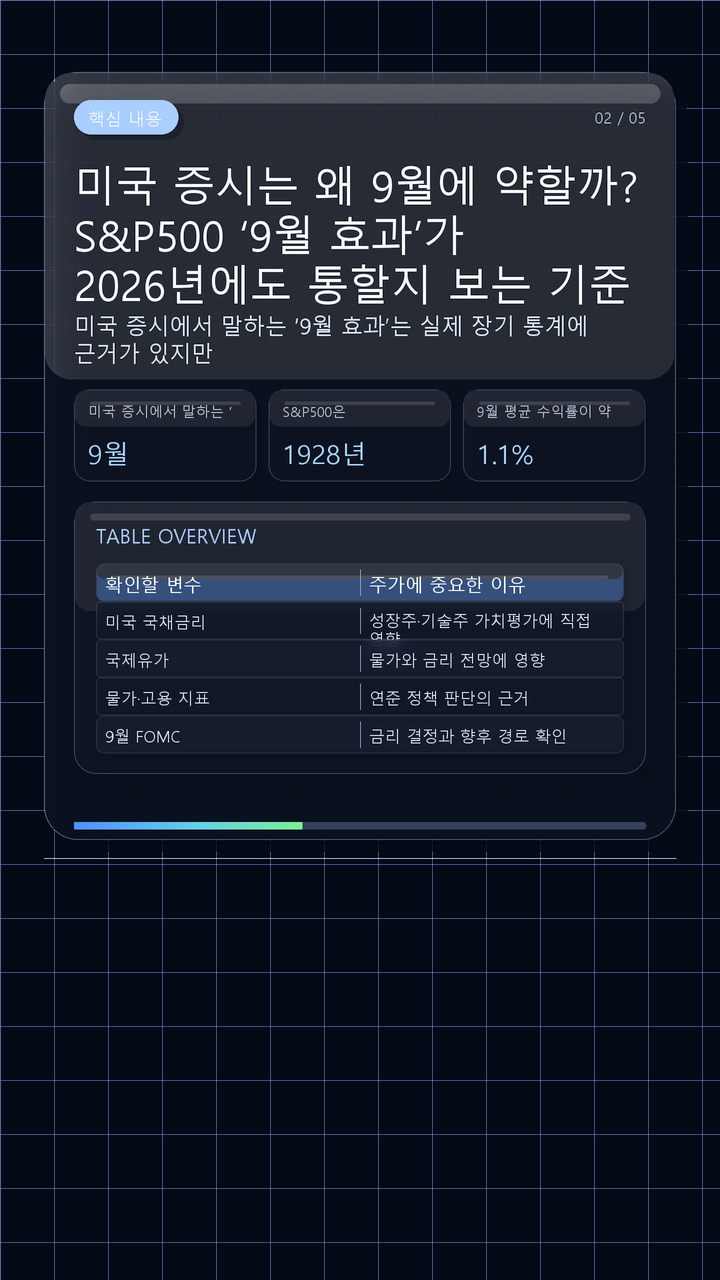
For example, when the summer vacation season ends, institutional investors and fund managers often rebalance their portfolios. If many investors simultaneously reduce their exposure to stocks that have already risen substantially or sell underperforming holdings, short-term selling pressure can increase.
Some mutual funds also use September as the end of their fiscal year. CME Group identifies the selling of losing positions by these funds ahead of their fiscal year-end as one possible explanation for selling pressure in September.
However, these explanations do not constitute a formula guaranteeing a September decline. J.P. Morgan notes that multiple factors, including liquidity, macroeconomic conditions, and corporate earnings expectations, influence market performance differently each year.
Should Investors Sell Before September and Buy Back Later?
Selling stocks at the end of August and buying them back after September based solely on historical averages is less straightforward than it might appear.
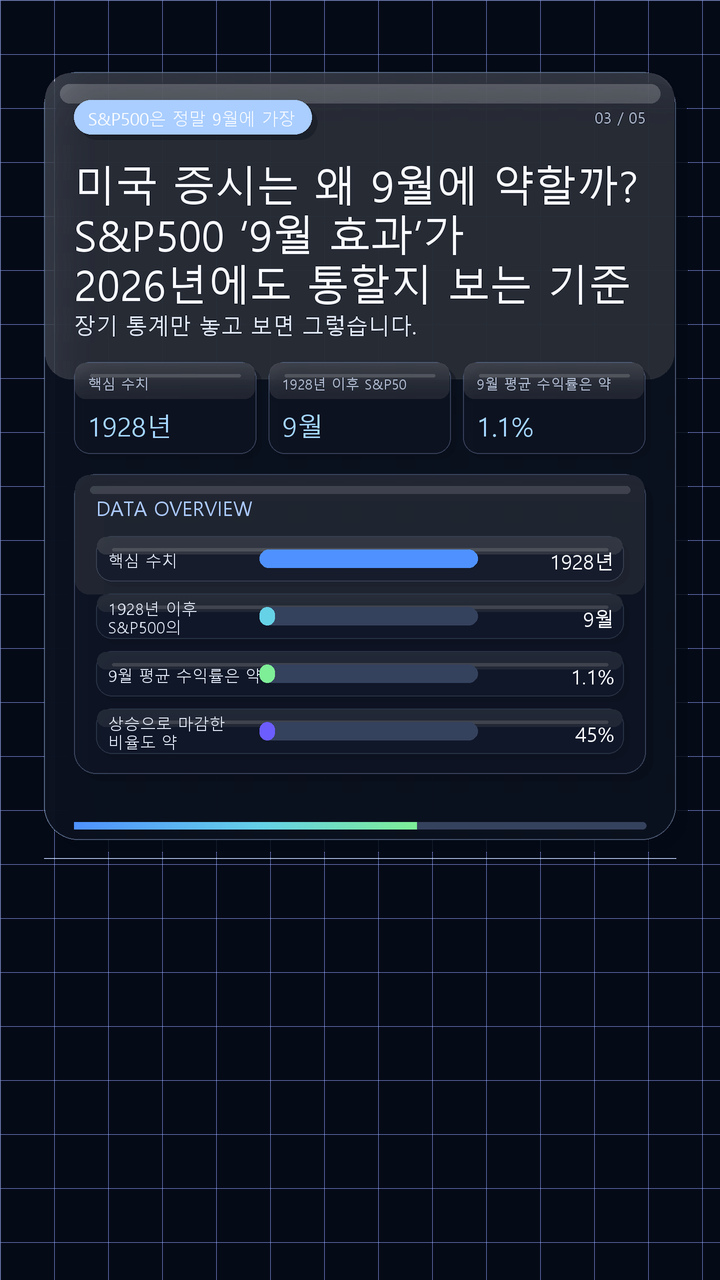
The reason is that even within a month that has historically been weak on average, the market has risen in a considerable number of years. The S&P500's historical positive-return frequency of approximately 45% in September means, conversely, that September has ended with gains in nearly half of the observed years.
Selling and subsequently reentering the market requires two correct decisions.
The first is deciding when to sell, and the second is deciding when to buy again. Once taxes, transaction costs, and exchange rates are considered, the returns experienced by South Korean investors may also differ from the U.S. index's monthly performance.
Rather than determining buying and selling dates based solely on the September effect, it is more practical to review your investment horizon, cash requirements, and asset allocation first. J.P. Morgan similarly recommends evaluating investment horizons, liquidity needs, and portfolio allocations instead of reacting impulsively to seasonal patterns.
Why Historical Averages Alone Are Not Enough in September 2026
In 2026, factors more immediate than seasonality have already begun influencing the market from the first trading day of September.
In the U.S. market on September 1, the S&P500 fell 0.7%, the Dow Jones Industrial Average declined 0.8%, and the Nasdaq Composite dropped 1.0%. International oil prices and U.S. Treasury yields rose on the same day, renewing concerns about inflation and interest-rate pressures.
Interest rates are particularly important. When the yield on 10-year U.S. Treasury securities rises, the present value of future earnings declines. As a result, technology stocks whose valuations reflect high growth expectations may react more sensitively.
Oil prices matter as well. If higher oil prices persist, they can place renewed pressure on corporate costs and consumer prices. Investors then interpret those effects in relation to the Federal Reserve's interest-rate decisions.
In other words, attributing every market fluctuation in September 2026 to the fact that 'it is September' risks overlooking the factors actually driving the market.
Why the September 15–16 FOMC Meeting Matters
The Federal Open Market Committee (FOMC) meeting in September 2026 takes place September 15–16. According to the Federal Reserve's official schedule, a policy decision and press conference are scheduled for 16, and economic projections will also be released at this meeting.
Investors are not simply watching whether the Fed raises or lowers interest rates.
Equally important are how the Fed assesses inflation, its outlook for economic growth and employment, and the signals it provides about the future path of interest rates.
Therefore, it is worth monitoring the following developments together through mid-September.
| Factor to Monitor | Why It Matters for Stock Prices |
|---|---|
| U.S. Treasury yields | Directly affect valuations of growth and technology stocks |
| International oil prices | Influence inflation and interest-rate expectations |
| Inflation and employment indicators | Provide the basis for Federal Reserve policy decisions |
| September FOMC | Provides insight into interest-rate decisions and the future policy path |
No single indicator can definitively determine the market's direction. Even the same economic data can produce different market reactions depending on prevailing stock valuations and how much investors have already priced into their expectations.
The 'September Effect' Is Not Guaranteed to Repeat in 2026
There is also evidence supporting a different outcome.
The S&P500 closed at 7,686.14 at the end of August 2026, standing considerably above its 200-day moving average of 7,122.92. Some historical analyses have also suggested that market outcomes differed depending on whether the S&P500 began September above or below its 200-day moving average.
The S&P500 also demonstrated strong momentum in August, rising 2.6% over the month. Therefore, using the historical 'average September decline' alone to predetermine the outcome for 2026 would be an oversimplification.
Ultimately, the central question for September 2026 is not 'Do stocks fall because it is September?' but rather something closer to this:
Are current changes in interest rates, oil prices, and Federal Reserve policy having a stronger influence than historical seasonal weakness?
The answer to that question may continue to change throughout the month.
Three Distinctions to Make When Evaluating the Stock Market in September
First, seasonality is a statistical pattern, not a prediction. The fact that average returns in September have historically been low does not mean the market must also decline in September this year.
Second, investors should also examine the factors actually moving the current market. In early September 2026, rising Treasury yields, higher oil prices, inflation concerns, and the FOMC are all important influences.
Third, using seasonality alone to determine trading dates is risky. Long-term statistics can provide useful context for understanding markets, but they neither guarantee individual investment returns nor identify specific buying or selling opportunities.
The most accurate way to understand the September effect is not to assume that 'September is always weak,' but to recognize that 'although this month has historically been weak, investors must separately determine whether the same factors are influencing the market this year.'
※ This article is provided for informational purposes to help readers understand market trends and does not constitute investment advice or a recommendation to buy or sell any particular security or asset. Final investment decisions and responsibility rest with the individual investor.