
 ▶
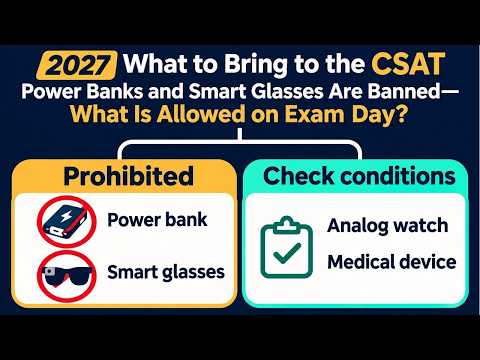
Which Items Can You Bring Into the 2027 CSAT Exam Room?
Can you bring a power bank, an analog watch, or a medical device into the 2027 CSAT exam room? This guide separates proh...
▶
Can you bring a power bank, an analog watch, or a medical device into the 2027 CSAT exam room? This guide separates proh...
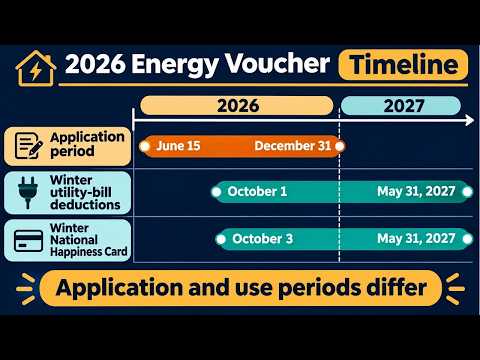 ▶
Who can qualify for the 2026 Energy Voucher, and does the December 31 application deadline also end winter use? This vid...
 ▶
KRX and Nextrade figures can differ because they may cover different trading venues and reporting times. This video show...
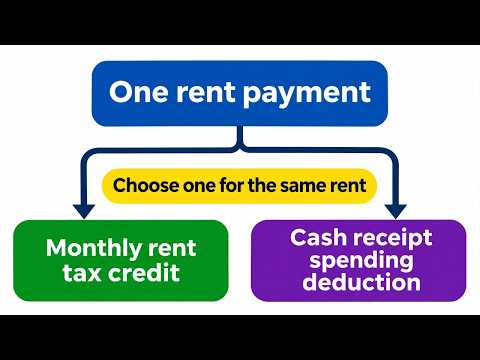 ▶
If you cannot claim Korea’s monthly rent tax credit, you may be able to report rent to the National Tax Service and rece...
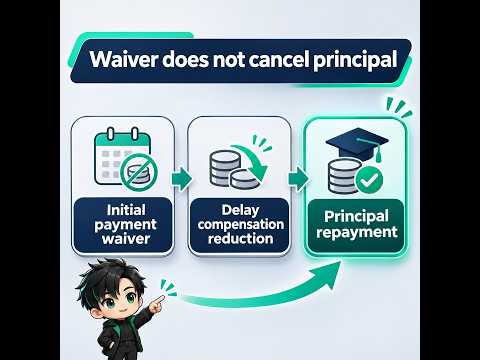 ▶
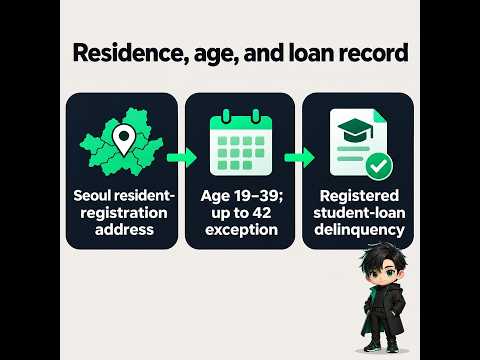
2026 Special Student Loan Debt Adjustment: If the Initial Payment Is Waived, Do You Still Have to Repay the Principal? F...
 ▶
https://neoai.kr/news/article/%EC%84%9C%EC%9A%B8-%EC%B2%AD%EB%85%84-%ED%95%99%EC%9E%90%EA%B8%88%EB%8C%80%EC%B6%9C-%EC%8B...
Registered by: YouTube · YouTube publication: 2026-11-18T19:02:23-08:00