

 ▶
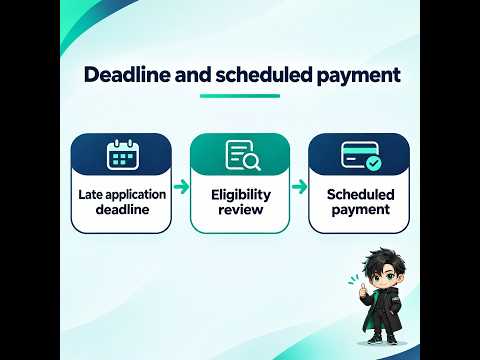
For the Year 2025, If You Apply for the Earned Income and Child Tax Credits in December, Will They…
For the Year 2025, If You Apply for the Earned Income and Child Tax Credits in December, Will They Be Paid on 2027-01-15...
▶
For the Year 2025, If You Apply for the Earned Income and Child Tax Credits in December, Will They Be Paid on 2027-01-15...
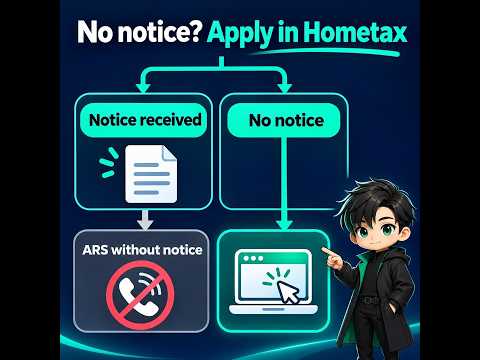 ▶
2025 Tax Year Employment and Child Tax Credits: If You Missed the May Application Period, You Can Apply Directly Until D...
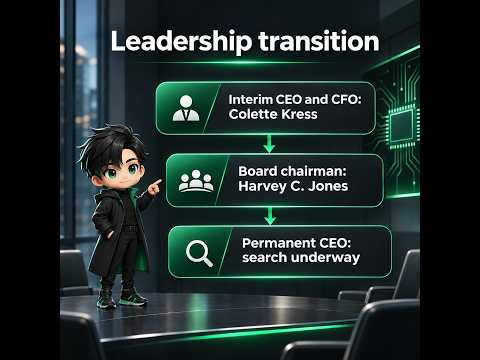 ▶
NVIDIA Earnings After Jensen Huang’s Resignation: AI Chip Demand and CEO Succession Factors to Watch on November 17 Jen...
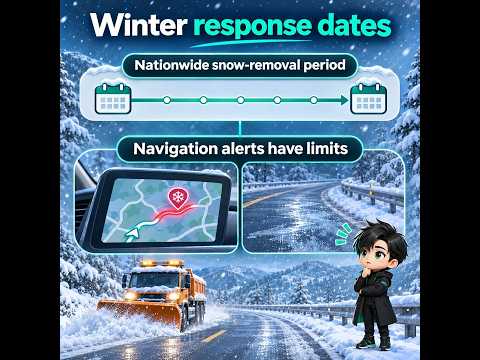 ▶
Winter Road Ice Response Begins November 15: Hazardous Areas to Check on Navigation Apps and Safe Driving Tips The wint...
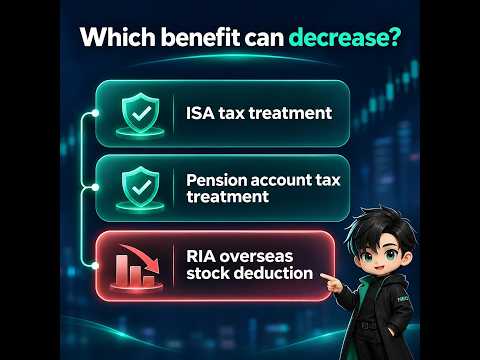 ▶
How Much Do Tax Benefits Decrease If You Buy Overseas ETFs in an ISA or Pension Savings Account While Holding an RIA Acc...
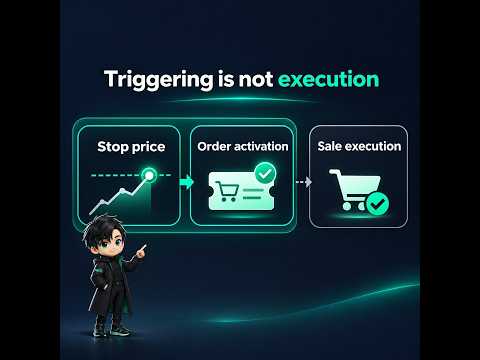 ▶
Why a Stock Stop-Loss Order May Not Fill—and How Market and Limit Orders Affect Your Loss A stock reaching your stop-lo...
 ▶
How to Calculate Share Quantity Based on a Stock Stop-Loss Price: How Many Shares Should You Buy Within Your Account’s L...
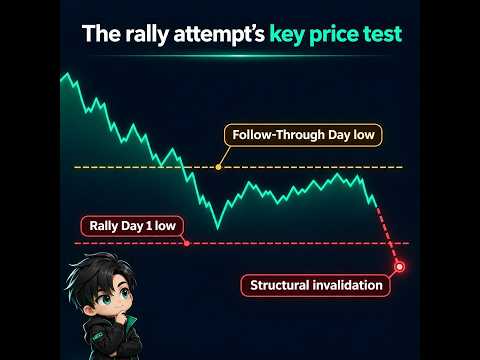 ▶
A Sharp Drop After a CAN SLIM Follow-Through Day: When Is the Uptrend Invalidated? A Follow-Through Day (FTD) in CAN SL...
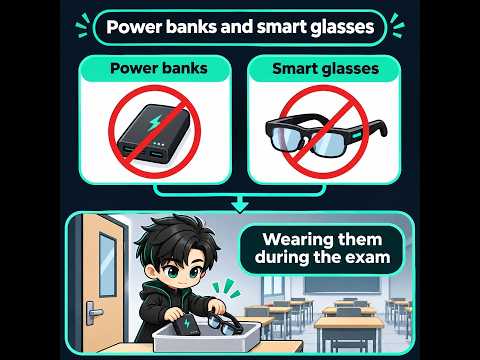 ▶
2027 What to Bring to the CSAT: Power Banks and Smart Glasses Are Banned—What Is Allowed on Exam Day? The 2027 College...
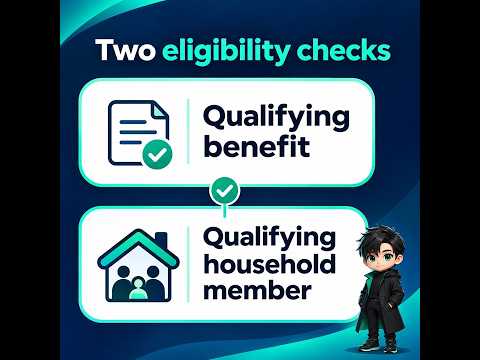 ▶
2026 Energy Voucher Eligibility: Conditions to Check Before the December 31 Deadline The application deadline for the 2...
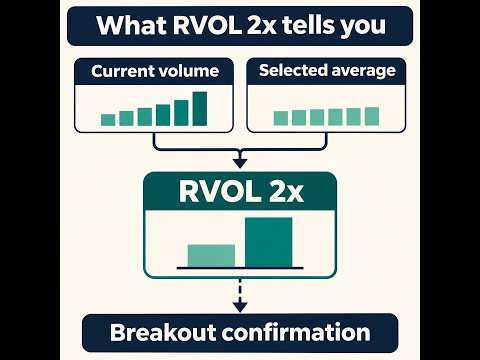 ▶
Is RVOL 2x Enough for a Stock Breakout? How to Compare Volume at the Same Time of Day and Spot False Breakouts An RVOL...
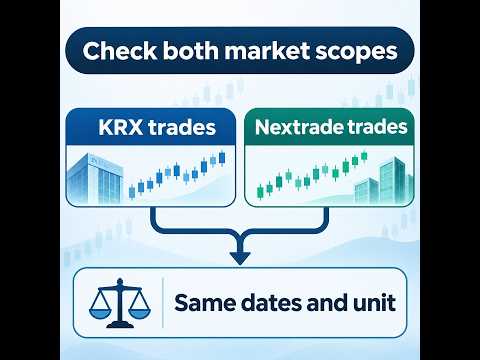 ▶
Samsung Electronics: Why Foreign Net Buying Figures Differ Between KRX and Nextrade, and How to Check For large-cap sto...
Registered by: YouTube · YouTube publication: 2026-11-18T19:26:48-08:00