

How to Read Trendlines, Support and Resistance, and Candlestick Patterns: The Order for Connecting Price Structure to Trading Signals
이 포스팅은 쿠팡 파트너스 활동의 일환으로, 이에 따른 일정액의 수수료를 제공받습니다.
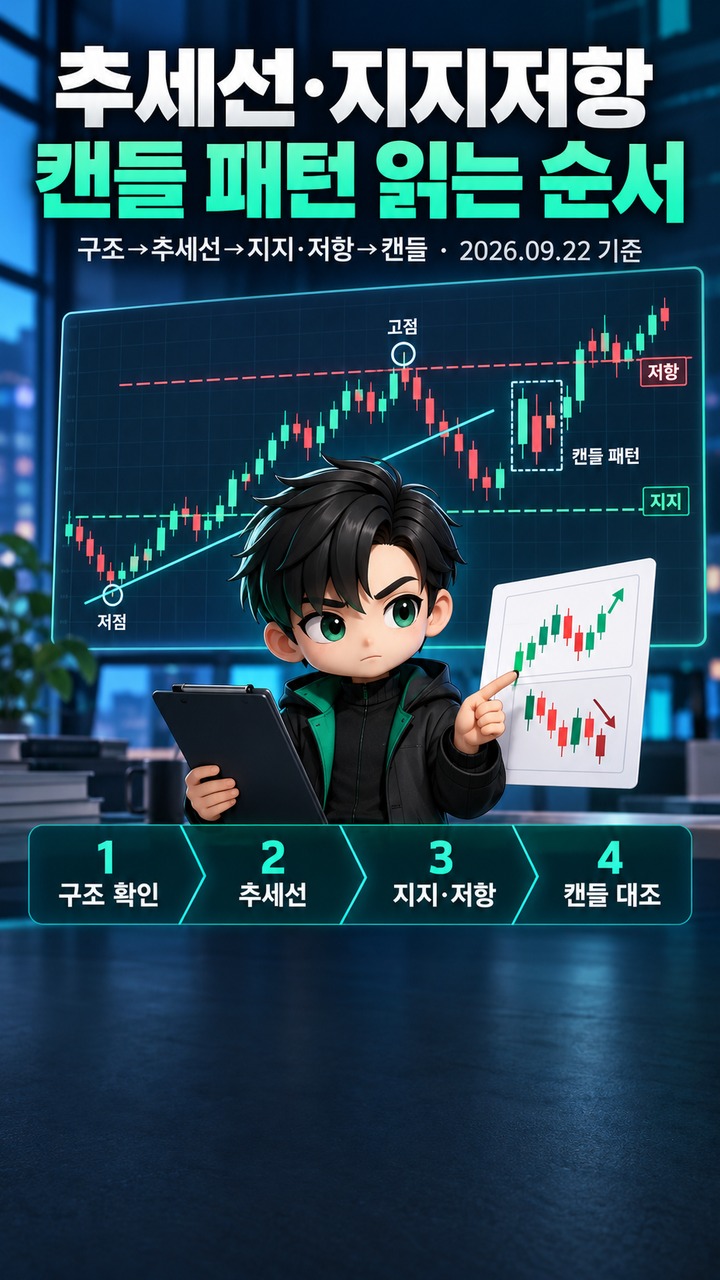
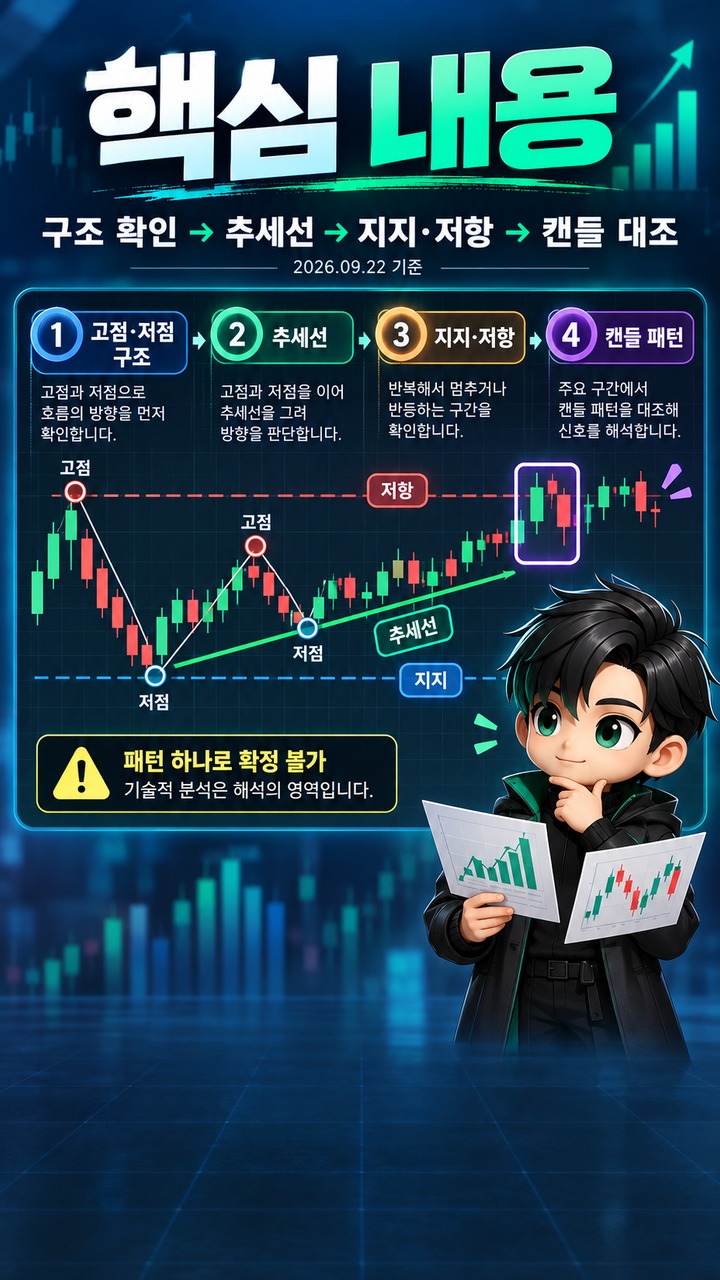
When looking at a chart for the first time, it is easier to understand the market by identifying the direction formed by highs and lows, drawing trendlines and support and resistance levels, and then examining candlestick patterns, rather than focusing on a single candle shape in isolation. As of 2026-09-22, technical analysis involves interpretation, and no single pattern can definitively predict the future direction of prices.
What Can You Learn from a Single Candlestick?
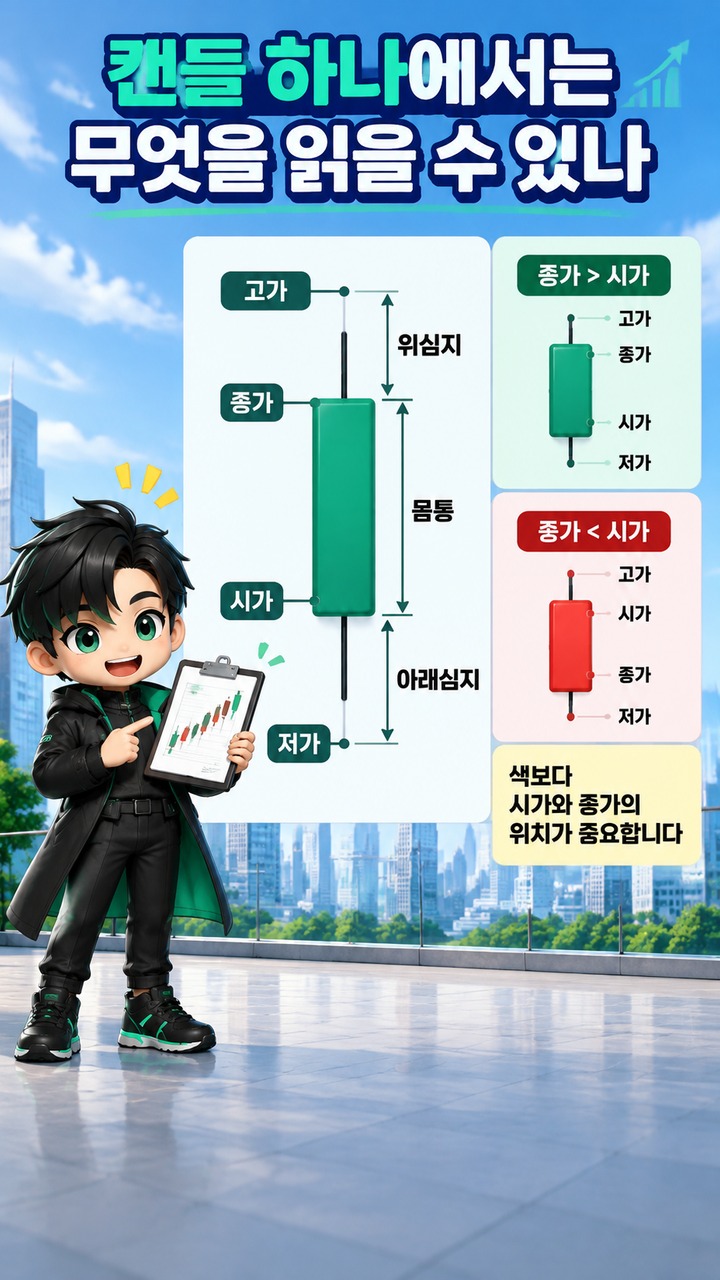
A single candlestick contains the opening, high, low, and closing prices for a specific period. The body represents the range between the opening and closing prices, while the upper and lower wicks show the highest and lowest prices traded during that period. Because charting platforms allow users to change the colors representing rising and falling prices, it is more accurate to examine the positions of the opening and closing prices rather than relying on color alone.
A long body indicates a large difference between the opening and closing prices during that period, while a short body means the two prices were relatively close. Long wicks indicate that prices traded across a wider range beyond the candle's body.
An important consideration here is the candlestick timeframe. The same price movement can appear structurally different depending on whether it is grouped into 5-minute candles, daily candles, or weekly candles. Therefore, before interpreting a candlestick's shape, you should first identify the timeframe of the chart.
Should Trendlines Connect Highs or Lows?
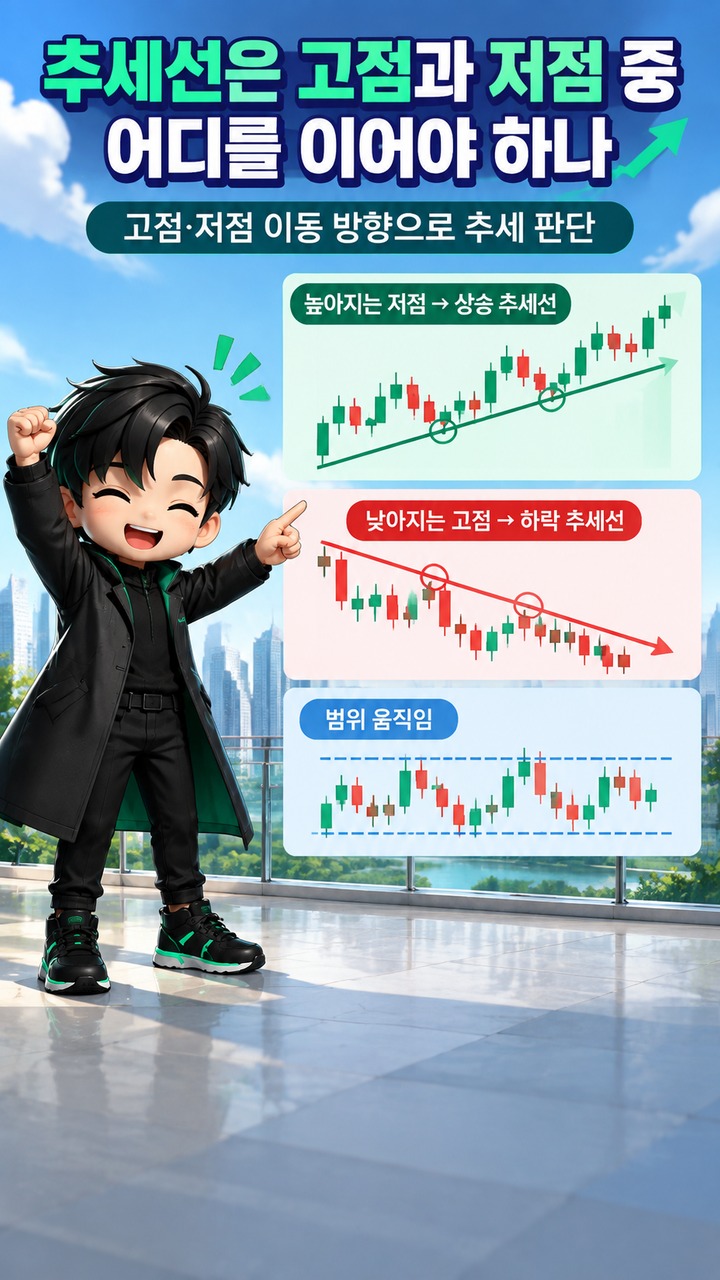
When price lows are progressively rising, an upward trendline can be drawn by connecting those lows. When price highs are gradually falling, a downward trendline can be drawn by connecting the highs. The trend itself can be classified according to whether highs and lows are moving upward, moving downward, or remaining within a relatively stable range.
An uptrend consists of successive higher highs and higher lows, while a downtrend consists of successive lower highs and lower lows. When prices move within a horizontal range, the market can be described as moving sideways.
A trendline can be drawn and extended by connecting two or more price points. However, a price moving below an upward trendline or above a downward trendline does not automatically confirm a trend reversal at that moment. Such a move should be treated as a possible indication that the existing trend may be changing, with other price movements examined for additional confirmation.
Support and Resistance Should Be Viewed as Zones Rather Than Exact Prices
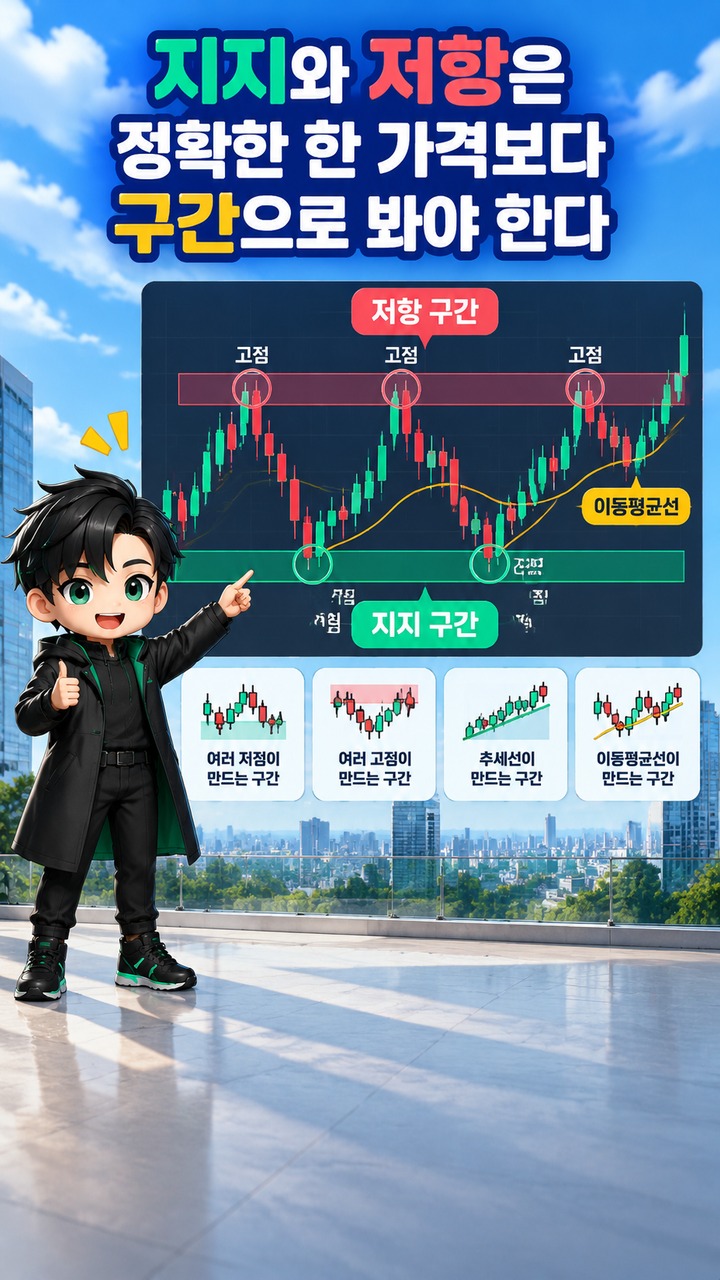
Support refers to a lower price area where a falling price may stop declining or reverse direction. Resistance refers to an upper price area where a rising price may slow down or reverse. Previous highs and lows, trendlines, and moving averages are among the reference points used to identify support and resistance.
Support and resistance should not be interpreted as precise boundaries where prices must react at one exact level. CME's educational materials also explain that support and resistance are not necessarily points where prices stop precisely, but rather price zones identified in the market.
Sometimes, after a price rises above an existing resistance level, it returns to that area and finds support. Conversely, after a price breaks below an existing support level, a subsequent rebound may encounter resistance in the same area. In other words, resistance can later become support, and support can turn into resistance. This is known as a reversal of roles.
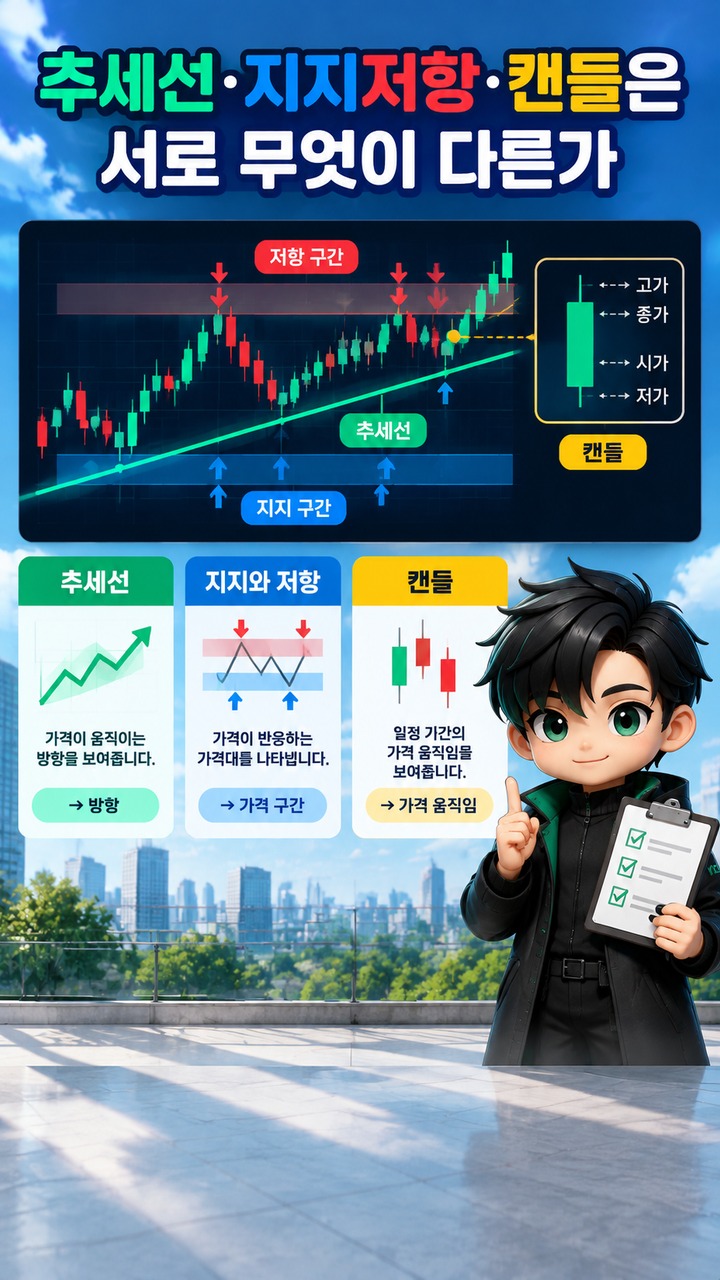
How Do Trends, Trendlines, Support and Resistance, and Candlesticks Differ?
These four elements examine the same chart, but each focuses on different information.
| Element | What It Mainly Shows | What to Watch Out for When Interpreting It Alone |
|---|---|---|
| Trend | The direction in which highs and lows are moving | Short-term movements may be mistaken for the overall trend |
| Trendline | A connection between rising lows or falling highs | A trendline break alone does not confirm a reversal |
| Support and resistance | Price areas where repeated reactions have occurred | These should not be fixed at one exact price |
| Candlestick | The opening, high, low, and closing prices for a period | The timeframe and preceding trend must also be considered |
Therefore, a single bullish candlestick does not mean the entire chart is in an uptrend. Conversely, individual bearish candlesticks can appear within an uptrend. The overall direction of a chart and price movements during a particular period represent different layers of information.
Candlestick Patterns and Chart Patterns Are Not the Same
Candlestick patterns focus on the shapes and relationships formed by one or several consecutive price bars, while conventional chart patterns examine structures created by multiple price advances and declines over a broader period. Fidelity's charting help materials also distinguish classical chart patterns from candlestick and multi-bar patterns as separate categories.
Examples of classical chart patterns include double tops, double bottoms, head and shoulders, and triangles. Candlestick and multi-bar patterns, on the other hand, include engulfing lines, hammers, inverted hammers, hanging men, and shooting stars, which are based on the relationships between one, two, or several price bars. Candlestick patterns can serve as supplementary signals when analyzing other chart structures.
This distinction is something beginners frequently overlook. It is easier to understand the difference by thinking of chart patterns as tools for examining broader price structures, while candlestick patterns help interpret shorter-term price changes within those structures.
Where a Candlestick Pattern Appears Matters More Than Its Shape
The same candlestick shape can have different implications depending on the existing trend and its position relative to support and resistance. Educational materials on candlestick patterns also emphasize examining reversal candles alongside other price structures rather than treating them as definitive standalone signals.
For example, a bearish engulfing pattern occurs during an upward price movement when a bullish candle is followed by a bearish candle whose body completely engulfs the previous candle's body. It is one of the patterns used to identify a potential downward reversal.
A shooting star forms when the price rises significantly during a trading session but subsequently falls and closes near its opening price. This pattern is described as showing that buying pressure pushed the price higher but failed to sustain those gains.
However, the appearance of either pattern should not immediately be interpreted as confirmation of a trend reversal. Schwab's educational materials also describe reversal patterns as supporting evidence that should be evaluated alongside other price signals and do not recommend relying exclusively on technical analysis for investment research.
What Is the Best Order for Analyzing an Actual Chart?
For beginners, examining a chart in the following order can help reduce the risk of confusing different signals: Timeframe → Price Structure → Trendlines → Support and Resistance → Candlesticks and Patterns.
1. First, identify the timeframe of the chart you are viewing, such as daily, weekly, or intraday candles.
2. Examine whether recent highs and lows are rising, falling, or moving horizontally.
3. In an upward movement, connect significant lows to identify an upward trendline. In a downward movement, connect significant highs to identify a downward trendline.
4. Identify support and resistance in areas where prices have repeatedly stopped or reversed in the past.
5. When the price approaches those areas, observe how the candlestick bodies and wicks develop.
6. If a candlestick pattern appears, check whether the existing trend and nearby support and resistance structures support an interpretation in the same direction.
Following this approach can help prevent conclusions such as "A bullish candle appeared, so the price will rise," "The price touched support, so it will rebound," or "The price broke below a trendline, so a downward reversal is confirmed." Trendlines indicate direction, support and resistance identify potential reaction zones, candlesticks show price movements during specific periods, and patterns reveal relationships among multiple price movements. Each serves a different purpose.
Final Points to Remember When Reading Chart Patterns
The most important initial distinction in technical analysis is between confirmed price data and interpretations based on that data. Opening, high, low, and closing prices are actual market data, but determining where a trendline should be placed or predicting what movement may follow a particular pattern involves interpretation.
Therefore, trendlines, support and resistance, candlesticks, and patterns should be used as tools for systematically understanding current price structures, not as formulas that guarantee future prices. Actual investing carries the risk of losing principal, and investment decisions should not be based on a single technical analysis signal.
Related Articles
Based on Their Birth Years, Ki Hee-hyun and Lee Sang-yoon Are 1 Years Apart
이 포스팅은 쿠팡 파트너스 활동의 일환으로, 이에 따른 일정액의 수수료를 제공받습니다.