

How to Identify Accumulation Candles in Stocks and Crypto: Look Beyond Volume and Check in 5 Steps
이 포스팅은 쿠팡 파트너스 활동의 일환으로, 이에 따른 일정액의 수수료를 제공받습니다.

An accumulation candle cannot be confirmed based on a single long upper wick or a sudden surge in trading volume. As of 2026-09-24, a more reasonable approach is to examine where the candle appears on the price chart, its volume relative to normal levels, where the closing price falls within the candle's range, whether the price holds afterward, and the direction of volume indicators such as OBV and A/D.
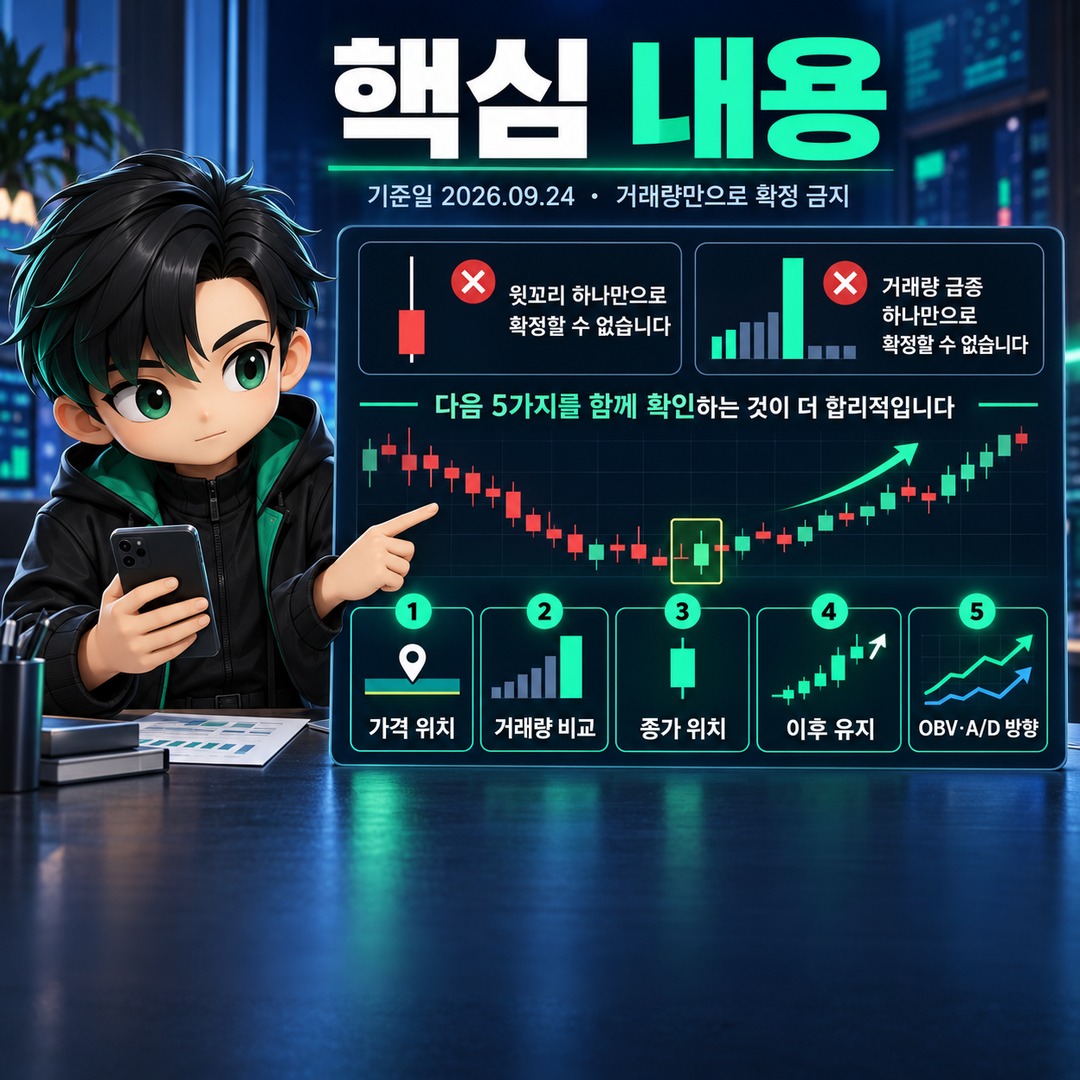
In particular, avoid relying on a single condition, such as assuming that someone has been accumulating because trading volume surged or that major market players have been building positions because a long upper wick appeared. A volume spike can indicate strong market interest, but it can occur not only at the beginning of an upward move, but also in response to news or near the end of a trend.
Why Can't You Identify Accumulation from a Single Candlestick?
The information a single candlestick reliably provides consists of the opening, high, low, and closing prices. The body represents the difference between the opening and closing prices, while the wicks show the range of prices traded during that period.
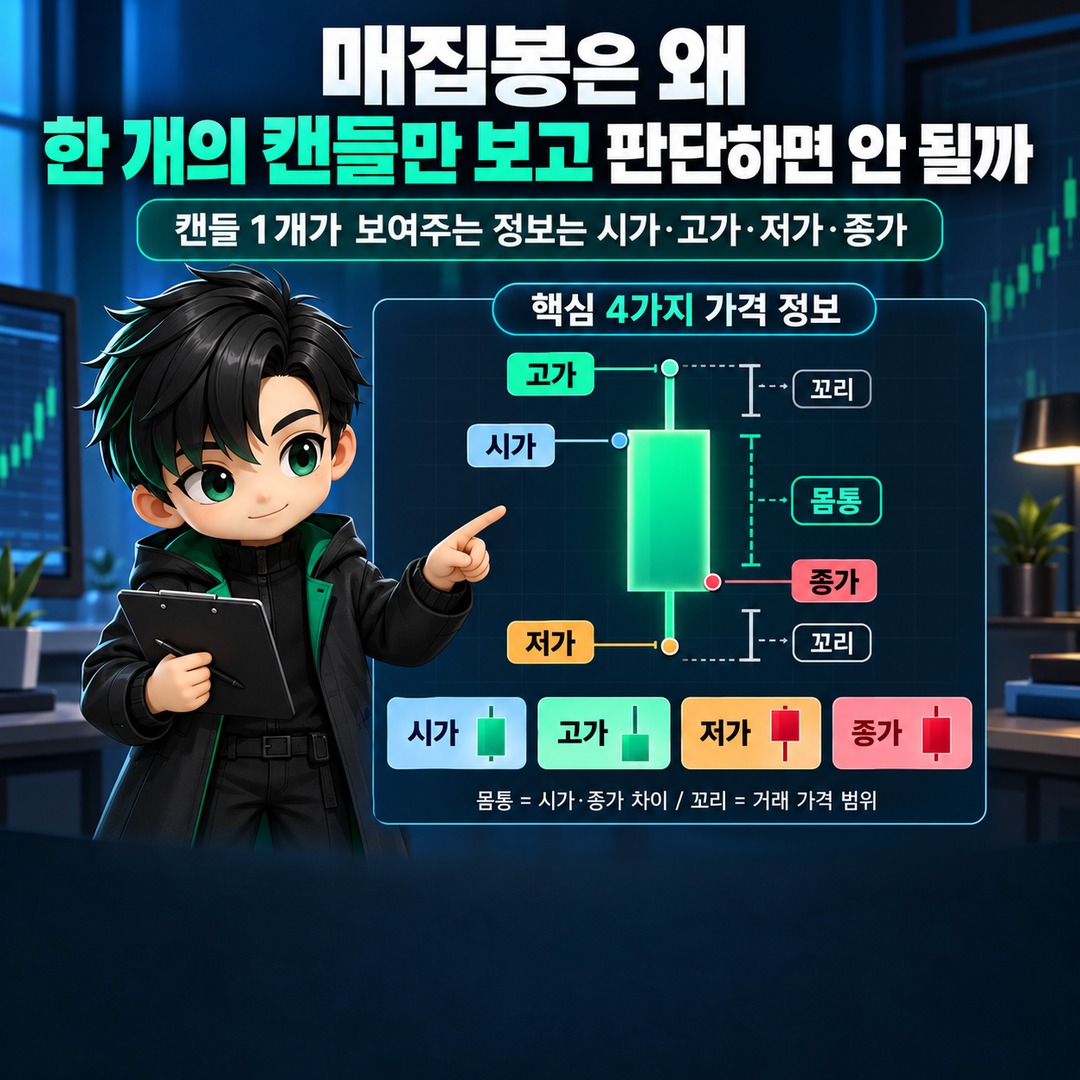
Therefore, a long upper wick alone cannot reveal who was accumulating positions. A long upper wick means that the asset traded at a higher price at some point, but its closing price ended below that level.
The same applies to trading volume. Higher-than-usual volume shows that substantial trading activity accompanied the price movement, but a volume bar alone cannot establish that a particular investor or group was accumulating positions.
For this reason, this article uses the term accumulation candle to mean a price-and-volume pattern worth investigating for possible accumulation, rather than a candle that proves accumulation has occurred.
1. Check the Price Location Before the Candle's Shape
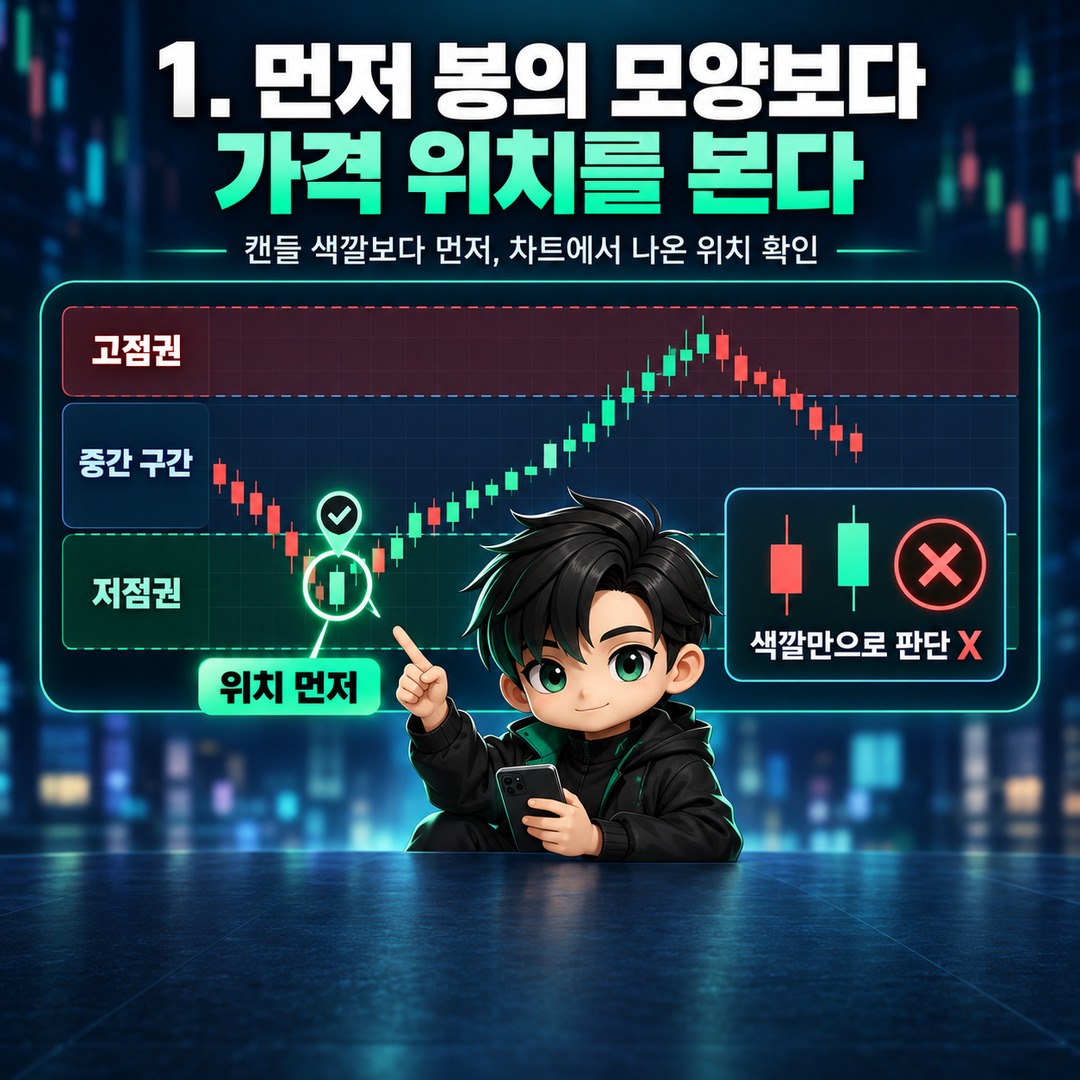
When assessing possible accumulation, the first thing to check is not the candle's color but where it appears within the overall price chart.
If volume suddenly increases during a prolonged sideways trading period or near a price level that has repeatedly provided support, there may be reason to monitor subsequent price action. Conversely, if the same combination of a volume spike and an upper wick appears after a substantial price increase, it should not immediately be labeled an accumulation candle.
During sideways trading periods in particular, it is important to check the subsequent direction of both price and cumulative volume indicators.

2. Compare Volume with Normal Levels Rather Than Just Counting Shares or Coins
Because normal trading volume differs from one asset to another, comparing absolute volume figures alone is less meaningful. It is better to compare current volume with the recent average for the same asset and timeframe.
For example, relative volume can be calculated as a supplementary measure using the following formula.
Author's calculation
Relative volume = Current candle volume ÷ Average volume of the previous N candles
If the average volume over the previous 20 candles is 100만 and the current volume is 220만, the relative volume is 2.2 times.
Figures such as 20 candles or 2 times are not official thresholds for determining whether accumulation is occurring. The key is to establish how much trading activity has actually changed compared with recent activity in the same asset, rather than simply feeling that volume is high.
A substantial increase in trading volume should not, by itself, be treated as a buy signal. High volume can support a strong price movement, but it can also appear when a trend is becoming exhausted.
3. Check Where the Price Closes, Not Just the Length of the Upper Wick
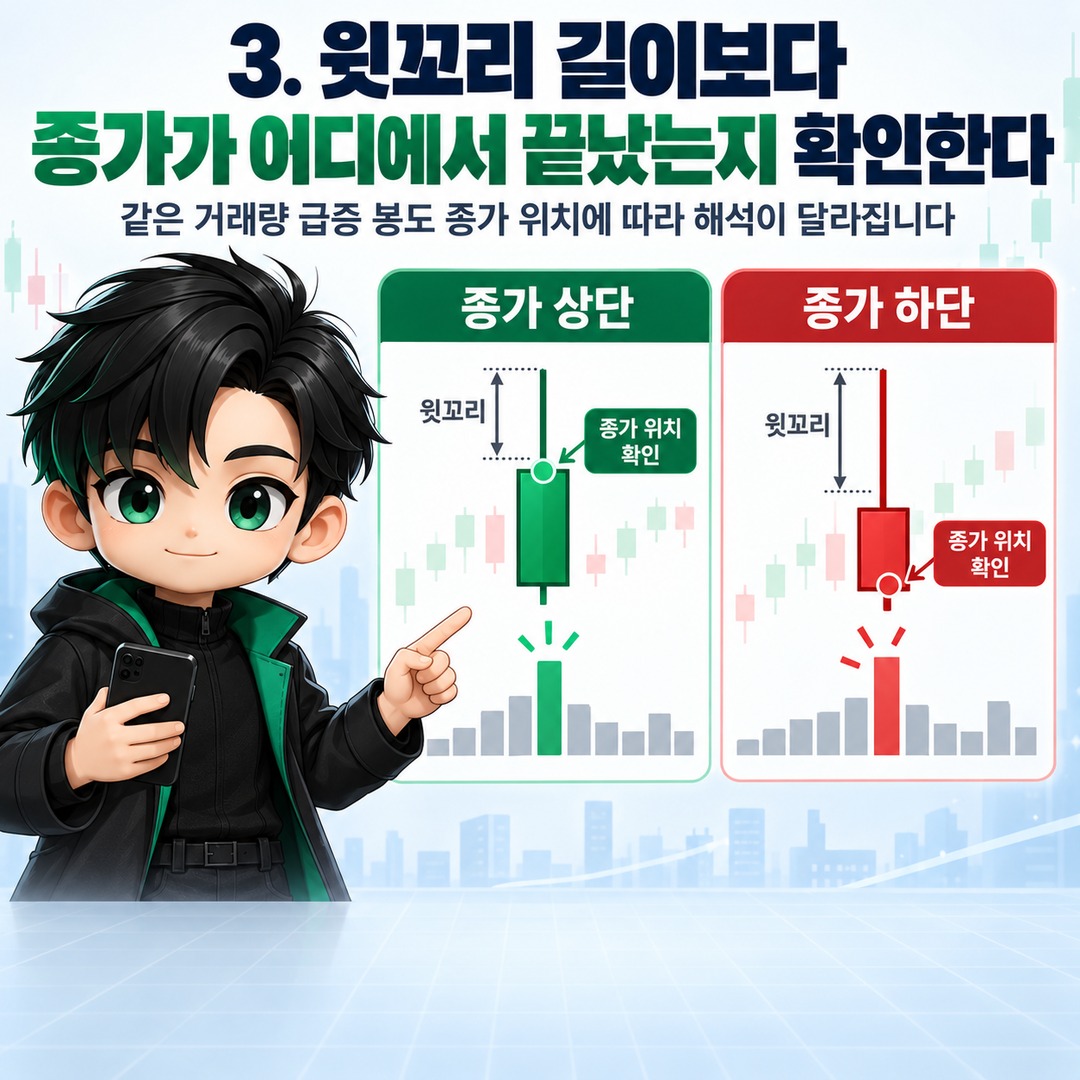
Even candles with similarly large volume spikes can look very different depending on where they close.
A candle that rises sharply to its high before falling back to close near its low should not be interpreted in the same way as a candle that experiences substantial volatility but closes near its high.
The closing price's position can be compared numerically as follows.
Author's calculation
Closing position = (Closing price - Low) ÷ (High - Low) × 100
If the high is KRW 10,000, the low is KRW 8,000, and the closing price is KRW 9,600, the closing position is 80%. This means the closing price was formed toward the upper end of the candle's overall price range.

There is no official threshold for this figure that establishes a candle as an accumulation candle above a certain percentage. However, rather than focusing only on the appearance of a long upper wick, it allows you to compare where the closing price actually falls within the day's trading range.
4. What Really Matters Is What Happens After the Candle Appears
Subsequent price movements are more useful for testing an accumulation hypothesis than the candle on the day itself.
If the price continues to hold within its previous support zone or sideways trading range after a high-volume candle, and cumulative volume indicators rise without the price breaking down, there is additional reason to monitor the possibility of accumulation.
Conversely, if the price breaks below support immediately after a volume spike and weakness continues, the original accumulation hypothesis becomes less convincing.
In other words, rather than reaching a conclusion on the day a high-volume candle appears, it is important to use subsequent candles to test the initial interpretation.
5. Use OBV and A/D to Compare Price and Volume Direction Again
If candlesticks alone leave the situation unclear, volume-based indicators such as OBV and A/D can provide supplementary information.
On-Balance Volume (OBV) works by adding the day's trading volume to a cumulative total when the closing price is higher than the previous close and subtracting it when the closing price is lower. If OBV rises while the price remains relatively flat during a sideways market, it may suggest that buying pressure is becoming relatively stronger in the cumulative volume trend.
The Accumulation/Distribution (A/D) indicator combines trading volume with the closing price's position between the candle's high and low. If A/D rises during a sideways trading period, it can serve as supplementary evidence when evaluating possible accumulation.
Neither indicator provides definitive confirmation. OBV treats the entire trading volume of an up-closing day as positive volume, while A/D also interprets price and volume through a predefined formula. Neither indicator reveals the actual trading records of individual investors or accounts.
Patterns That Strengthen or Weaken the Accumulation Hypothesis
| Factor to Check | Conditions Worth Further Investigating for Accumulation | Conditions That Weaken the Accumulation Hypothesis |
|---|---|---|
| Price location | Appears within a sideways trading or support zone | Appears near a high after a substantial rally |
| Trading volume | Clearly increases above the recent average | Little change in trading volume |
| Closing position | Closes near the high | Falls sharply toward the low after reaching the high |
| Subsequent price action | Maintains the existing support or sideways trading range | Quickly breaks below support |
| OBV and A/D | Rise during sideways trading or show greater strength than price | Decline alongside price or remain weak |
This table does not mean that meeting any single condition confirms accumulation. It provides a framework for checking whether several conditions point in the same direction.
Can Stocks and Cryptocurrencies Be Analyzed the Same Way?
The basic principle of examining price, volume, closing position, and subsequent movements together applies to both stock and cryptocurrency charts. However, sudden volume spikes and sharp price increases require even more cautious interpretation in cryptocurrency markets.
Even if trading volume surges on the exchange you are watching, it is preferable, when possible, to compare the same asset's movements on other exchanges. Rather than interpreting a sudden price surge alone as accumulation, examine volume, support zones, and subsequent price action together.
Because cryptocurrencies are also subject to price volatility and market manipulation risks, assuming that identifying an accumulation candle means the price will subsequently rise is particularly dangerous.
Follow This Sequence When Analyzing a Real Chart
When you spot a candle with unusually high trading volume, first determine whether it appeared during sideways trading, near support, or near a price high.
Next, compare its current volume with the recent average and check where the closing price falls between the high and low.
Even if these conditions appear favorable, do not immediately conclude that accumulation has occurred. Check whether subsequent prices maintain the existing support zone, and finally compare whether OBV or A/D is signaling the same direction as the price trend.
In short, the sequence is price location → relative volume → closing position → subsequent price action → cumulative volume indicators.
An accumulation candle is not a buy signal that guarantees future price increases. It is better understood as a potential signal that warrants monitoring subsequent movements after a particular price-and-volume pattern appears. In actual trading, entry prices and stop-loss levels should be established separately, with the possibility of losses taken into account.
※ This article is for informational purposes to help readers understand market trends and does not constitute investment advice or a recommendation concerning any particular security or asset. All final investment decisions and responsibilities rest with the individual investor.
Related Articles
이 포스팅은 쿠팡 파트너스 활동의 일환으로, 이에 따른 일정액의 수수료를 제공받습니다.