

How to Analyze Stock Trading Flows: Key Indicators and Steps for Interpreting Net Buying by Foreign, Institutional, and Retail Investors
이 포스팅은 쿠팡 파트너스 활동의 일환으로, 이에 따른 일정액의 수수료를 제공받습니다.

Stock trading flow analysis examines how much foreign, institutional, and retail investors buy and sell individual stocks over a given period and how those transactions are reflected in stock prices and trading volume. However, trading flows represent actual transaction results rather than signals that guarantee future price movements. Investors should therefore consider the time period, trading value, and price trends together instead of relying on a single net buying figure. The Korea Exchange (KRX) provides investor-category trading statistics, investor-category trading statistics for individual stocks, and rankings of stocks by net buying activity.
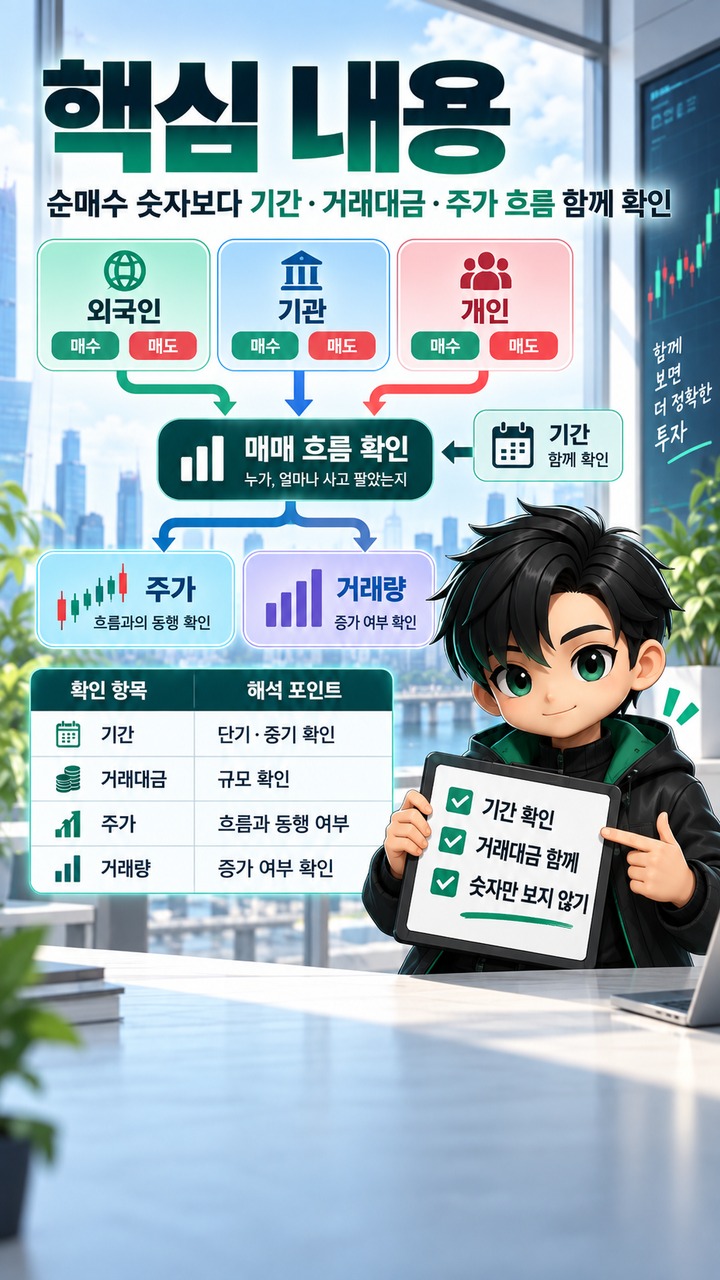
What Are Stock Trading Flows, and What Do They Reveal?
Stock trading flows describe how money enters and leaves the market through different categories of investors.

In the South Korean stock market, analysis generally focuses on three main investor categories:
Retail investors
Foreign investors
Institutional investors
Net buying is the value of purchases minus the value of sales.
For example, if an investor category purchases KRW 100,000,000,000 worth of stocks and sells KRW 70,000,000,000 worth in one day, its net buying amounts to KRW 30,000,000,000.
Conversely, if it purchases KRW 70,000,000,000 worth and sells KRW 100,000,000,000 worth, its net selling amounts to KRW 30,000,000,000.
The important point is that substantial net buying does not necessarily lead to higher stock prices. Trading flow data shows who participated in transactions; it does not definitively predict how stock prices will move in the future.
3 Key Factors to Check First When Analyzing Trading Flows
1. Examine Cumulative Trends Rather Than a Single Day

Even if foreign investors record net buying of KRW 50,000,000,000 in a single day, that figure alone is insufficient to determine its significance.
The recommended order of analysis is as follows:
1. Check net buying for the current trading day.
2. Review trends over the most recent 5 trading days.
3. Review trends over the most recent 20 trading days.
4. Compare those trends with the direction of the stock price.
For example, if foreign investors record net buying for 10 consecutive days while the stock price rises, this indicates an observable pattern of capital inflows.
Conversely, if net buying on one day immediately turns into net selling the following day, the activity may have been temporary.
2. Consider Net Buying Value Alongside Total Trading Value
The significance of net buying of KRW 10,000,000,000 can vary depending on the size of the stock.
Net buying of KRW 10,000,000,000 in a large-cap stock may have a different market impact from net buying of KRW 10,000,000,000 in a less actively traded small- or mid-cap stock.
The following indicators should be examined:
| Indicator | Why It Matters |
|---|---|
| Net buying value | Identifies which investor category contributed net capital inflows |
| Trading value | Shows the actual monetary scale of trading |
| Trading volume | Indicates the level of buying and selling activity |
| Stock price position | Helps determine whether trading flows are reflected in the price |
3. Break Down Institutional Trading by Investor Type
Institutional investors are not a single investor.
The institutional category includes securities and other financial investment firms, insurance companies, investment trusts, private funds, banks, other financial institutions, and pension funds. Looking only at the overall institutional net buying figure can therefore obscure which groups are driving the activity.
For example, even when institutions collectively record net buying, their transactions may move in different directions:
Financial investment firms: buying
Pension funds: selling
Investment trusts: selling
These contrasting activities can occur simultaneously.
How Should Foreign Investor Trading Flows Be Interpreted?
Foreign investor trading activity is one of the indicators frequently monitored in the South Korean stock market.
When analyzing it, consider the following factors together:
How long foreign investors have maintained net buying
Changes in foreign ownership percentages
Exchange rate trends
Changes in the company's financial performance
Trading flows across the broader industry or sector
The fact that foreign investors have purchased large amounts of a stock does not necessarily mean its price will rise.
Foreign investor transactions may reflect various objectives, including long-term investment, short-term trading, and index-related transactions.
Step-by-Step Stock Trading Flow Analysis for Beginners
When examining trading flows in practice, the following sequence is useful.
Step 1: Check Overall Market Trends
First, examine whether foreign and institutional investors are net buyers or net sellers in South Korea's KOSPI and KOSDAQ markets.
Distinguish between broad-based foreign net buying across the market and capital inflows concentrated in particular industries.
Step 2: Examine Trading Flows for Stocks You Are Interested In
For individual stocks, check the following:
Foreign investor net buying
Institutional investor net buying
Retail investor net buying
Changes across recent time periods
The Korea Exchange provides investor-category trading statistics for individual stocks as well as the overall market.
Step 3: Compare Stock Price Movements with Trading Flows
Compare combinations such as the following:
| Market Situation | What to Examine |
|---|---|
| Rising stock price + foreign and institutional buying | Compare capital inflows with price movements |
| Falling stock price + foreign and institutional buying | Identify the buying investor categories and relevant time periods |
| Rising stock price + concentrated retail buying | Assess whether the trading activity is sustained |
| Increasing trading volume + changing trading flows | Look for changes in market interest |
Trading flows are generally more useful when considered alongside other information, such as prices, trading volume, and corporate earnings, rather than as a standalone decision-making indicator.
Common Mistakes in Stock Trading Flow Analysis
Making Decisions Based on a Single Day of Net Buying
A single day's trading flows may reflect specific trading events or program trading activity.
It is important to examine trends across multiple periods rather than focusing exclusively on short-term changes.
Assuming Foreign Investor Buying Automatically Means Higher Prices
Foreign investor net buying reflects transactions that have already occurred.
Subsequent stock price movements can be influenced by various factors, including corporate earnings, market conditions, and valuation levels.
Treating All Institutional Investors as One Group
Different types of institutional investors have different investment characteristics.
Long-term investments by pension funds and short-term transactions by financial investment firms may have different implications, even when both are classified as institutional net buying.
Key Principles to Remember When Analyzing Stock Trading Flows
Effective trading flow analysis does not end with identifying who bought a stock.
A useful sequence is:
1. Who bought and sold the stock?
2. How large were the transactions?
3. Did the activity continue for several days or weeks?
4. Did stock prices and trading volume move in the same direction?
5. Are the trends supported by the company's financial results and regulatory disclosures?
Trading flow data is one source of information that investors can use when making decisions. It does not guarantee that any particular stock will rise or generate profits.
Frequently Asked Questions
Will a Stock Price Definitely Rise If Foreign and Institutional Investors Buy Simultaneously?
No. Net buying by foreign and institutional investors indicates buying activity, but stock prices are affected by many factors, including earnings, market conditions, and valuation levels.
Where Can I Find Stock Trading Flow Data?
The Korea Exchange's information and data system provides investor-category trading statistics for the overall market and individual stocks. Some securities brokerage apps also provide this information, although reporting standards and data aggregation times may vary by service.
What Is Most Important for Retail Investors When Analyzing Trading Flows?
Rather than focusing on a single day's net buying figure, it is important to compare trends over time, trading value, and stock price movements together.
※ This article is provided for informational purposes to help readers understand market trends. It does not constitute investment advice or a recommendation to invest in any particular stock or asset. Investors are responsible for their own final decisions and investment outcomes.
Related Articles
What Does One Share of SPCX Contain?
이 포스팅은 쿠팡 파트너스 활동의 일환으로, 이에 따른 일정액의 수수료를 제공받습니다.