

How to Identify a Stock Market Bottom: 4 Signals to Check Before RSI 30
이 포스팅은 쿠팡 파트너스 활동의 일환으로, 이에 따른 일정액의 수수료를 제공받습니다.
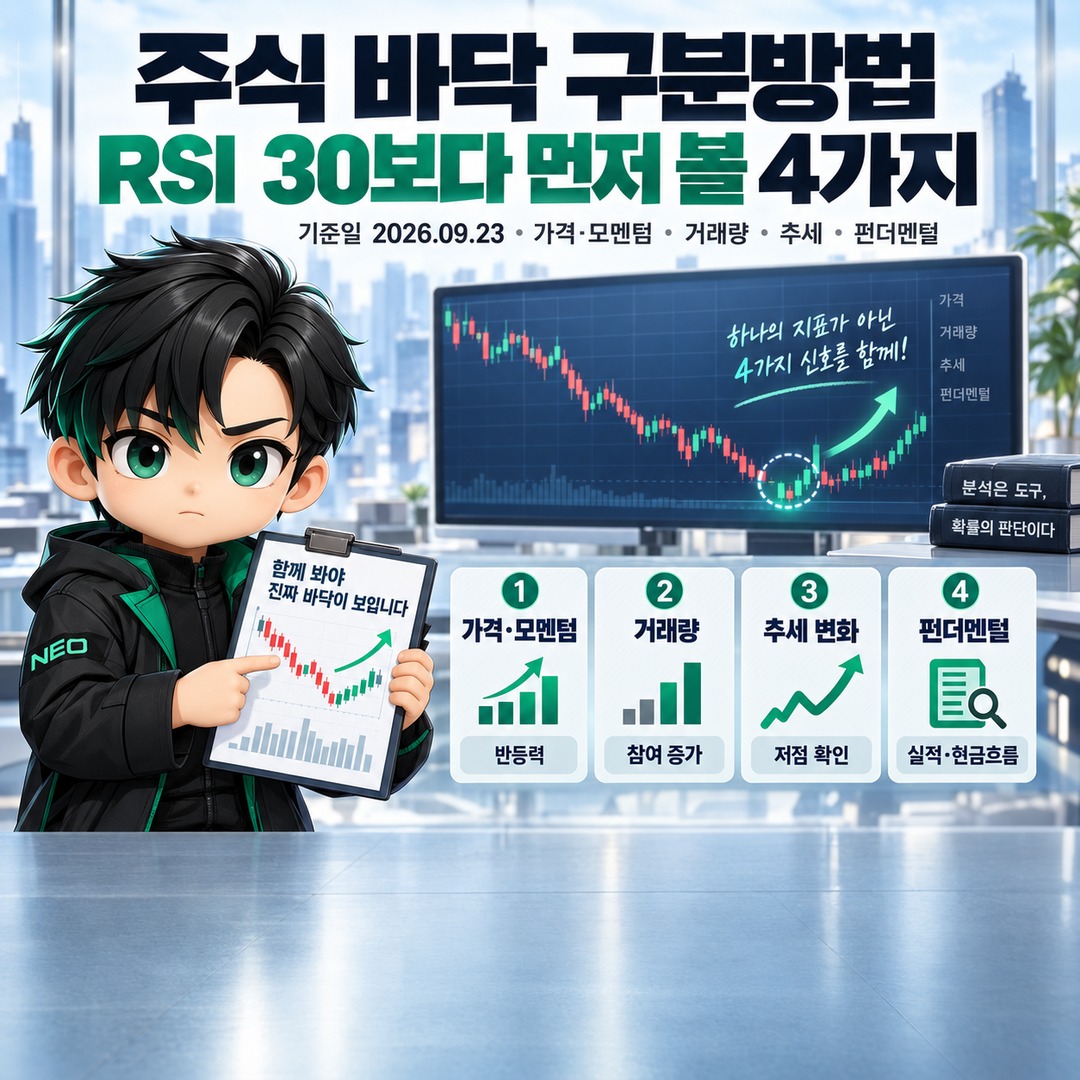
A stock market bottom cannot be confirmed by a single indicator, such as an RSI reading of 30 or below. As of 2026-09-23, a practical approach is to examine price and momentum, trading volume and market participation, trend changes, and company fundamentals together. Technical analysis itself is a tool for assessing probabilities rather than making definitive predictions, and it does not guarantee successful entry timing.
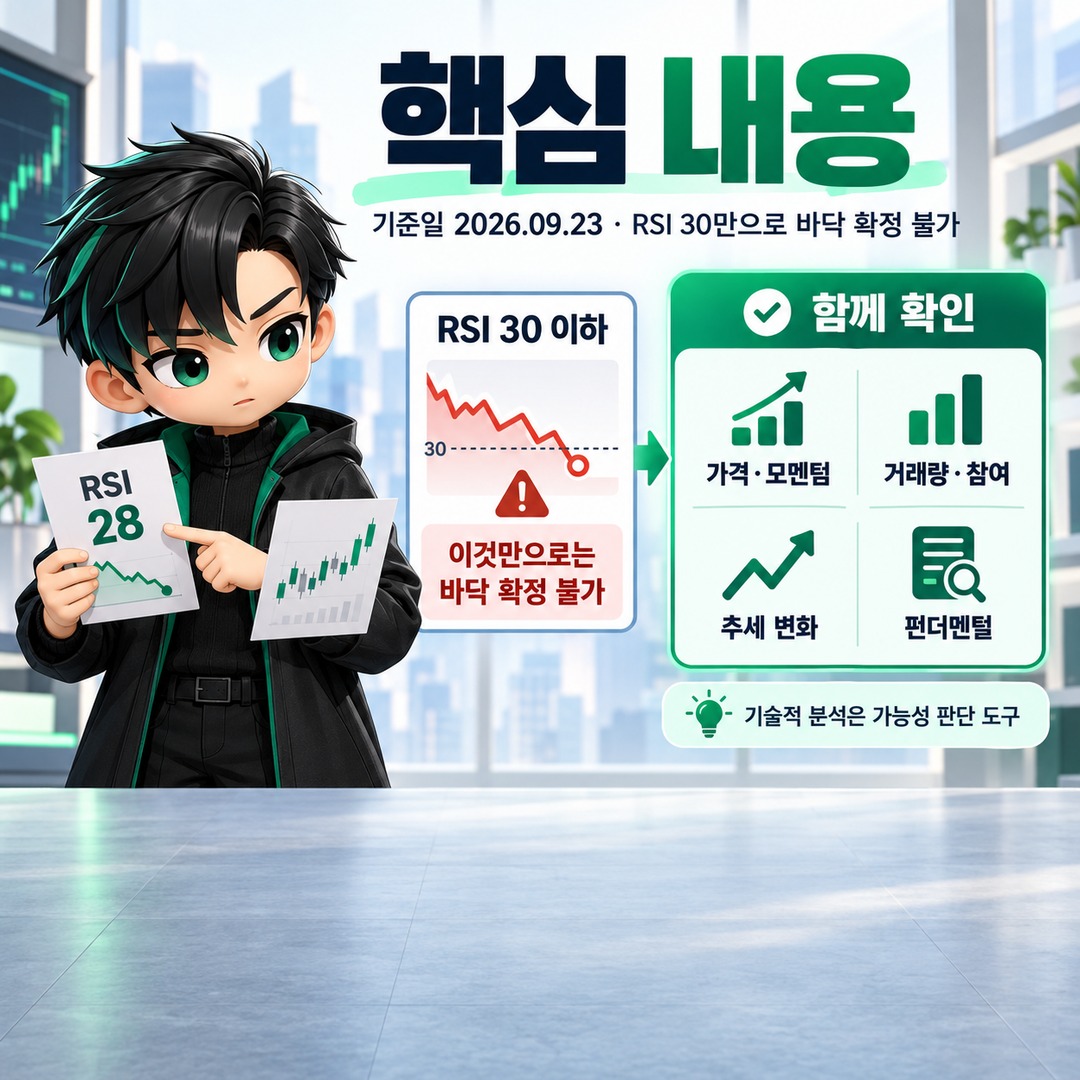
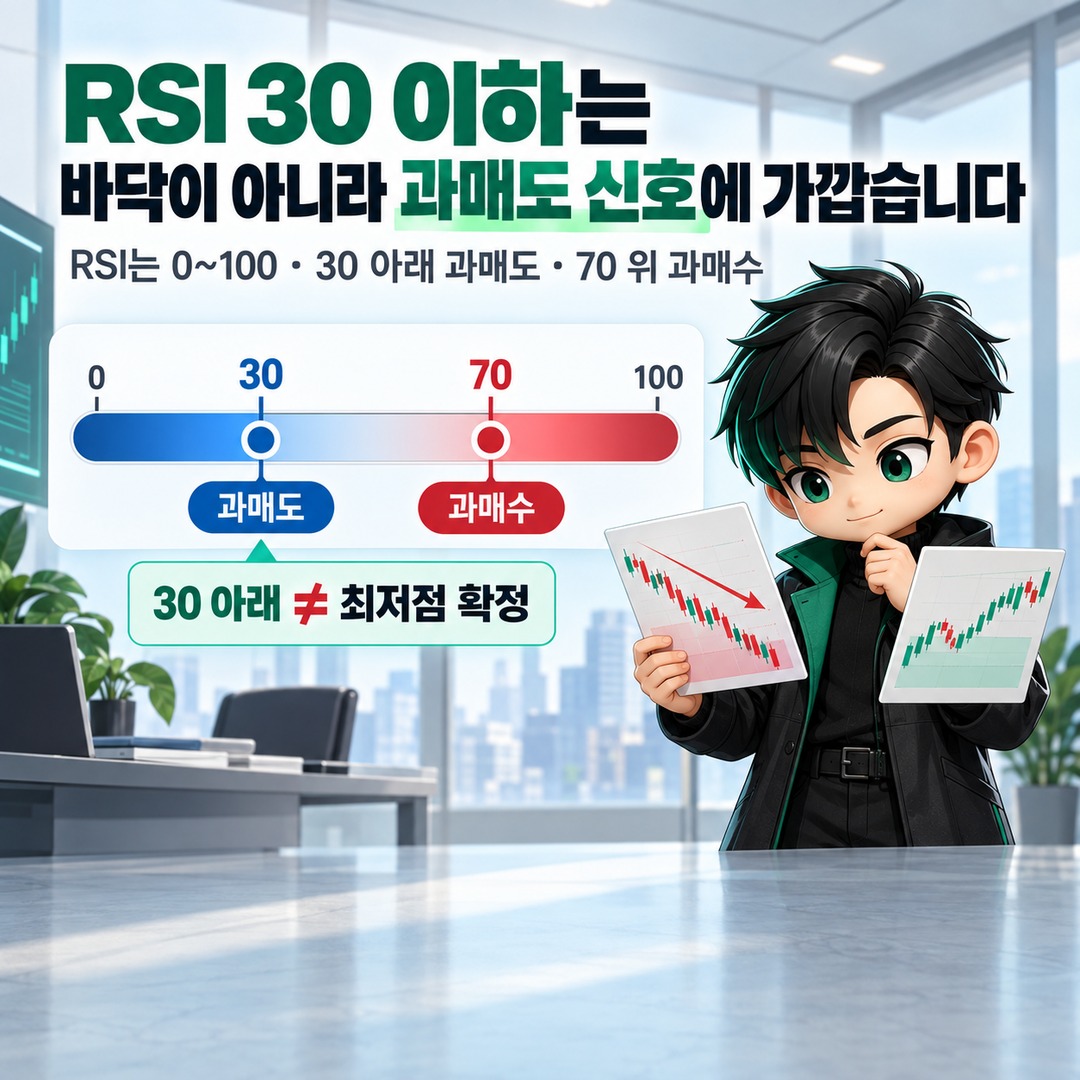
RSI Below 30 Is an Oversold Signal, Not Confirmation of a Bottom
An RSI reading below 30 does not mean the stock has reached its lowest price. RSI is a momentum indicator that moves between 0 and 100, with readings below 30 traditionally interpreted as oversold and readings above 70 interpreted as overbought.
The problem arises during a strong downtrend. When a downtrend is powerful, RSI can remain in oversold territory for a considerable period. Therefore, rather than deciding to buy simply because RSI has fallen below 30, it is better to check whether RSI begins recovering and whether a divergence appears, in which RSI fails to move in the same direction as the price while the stock makes new lows.
In other words,
RSI 30 or below = A range worth examining for potential undervaluation
but not
RSI 30 or below = A confirmed bottom.
Check Whether the Rebound Is Supported by Trading Volume

If the price rebounds, the next step is to examine trading volume. Even when two price movements are similar in magnitude, the movement accompanied by relatively higher trading volume can be interpreted as stronger than one occurring on lower volume.
For example, even if a stock that has plunged rebounds by 5% in a single day, it is difficult to conclude that the trend has reversed if trading participation remains extremely low.
Conversely, if the price recovers an important support zone while trading participation increases compared with earlier periods, or if the rebound continues after a decline, that provides another piece of evidence for identifying a potential bottom.
However, trading volume is not a standalone criterion either. Technical indicators can produce conflicting signals, and even when a particular entry signal appears, a successful trade is not guaranteed.

When Assessing an Overall Market Bottom, Examine the Breadth of Advancing Stocks
When evaluating whether a market index such as the KOSPI or S&P 500 has reached a bottom, investors can look beyond the index price itself and examine how many stocks are participating in the rebound.
Market breadth, which measures the number of advancing and declining stocks, is a way to assess market participation through indicators such as the number of stocks reaching new highs and new lows and the proportion of stocks trading above their moving averages. If the number of participating stocks also expands as the index rises, this can be interpreted as broader participation in the market's advance.
Conversely, if the index rises primarily because a small number of large-cap stocks are gaining while most other stocks remain weak, it is difficult to conclude that the entire market has confirmed a bottom based solely on the index rebound.
Extremely weak market breadth may indicate the possibility of a short-term low, but it does not necessarily mean selling pressure has ended. Market breadth should also be evaluated alongside other technical indicators.
50-Day and 200-Day Moving Averages Are More Useful for Identifying Trend Changes Than Exact Bottom Prices
Moving averages calculate the average price over a specified period, smoothing short-term price fluctuations and helping identify the overall direction. The 50-day and 200-day moving averages are commonly used periods, and crossovers between these moving averages are also used as trend signals.
When looking for a bottom, the important question is not 'What exactly is the lowest price?' but whether the downtrend is still intact and whether price behavior is beginning to change.
Therefore, rather than entering a position simply because RSI indicates oversold conditions, examining whether the price recovers a support zone, whether the rebound continues, and what direction the moving averages indicate provides more information.
For Individual Stocks, First Determine Whether Company Earnings Are Continuing to Deteriorate
The bottom of a market index and the bottom of an individual company's stock price should not be assessed in exactly the same way.
For individual stocks, a substantial price decline alone is not enough to establish that the shares are cheap. Investors should also examine how the company's fundamentals are actually developing, including revenue, net income, earnings per share (EPS), cash flow, and financial condition.
It is particularly important to examine trends across several quarters or years rather than focusing on a single quarterly figure. If revenue and profits continue to decline, free cash flow deteriorates, and the debt burden increases, it is difficult to identify a bottom based solely on a lower share price. Valuation should also be compared with companies in the same industry and with historical levels.
This is why investors need to distinguish between a share price decline caused by ordinary market fluctuations and one driven by deteriorating profitability and financial conditions at the company itself.
Use These 4 Steps to Narrow Down Potential Bottoms on Actual Charts
Rather than searching for one signal, following the sequence below can make the assessment criteria clearer.
| Step | What to Check | Situations That Still Require Caution |
|---|---|---|
| 1. Price and RSI | Support zones, whether RSI is recovering, and divergence | RSI alone is below 30 while the price continues making new lows |
| 2. Trading Volume and Market Participation | Increasing trading volume during rebounds and, for market indexes, broader participation among advancing stocks | Trading participation weakens again after a one-day rebound |
| 3. Trend | Signs of a change in the downtrend based on moving averages and price action | The price falls below its previous low again after rebounding |
| 4. Company Earnings | Trends in revenue, profits, cash flow, and financial condition | The stock price has become cheaper, but earnings continue to deteriorate |
All four factors do not need to appear on the same day. The approach is less about predicting the exact bottom and more about determining whether supporting evidence is gradually accumulating.
The Most Common Mistake Is Treating 'A Large Decline' and 'A Bottom' as the Same Thing
The fact that a stock has fallen substantially from its peak simply means its current price is lower than before. It does not mean the possibility of further declines has disappeared.

Even if RSI indicates oversold conditions, valuation has declined from previous levels, and the stock experiences a strong one-day rebound, the price can fall again if company earnings continue to deteriorate or market participation remains narrow.
Conversely, waiting until every indicator looks perfectly positive may mean that the price has already moved considerably above its low. Strategies that attempt to time the market precisely also carry the risk of missing the recovery that follows a sharp decline.
For this reason, it is more practical to view bottom identification not as a one-time attempt to find the correct answer but as a process of building confidence through the sequence Price → Trading Volume and Participation → Trend → Fundamentals.
Long-Term Investors Can Also Use Strategies That Do Not Require Identifying the Exact Bottom
One way to reduce the pressure of finding the absolute lowest price is dollar-cost averaging, which involves investing the same amount at regular intervals.
As explained by Investor.gov, dollar-cost averaging is a strategy of investing an equal amount of money regularly, regardless of whether the market is rising or falling. Because the same amount is invested each time, investors purchase more shares when prices are low and fewer shares when prices are high.
However, the suitability of any strategy depends on the investment horizon, ability to tolerate losses, and when the funds will be needed. Since stock investments can result in a loss of principal, using money that will definitely be needed in the short term to buy at a perceived bottom requires a separate assessment of the risks.
Ultimately, the most important question when identifying a stock market bottom is not 'What is the RSI reading?'
Investors need to examine whether there is evidence that the price decline is stopping, whether actual trading participation is recovering, whether the trend has changed, and whether the company's earnings and financial condition are continuing to deteriorate enough to justify further price declines.
※ This article is provided for informational purposes to help readers understand market trends and does not constitute an investment recommendation for any particular stock or asset. Final investment decisions and responsibility rest with the individual investor.
Related Articles
What Is a Gap Up? Understanding a Higher Opening Stock Price and How to Check for Gap Filling
이 포스팅은 쿠팡 파트너스 활동의 일환으로, 이에 따른 일정액의 수수료를 제공받습니다.