

Samsung Electronics and SK Hynix 112-Day Moving Average: What to Check First After the August 19 Sharp Sell-Off
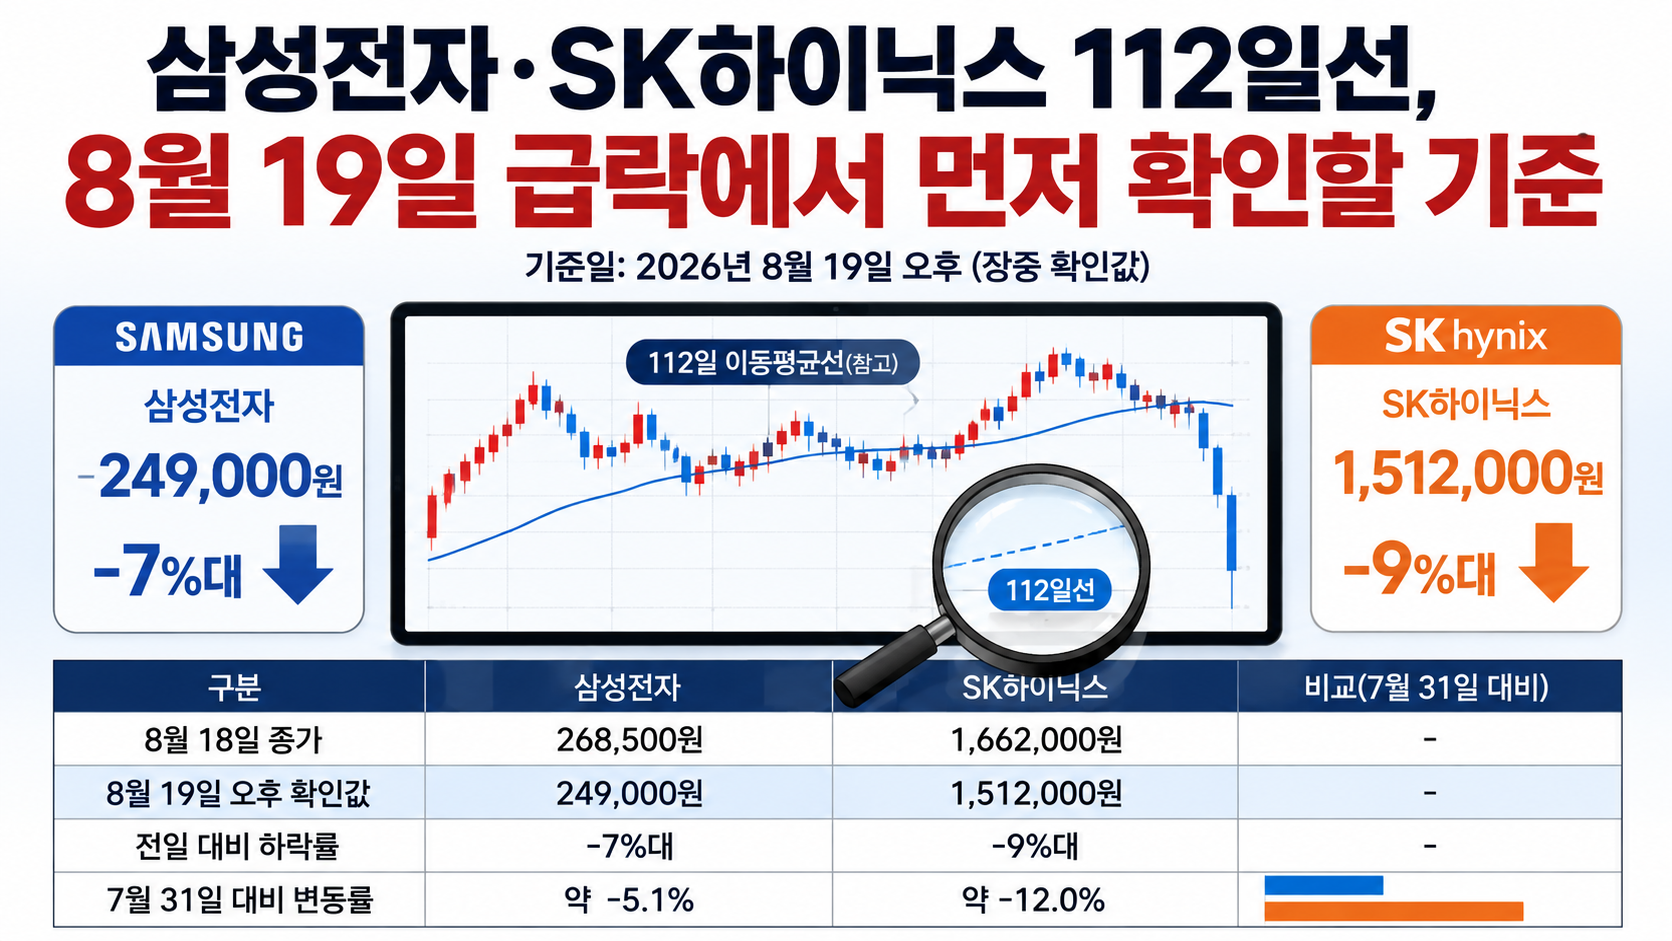
As Samsung Electronics and SK Hynix both fell sharply on the afternoon of 2026-08-19, investors may increasingly turn to the 112-day moving average on their charts. However, the 112-day moving average is neither an official benchmark established by the exchange nor a standard indicator provided by default by every brokerage. In practice, investors should consider how the 112-day moving average is calculated, where the stock closes after touching the line, and how its price behaves on the following trading day, rather than focusing solely on the line's exact value.
Intraday prices checked on August 19 were approximately KRW 249,000 for Samsung Electronics and KRW 1,512,000 for SK Hynix. The observation times differed, at 2:7 p.m. and 2:15 p.m., respectively, and these intraday prices may differ from the final closing prices. Samsung Electronics was down approximately 7%, while SK Hynix had fallen approximately 9% from the previous day.
What Exactly Does the 112-Day Moving Average Mean?
The 112-day moving average is a line connecting the average stock prices over the most recent 112 trading days. When using a simple moving average (SMA), the closing prices from the latest 112 trading sessions are added together and divided by 112.
Some investors regard approximately 6 months of trading in the Korean stock market as roughly 112 trading days and use the 112-day moving average as a medium- to long-term benchmark. In contrast, the 120-day moving average is more widely used as a long-term indicator representing approximately half a year in standard chart settings. In other words, the 112-day and 120-day moving averages cover similar periods, but they are not the same line.
The reason this distinction matters is straightforward. For volatile stocks such as Samsung Electronics and SK Hynix, even a difference of 8 trading days can change the moving average. A stock might already have fallen below the 112-day moving average on one investor's chart while remaining above the 120-day moving average on another investor's chart.
Therefore, investors should not apply a price level blindly simply because they hear that a stock has touched its 112-day moving average. It is more accurate to enter 112 as the period in their brokerage chart and first check whether the calculation uses closing prices and whether the moving average is simple or exponential.
How Large Were the Declines in Samsung Electronics and SK Hynix on August 19?
Samsung Electronics closed at KRW 268,500 on August 18, while its price checked on the afternoon of 19 was approximately KRW 249,000. SK Hynix declined from KRW 1,662,000 the previous day to KRW 1,512,000 on the afternoon of 19.
Reports checked that morning also confirmed Samsung Electronics at KRW 248,500 and SK Hynix at KRW 1,512,000, representing respective declines of 7.45% and 9.03%. Around the same time, a sell-side circuit breaker for program trading, known as a sell-side sidecar, was also triggered on the KOSPI.
Looking only at the day's movements, SK Hynix experienced the larger decline. The difference is also apparent when compared with the closing prices on July 31.
Samsung Electronics fell from KRW 262,500 on July 31 to KRW 249,000 on the afternoon of August 19.
Author's calculation: (KRW 249,000 - KRW 262,500) ÷ KRW 262,500 × 100 = approximately -5.1%.
SK Hynix fell from KRW 1,718,000 to KRW 1,512,000 over the same period.
Author's calculation: (KRW 1,512,000 - KRW 1,718,000) ÷ KRW 1,718,000 × 100 = approximately -12.0%.
These calculations simply use July 31 as the starting date for comparison and are not forecasts of investment returns. Nevertheless, they show that SK Hynix experienced greater price fluctuations than Samsung Electronics during the recent correction.
Does Touching the 112-Day Moving Average Confirm Support?
A stock touching its 112-day moving average once does not, by itself, confirm support. A moving average is a lagging indicator based on historical prices. It can help investors observe whether prices stabilize or rebound near the line, but it cannot establish the stock's next direction with certainty.
Particularly on days when stocks such as Samsung Electronics and SK Hynix experience fluctuations of around 7~9%, investors need to distinguish between a temporary intraday break below the moving average followed by a recovery and a situation in which the stock remains below the line at the close.
When reviewing charts, it is better to follow this sequence:
1. Manually set the 112-day moving average on the chart being used.
2. Check whether the regular-session closing price is above or below the 112-day moving average, rather than focusing on the intraday low.
3. Observe whether the stock recovers above the line on the next trading day or whether the 112-day moving average turns into resistance.
4. Compare trading volume and recent lows.
5. Rather than comparing Samsung Electronics and SK Hynix using the same absolute price level, evaluate each stock's position relative to its own 112-day moving average.
A moving average below the stock price does not automatically indicate a buying opportunity, nor does a decline below the moving average immediately confirm the end of a trend. The closing price's position and subsequent price reaction provide more information than a single line.
Samsung Electronics and SK Hynix Should Not Be Evaluated in Exactly the Same Way
Although both companies are major semiconductor stocks and declined together on the same day, their positions on their respective charts are not identical.
SK Hynix recorded KRW 1,718,000 on July 31 and KRW 1,662,000 on August 18 before falling into the KRW 1,510,000 range on the afternoon of 19. Its price movements have been substantial even within the past month.
Samsung Electronics experienced repeated sharp rises and falls over a short period, recording KRW 220,000 on July 28, KRW 262,500 on July 31, KRW 239,500 on August 3, and KRW 274,500 on August 14. By the afternoon of August 19, it had fallen again to around KRW 249,000.
Therefore, even when applying the same 112-day moving average, it is difficult to conclude that both stocks are at equivalent trading positions simply because they are near their respective 112-day lines. The distribution of prices included in the most recent 112 trading sessions differs between the two stocks.
What investors should actually examine comes down to three factors rather than the name of the moving average:
The distance between the current stock price and the 112-day moving average
Whether the 112-day moving average itself is rising or falling
Whether the same line has repeatedly acted as support or resistance in the past
A stock approaching a rising long-term moving average for the first time presents a different situation from one in which the moving average itself is declining and the stock has repeatedly fallen below it.
Why Does the 112-Day Moving Average Differ Between Charts?
If the 112-day moving average shows different values on charts of the same Samsung Electronics stock, the first step is usually to check the chart settings.
The most common difference is between the simple moving average (SMA) and exponential moving average (EMA). An SMA assigns equal weight to the 112 closing prices, while an EMA gives greater weight to more recent prices. The difference between the two values can widen during periods of repeated sharp price movements.
The second factor is the basis of the chart data. 112 days does not mean 112 calendar days. It refers to 112 daily price bars representing actual trading sessions. Weekends and market holidays are excluded.
The third factor is intraday pricing. When the market is still open, as on August 19, the current daily candle's closing price has not yet been finalized. On charts that update moving averages in real time, the day's moving average value may continue changing throughout the session.
Therefore, to compare the exact value of the 112-day moving average, investors should standardize their settings within the same brokerage or charting service, using conditions such as daily chart, closing price, and SMA 112.
What Should Investors Check After August 19?
The first thing to examine is the final closing price on August 19. The currently available figures are intraday prices, so they may change by the time the market closes.
Next, investors can check whether Samsung Electronics and SK Hynix each close above their respective 112-day moving averages. If either stock closes below its line, investors can observe how quickly it recovers on the following trading day. Even if a stock rebounds near the 112-day moving average, a single day's recovery is not enough to conclude that its medium-term trend has regained strength.
Conversely, an intraday break below the 112-day moving average does not necessarily confirm further declines. This is because a moving average is calculated from prices recorded over the previous 112 trading sessions.
On highly volatile days such as 2026-08-19, checking where the stock closes and whether it holds that moving average on the following trading day is a more appropriate way to interpret the chart than simply deciding to buy because the price has reached the 112-day moving average.
Stock investments carry the risk of losses due to price fluctuations. Moving averages are technical indicators that can support investment decisions, but they do not guarantee profits or price rebounds.
※ This article is provided for informational purposes to help readers understand market trends and does not constitute an investment recommendation for any particular stock or asset. All final investment decisions and associated responsibilities rest with the individual investor.