

Is Bitcoin's Sideways Trading Range Over? Analyzing Bullish and Bearish Levels After Breaking Above USD 70,000
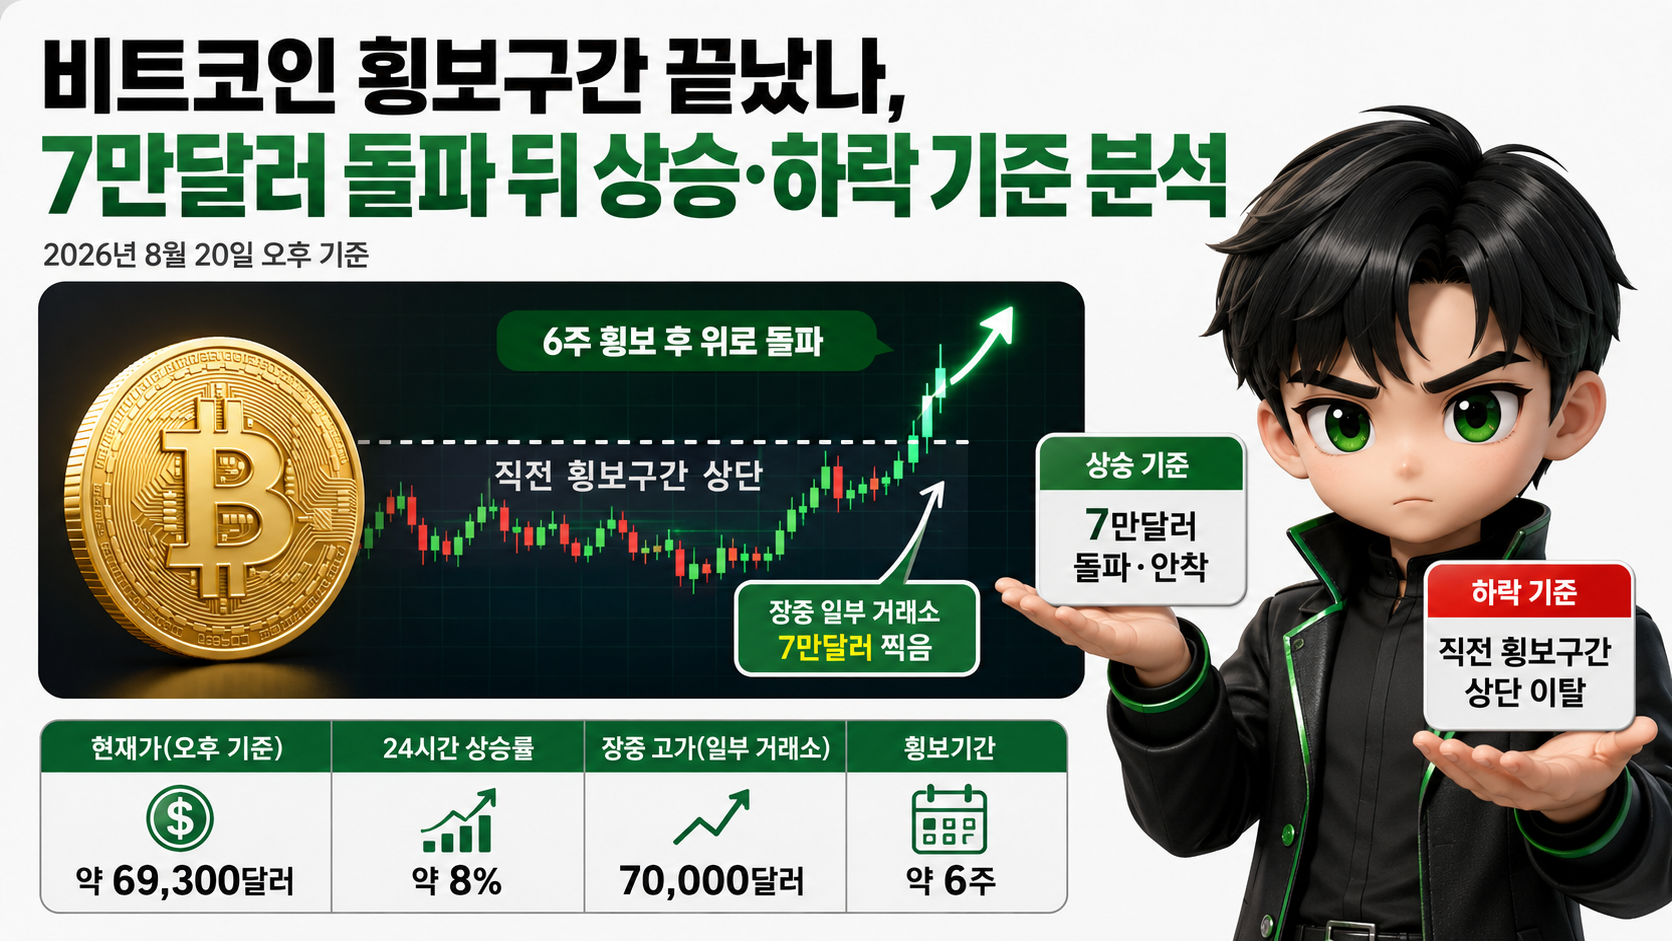
Bitcoin is finding direction again after breaking above the narrow price range it had traded within for approximately 6 weeks. As of the afternoon of 2026-08-20, Bitcoin was trading at approximately USD 69,300, with a 24-hour gain of around 8%. It briefly reached USD 70,000 on some exchanges during intraday trading. However, reaching USD 70,000 alone is not enough to confirm a medium-term uptrend. The key factors for determining its next direction are whether the former upper boundary of the sideways trading range, around USD 66,900, now holds as support and whether the price can remain above USD 70,000.

Where Did Bitcoin Trade Sideways, and for How Long?
To understand this move, it is more important to examine the price range over the preceding 6 weeks than to focus on a single day's gain. Bitcoin generally traded between 6만1,500~USD 66,900 from July 8 until the sharp rally on August 19. The difference between the upper and lower boundaries was USD 5,400.
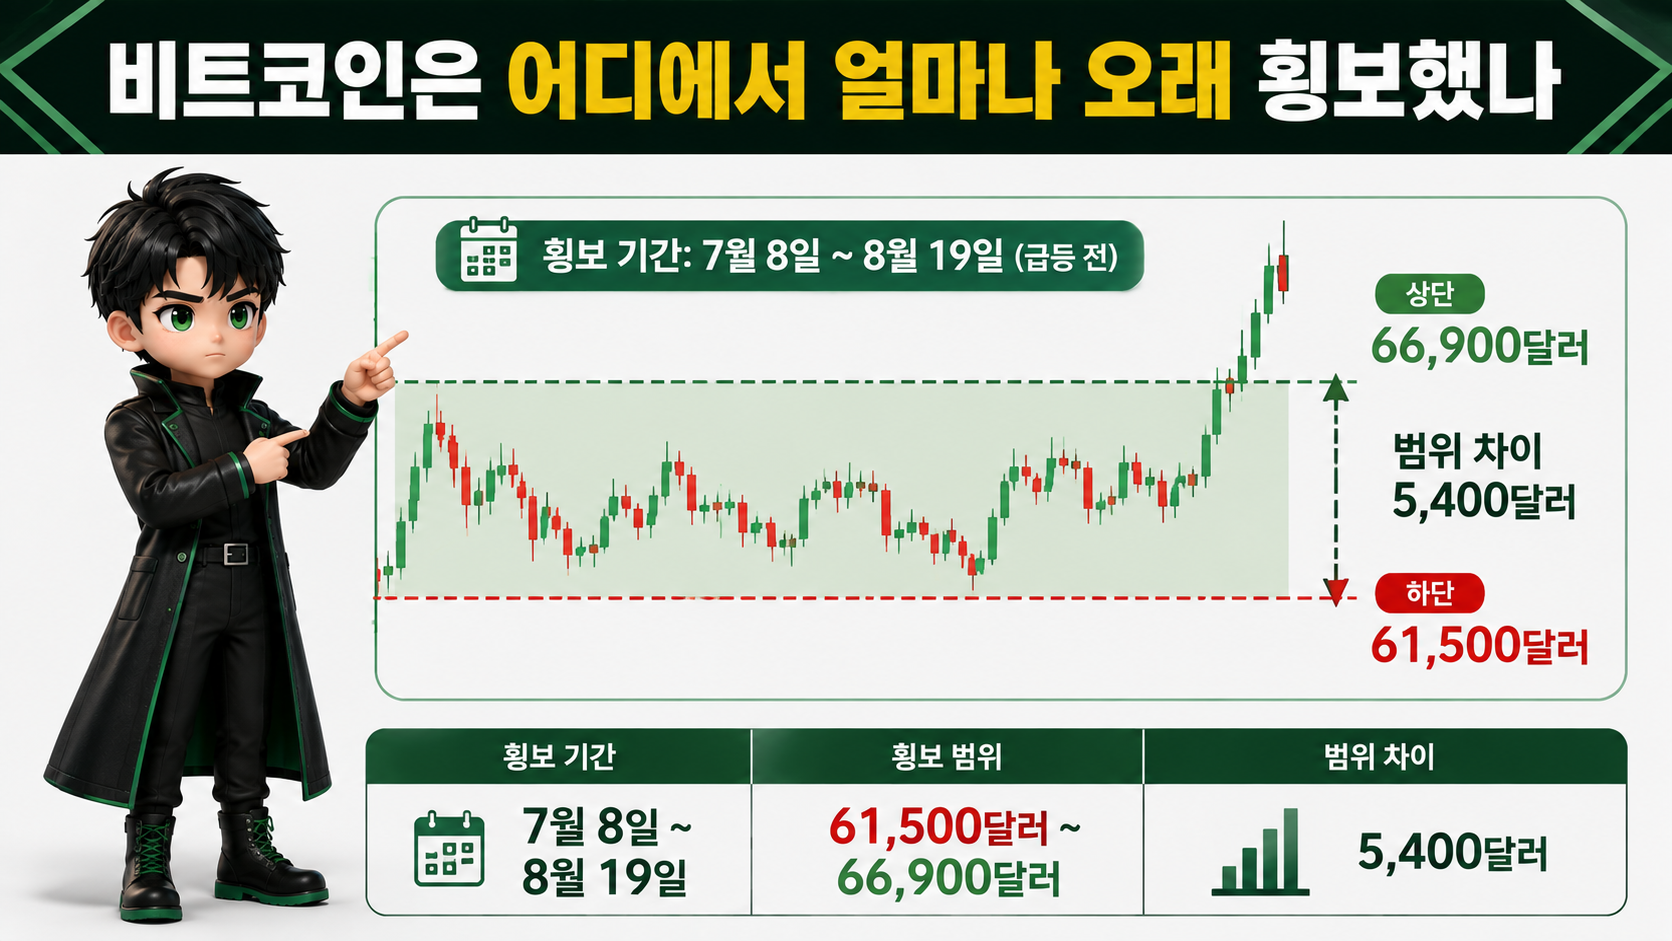
According to the author's calculations, using USD 61,500 as the lower boundary of the trading range, the distance to the upper boundary of USD 66,900 was approximately 8.78%.
The calculation is `(66,900-61,500) ÷ 61,500 × 100 ≈ 8.78%`.
As the price repeatedly moved back and forth within this range, volatility also declined significantly. Before the rally on August 19, Bitcoin showed such weak directional momentum that analysts described its volatility as having fallen to one of its lowest levels in years.
The significance of the recent rally, therefore, goes beyond a simple one-day price increase. What makes it different is that Bitcoin broke above a resistance level that had held for nearly 6 weeks.
There is, however, an important distinction. Breaking above a sideways trading range once is not the same as establishing a stable new uptrend. It is also necessary to see whether the price subsequently falls back into the previous range.
Why Does the Move Above USD 66,900 to USD 70,000 Matter?
Because the upper boundary of the previous trading range was approximately USD 66,900, Bitcoin has already moved beyond its former consolidation range. On August 19, Bitcoin reached USD 70,000 on some exchanges, marking the first time this level had been recorded since June 2. The price subsequently fell back below USD 70,000.
The difference between the upper boundary of the sideways trading range at USD 66,900 and USD 70,000 is USD 3,100.
According to the author's calculations, this represents a gain of approximately 4.63%.
`(70,000-66,900) ÷ 66,900 × 100 ≈ 4.63%`
Measured instead from the lower boundary of the trading range at USD 61,500 to USD 70,000, the increase is USD 8,500, or approximately 13.82%.
For this reason, it is more useful to examine whether the former resistance zone becomes a support zone than to focus solely on the USD 70,000 price level itself.
A brief move above USD 70,000 followed by a decline does not necessarily mean the breakout has failed. Conversely, the currently confirmed price data are not sufficient to conclude that a long-term bull market has begun simply because of a sharp one-day rally.
Which Price Levels Should Be Watched for a Continued Uptrend?
The first area to watch on the current chart is around 6만6,600~USD 66,900. USD 66,900 was the upper boundary of Bitcoin's recent 6-week trading range, while a separate technical analysis identified approximately USD 66,600 as the neckline of an inverse head-and-shoulders pattern.
The difference between these two reference levels is only USD 300. According to the author's calculations, that represents a difference of approximately 0.45% relative to USD 66,600.
In other words, rather than trying to identify one exact price point, treating the upper USD 66,000 range as a confirmation zone makes the current price structure easier to understand.
A chart presented by market technical analyst Aksel Kibar showed an inverse head-and-shoulders formation developing after the June low. If a breakout above approximately USD 66,600 is confirmed, the pattern produces a calculated technical target of USD 76,000. This is not a guaranteed price forecast but a technical target calculated from a specific chart pattern.
Based on the current price of approximately USD 69,300, the distance to USD 76,000 is around USD 6,700. According to the author's calculations, reaching that target would require an additional gain of approximately 9.7%.
The bullish scenario can therefore be divided into three stages.
Holding the upper USD 66,000 range → Breaking above USD 70,000 again and establishing support → Determining whether a new high forms above that level.
What matters is whether this sequence holds, rather than simply watching for the moment Bitcoin crosses USD 70,000.
If Bitcoin Falls Again, What Counts as a Normal Correction, and When Does the Price Structure Change?
The first area to monitor is once again the upper USD 66,000 range. If Bitcoin retreats to this area after its sharp rally and buying demand returns, the move could be interpreted as a typical post-breakout retest, in which former resistance becomes support.
Conversely, if the price falls back below USD 66,900 and remains within the previous sideways trading range, it will be necessary to reassess whether this rally has genuinely broken free of the former consolidation zone. This assessment is based on price structure and is not a definitive prediction of future prices.
The next important reference level is USD 61,500, the lower boundary of the previous sideways trading range. Because the range established after July 8 extended from 6만1,500~USD 66,900, a break below its lower boundary would suggest a greater deterioration in price structure than a simple failure to sustain the breakout above the upper boundary.
Using the current price of approximately USD 69,300, the author's calculations show a distance of about -3.5% to USD 66,900 and approximately -11.3% to USD 61,500.
At the current price, therefore, it makes more sense to consider downside levels alongside potential upside targets.
Whether the price holds above USD 70,000, whether the upper USD 66,000 range provides support, and whether the previous range's lower boundary at USD 61,500 holds represent signals at different stages.
What Changed Immediately Before This Sharp Rally?
On August 19, the U.S. Treasury announced that it would expand the size of its liquidity-support buybacks of longer-dated nominal Treasury securities. The program covers Treasury securities in the 10~20-year and 20~30-year maturity ranges. The purchase size, currently capped at USD 2,000,000,000 per operation, will increase to at least USD 4,000,000,000. The expanded operations are scheduled to begin on September 9.
Bitcoin rose sharply on the same day, reaching USD 70,000 during intraday trading. However, the fact that these two events occurred around the same time should be distinguished from a definitive claim that the Treasury announcement directly caused the entire Bitcoin rally.
The monetary policy environment also cannot be described as unambiguously favorable for Bitcoin. On August 19, the U.S. Federal Reserve released the minutes of its July 28–29 Federal Open Market Committee meeting.
When assessing current prices, therefore, it is important to check whether the breakout price levels actually hold, rather than drawing a firm directional conclusion based solely on the chart or a single macroeconomic development.
Is Bitcoin in a Bull Market Now, or Is This Still an Extension of Sideways Trading?
As of the afternoon of August 20, the interpretation most consistent with the price data is that Bitcoin has broken above its previous 6-week sideways trading range. However, because it has not remained above USD 70,000 for an extended period, it is still too early to conclude that a new medium-term uptrend has been fully confirmed.
Breaking down the situation by price level makes the current picture much simpler.
| Price Range | What to Watch |
|---|---|
| USD 70,000 or above | Whether the price holds after another breakout |
| 6만6,600~USD 66,900 | Zone for confirming whether the breakout above previous resistance is sustained |
| 6만1,500~USD 66,900 | Previous sideways trading range established after July 8 |
| Below USD 61,500 | Whether the price breaks below the lower boundary of the previous 6-week range |
The most immediate battle is between USD 70,000 and the upper USD 66,000 range.
If Bitcoin breaks above USD 70,000 again and holds that level, it will be possible to assess whether the breakout from the previous trading range is continuing. Conversely, if the price falls back below the upper USD 66,000 range and remains there, the market will once again test the previous consolidation zone.
Bitcoin can move by several percent within a single day, making it difficult to confirm a trend from one breakout or one candlestick alone. In leveraged trading in particular, substantial losses can occur during price fluctuations even when a trader correctly predicts the eventual direction.
At the current stage, the priority is not to decide in advance whether prices will rise or fall, but to observe which price boundaries Bitcoin crosses and whether it can actually hold those levels, step by step.
※ This article is provided for informational purposes to help readers understand market trends and does not constitute investment advice or a recommendation to buy or sell any particular security or asset. All final investment decisions and their associated responsibilities rest with the individual investor.