

If Bitcoin Spot ETFs See Outflows While Futures Open Interest Holds Steady, How Can We Distinguish a Rebound?
This post contains Coupang Partners affiliate links. We may earn a commission from qualifying purchases.
If Bitcoin spot ETFs experience outflows while futures open interest (OI) increases or remains elevated, this should not immediately be interpreted as a bullish signal. ETF fund flows reflect spot investment demand, while open interest represents the volume of futures contracts that have not yet been settled. When these two indicators diverge, it is important to distinguish whether price gains are driven by spot buying or changes in futures positions.
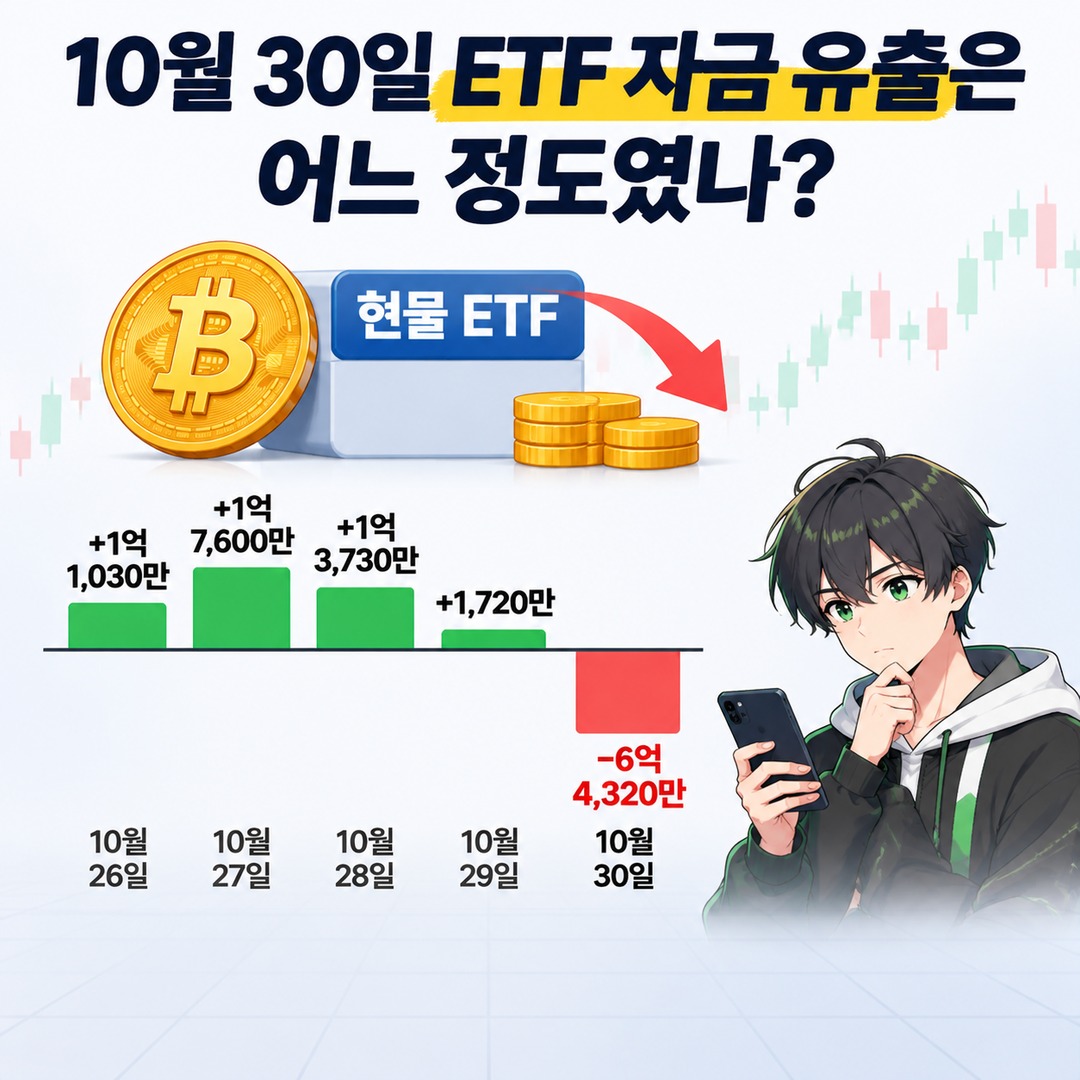
The latest completed ETF data available as of 2026-11-03 at 7 2 Korea Standard Time corresponds to the U.S. trading date October 30. On that day, U.S. Bitcoin spot ETFs recorded net outflows of approximately USD 643,200,000. However, the ETF data for trading date November 2 has not yet been confirmed as complete.
Therefore, it would be inappropriate to compare the currently confirmed fund outflows with real-time futures open interest as though they were finalized data for the same date.
October 30 ETF Outflows: How Significant Were They?
U.S. Bitcoin spot ETFs recorded net outflows of approximately USD 643,200,000 – USD 643,300,000 on October 30. Viewed in isolation, this represents a substantial daily outflow. However, the overall trend becomes clearer when it is considered alongside the inflows recorded over the preceding days.

The key figures available on the aggregated data page, which incorporates data from The Commoner ETF Tracker and Farside Investors, are as follows.
| U.S. Trading Date | Bitcoin Spot ETF Net Inflows / Outflows |
|---|---|
| October 26 | +USD 110,300,000 |
| October 27 | +USD 176,000,000 |
| October 28 | +USD 137,300,000 |
| October 29 | +USD 17,200,000 |
| October 30 | -USD 643,200,000 |
Unit: U.S. dollars. Minor differences may occur in some figures due to rounding by individual data providers.
The important point here is not just the outflow recorded on October 30.
Author's Calculations
Cumulative net inflows over October 26–29: +USD 440,800,000
Net outflows on October 30: -USD 643,200,000
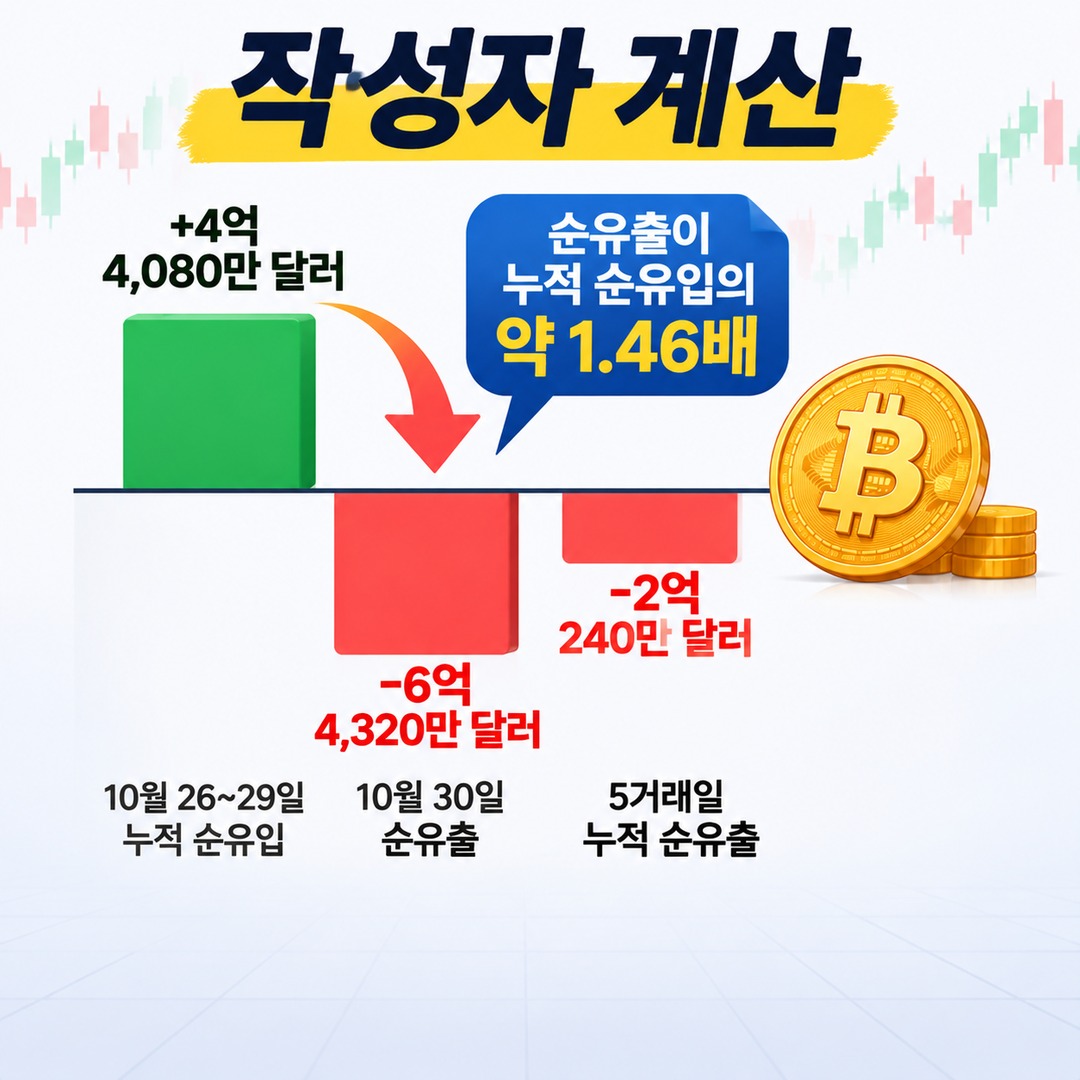
Cumulative net outflows over 5 trading days: -USD 202,400,000
The single-day net outflow was approximately 1.46 times larger than the cumulative net inflows recorded over the preceding 4 trading days.
In other words, funds had flowed into the ETFs during the preceding 4 trading days, but the substantial outflow on October 30 reversed the overall flow for that period into net outflows.
This is a noteworthy change when assessing investment demand for spot ETFs. However, these figures alone cannot establish the total selling volume across the entire Bitcoin market or determine the future direction of prices.
Why Rising Futures Open Interest Does Not Confirm an Uptrend
Futures open interest represents the total volume of futures contracts that have not yet been settled.
There is one important characteristic that must be understood here.
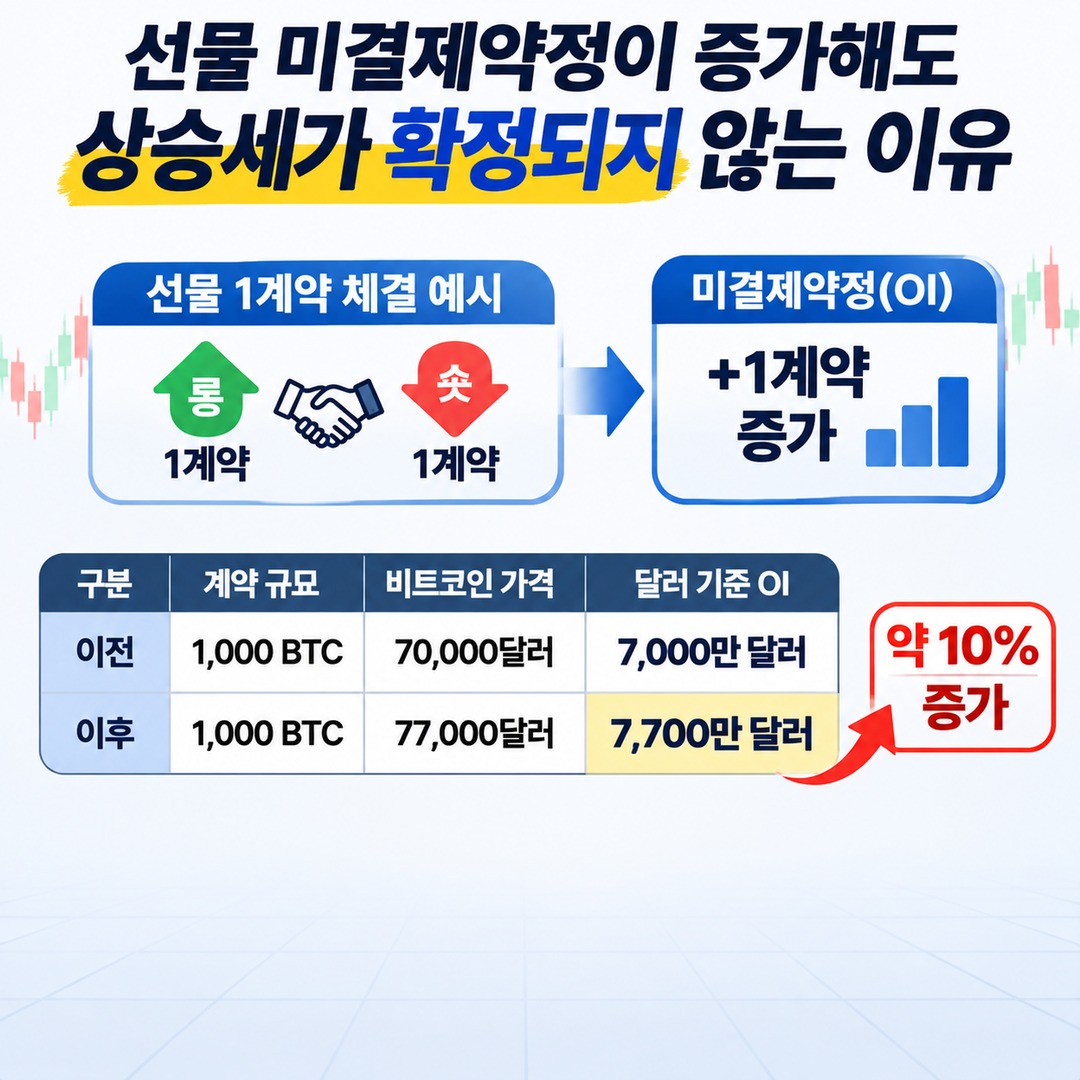
Every futures contract involves both a long position, representing a buyer, and a short position, representing a seller. Therefore, an increase in open interest does not mean that the market as a whole has more long positions than short positions.
CME Group's explanation of open interest also describes the metric in terms of newly created contracts and the settlement of existing contracts.
Consider the following example.
A buys 1 Bitcoin futures contracts.
B sells the same contracts.
When the two parties enter into new contracts, open interest increases by 1 contracts.
At this point, the market has both 1 long contracts and 1 short contracts.
The fact that open interest has increased does not, by itself, reveal which side is driving the market.
Therefore, even when ETF outflows and rising futures OI are observed simultaneously, they should not automatically be treated as evidence of incoming new buying demand.
Dollar-Denominated OI and Contract-Count OI Must Also Be Distinguished
This is an easily overlooked aspect when examining Bitcoin futures data.
Some data providers express open interest in dollar value. In that case, changes in the price of Bitcoin can cause dollar-denominated open interest to change even when the number of contracts remains unchanged.
Consider the following hypothetical calculation.
Futures contract size: 1,000 BTC
Bitcoin price: USD 70,000
Dollar-converted OI: USD 70,000,000
If the price of Bitcoin subsequently rises to USD 77,000 while the number of contracts remains unchanged, the figures would be as follows.
Futures contract size: 1,000 BTC
Bitcoin price: USD 77,000
Dollar-converted OI: USD 77,000,000
The number of contracts remains unchanged, but dollar-denominated OI increases by 10%.
This is a simple hypothetical calculation, not an outcome that occurred in the actual market. Fees and contract-specific multipliers have been excluded.
Therefore, when observing a Bitcoin price rebound alongside an increase in OI, it is important to check the contract size denominated in BTC as well as the dollar-denominated figures.
Four Scenarios for Interpreting Price Movements When ETF Outflows and OI Changes Diverge
When assessing a Bitcoin rebound, it is useful to first distinguish the direction of price movements from the direction of changes in open interest.
| Bitcoin Price | OI | Possible Interpretation |
|---|---|---|
| Rising | Increasing | Growth in new contracts, hedging activity, or leveraged participation |
| Rising | Decreasing | Possible short liquidations or closure of existing positions |
| Falling | Increasing | More new contracts, possible short participation or hedging |
| Falling | Decreasing | Possible long liquidations or position reductions |
These four combinations classify situations that can be observed in the market. They are not formulas that can establish the actual intentions behind specific positions.
In particular, two situations need to be distinguished.
What If Prices Rise While OI Falls?
One possibility worth examining is that prices are rising as existing short positions are being closed.
Traders holding short positions must buy contracts to close them. These buy orders can contribute to upward price movements.
However, it would be incorrect to conclude that every price increase is caused by short covering.
Spot trading volume, liquidation data, and futures trading volume should also be examined.
What If Prices and OI Rise Together?
This indicates that new futures contracts are being created.
It could mean that more participants are entering an upward trend, but it could also reflect increased hedging or arbitrage activity.
Therefore, rising prices combined with increasing OI alone are not enough to establish that the market is experiencing a healthy, spot-driven rally.
What Additional Data Should You Check to Confirm a Genuine Rebound?
When ETF fund flows and OI move in different directions, it is useful to examine three additional sets of data.
First, Spot Trading Volume and Spot Buying Activity
Even if Bitcoin prices rise, it is difficult to assess the sustainability of the rally if spot trading volume does not increase alongside them.
It is worth examining trading volumes across multiple spot exchanges together with the flow of executed buy and sell orders.
Second, Funding Rates and the Futures Basis
Funding rates are payments exchanged between long and short positions in perpetual futures markets.
Generally, when the funding rate is positive, longs pay shorts; when it is negative, shorts pay longs.
If funding rates rise rapidly alongside Bitcoin prices, it is worth checking whether long positions are becoming heavily concentrated in the futures market.
The futures basis is the difference between futures prices and spot prices. Monitoring whether this gap widens can also help assess the level of participation in the futures market.
Third, Monitor Liquidation Volumes Alongside Changes in OI
If substantial short liquidations occur and OI declines while prices are rising, it is worth considering whether the closure of existing positions contributed to the price increase.
Conversely, if prices rise while OI increases and funding rates also climb, check whether new positions are expanding and leverage is becoming concentrated.
CoinGlass Bitcoin futures data can be used to check actual OI and funding rates across exchanges.
However, aggregate OI across exchanges reported by CoinGlass and Bitcoin futures OI reported by CME have different coverage and contract structures. Their figures should not be compared as though they were identical measures.
November 3 Time Differences in the Data That Needs to Be Checked
One particularly important point in this analysis is that ETF data and futures data are released at different times.
U.S. spot ETF fund flows are compiled according to U.S. stock market trading days and can be reviewed after the creation and redemption data from individual issuers have been incorporated.
By contrast, futures open interest is updated at different times depending on the exchange and data provider.
According to CME Group's guidance on trading volume and open interest, preliminary daily volume and open interest figures may differ from the official daily figures released on the following business day.
Therefore, if you are checking the market on the morning of November 3, the following sequence is a reasonable approach.
1. Confirm October 30 as the latest available finalized data on net ETF outflows.
2. Check whether the creation and redemption figures for November 2 U.S. trading day have been fully reported.
3. Distinguish between futures OI measured in U.S. dollars and OI measured by contract count.
4. Compare Bitcoin price movements with spot trading volume.
5. Add funding rate and liquidation data to assess positioning imbalances in the futures market.
During this process,
※ This article is intended as general information for understanding market trends and does not constitute an investment recommendation for any specific security or asset. You are responsible for your own final decisions and investment risks.
This post contains Coupang Partners affiliate links. We may earn a commission from qualifying purchases.