

Bitcoin Outlook and Sideways Trading: Key Levels to Watch in the USD 60,000 Range
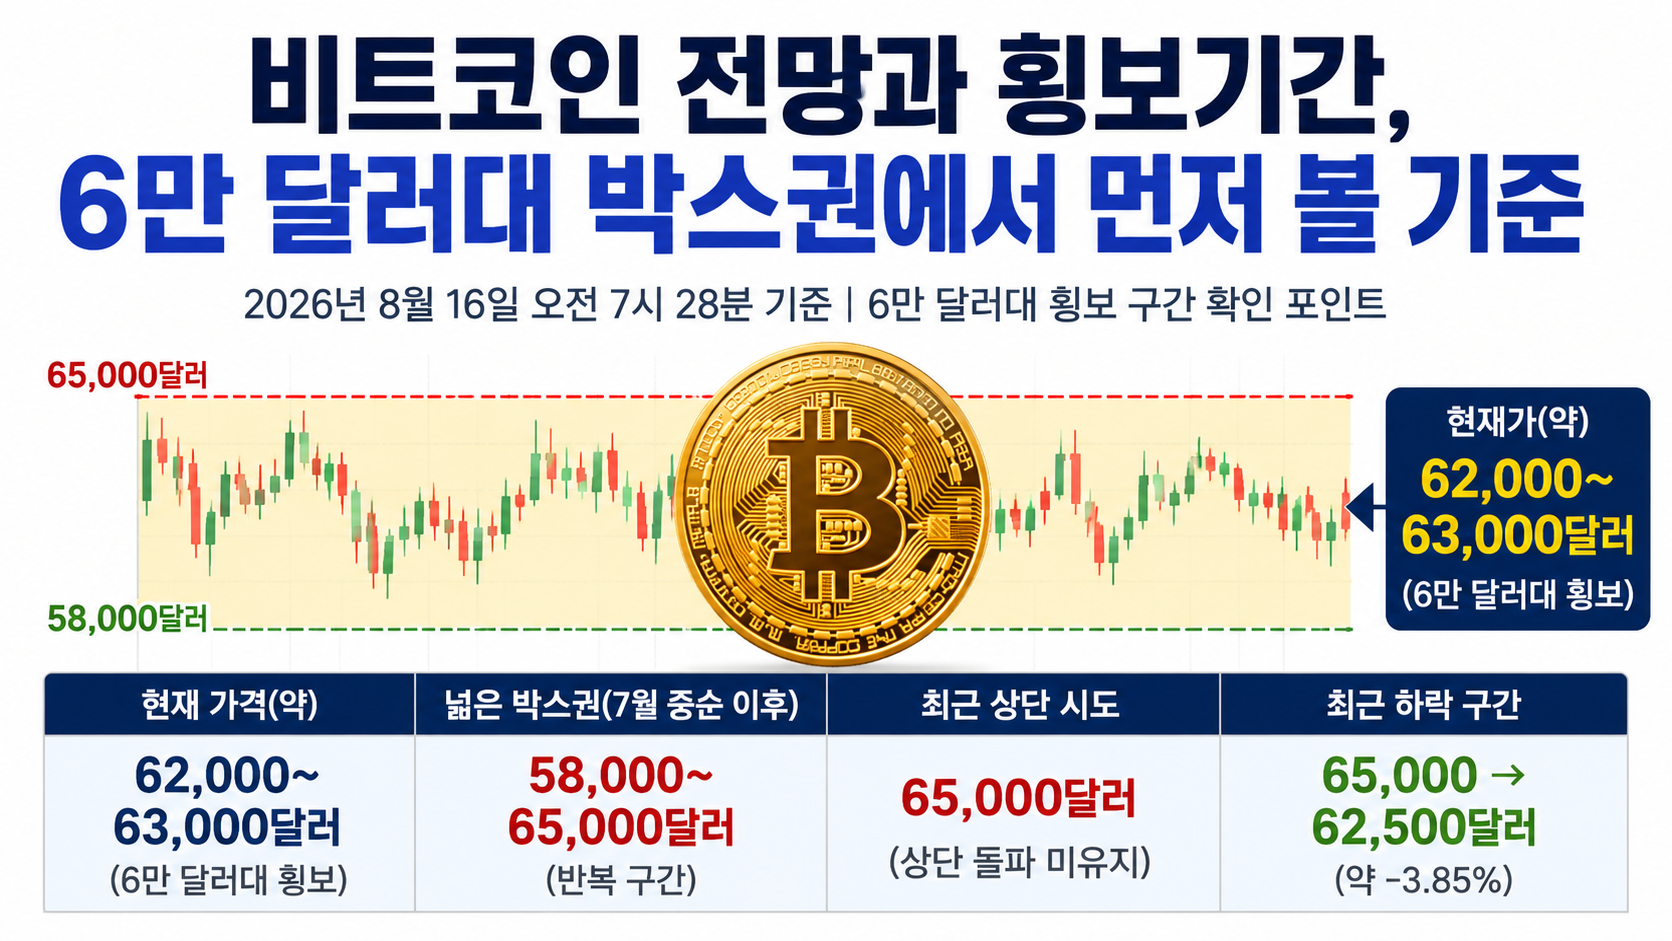
As of 7:28 a.m. Korea time on 2026-08-16, Bitcoin is trading around 6,2–USD 63,000. Since mid-July, the 5,8–USD 65,000 range has appeared repeatedly, and recent attempts to sustain a rally above USD 65,000 have failed. Rather than choosing a single bullish or bearish price target, the priority now is to see which direction Bitcoin breaks out of the USD 60,000 trading range and whether it can hold there.
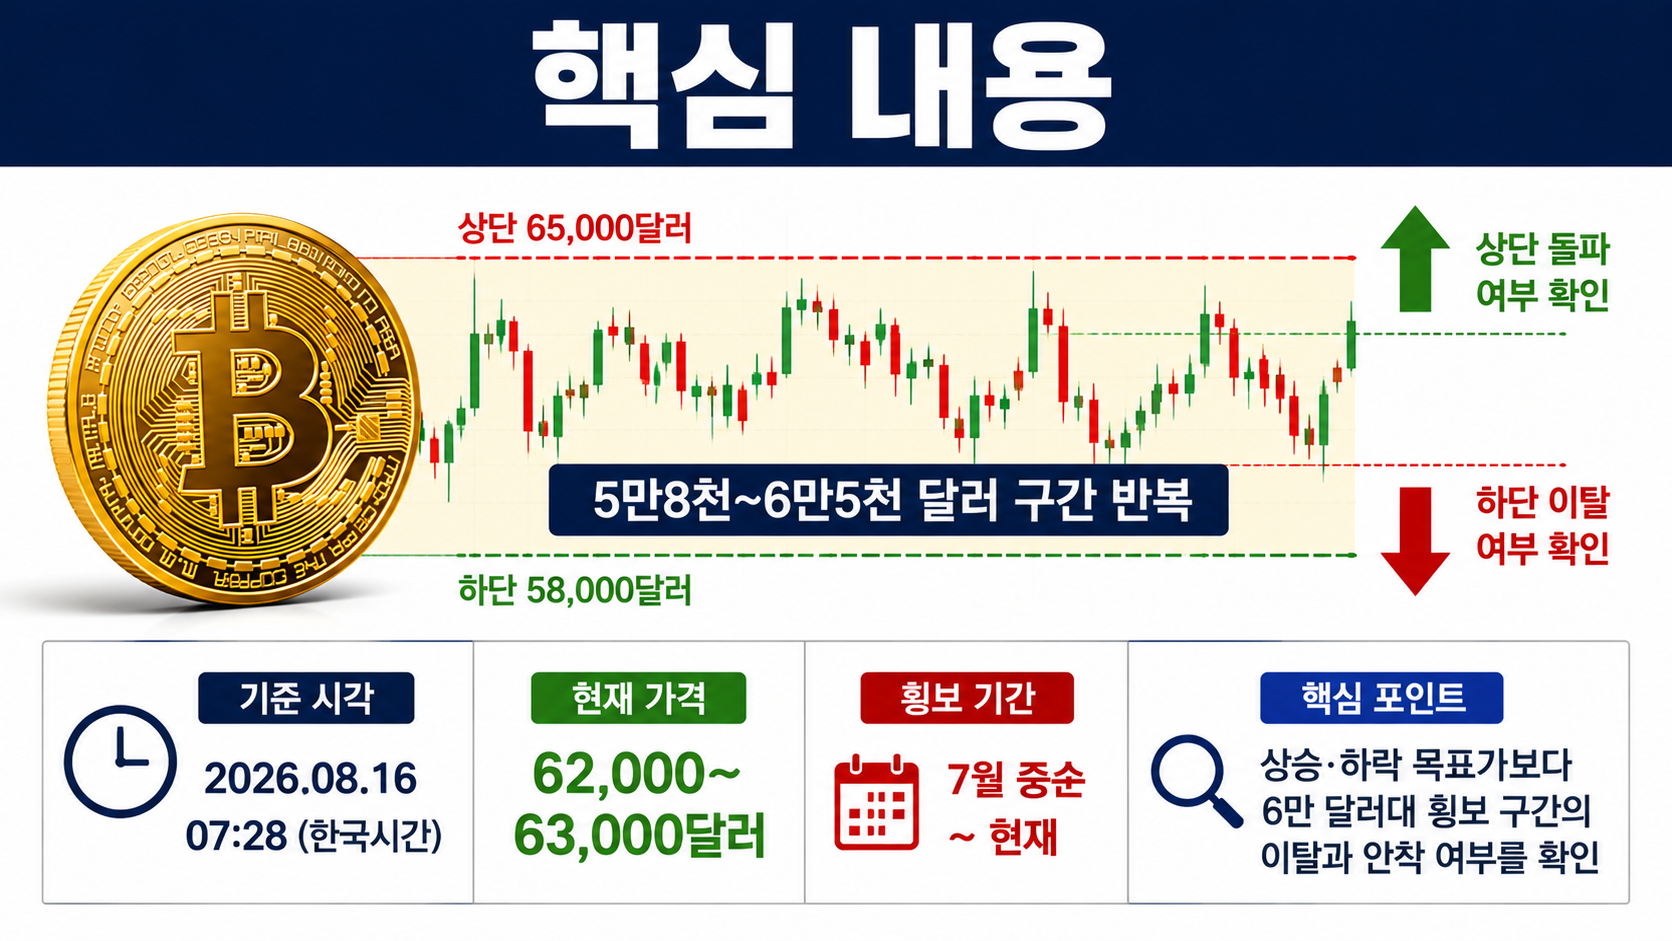
Short-term prices cannot be predicted with certainty. Bitcoin prices can vary depending on the exchange and reference time, and forecasts differ considerably. Accordingly, this article does not recommend buying or selling. Instead, it focuses on how to assess the current sideways trading range using publicly available price and market data.
How Long Has Bitcoin Been Trading Sideways?
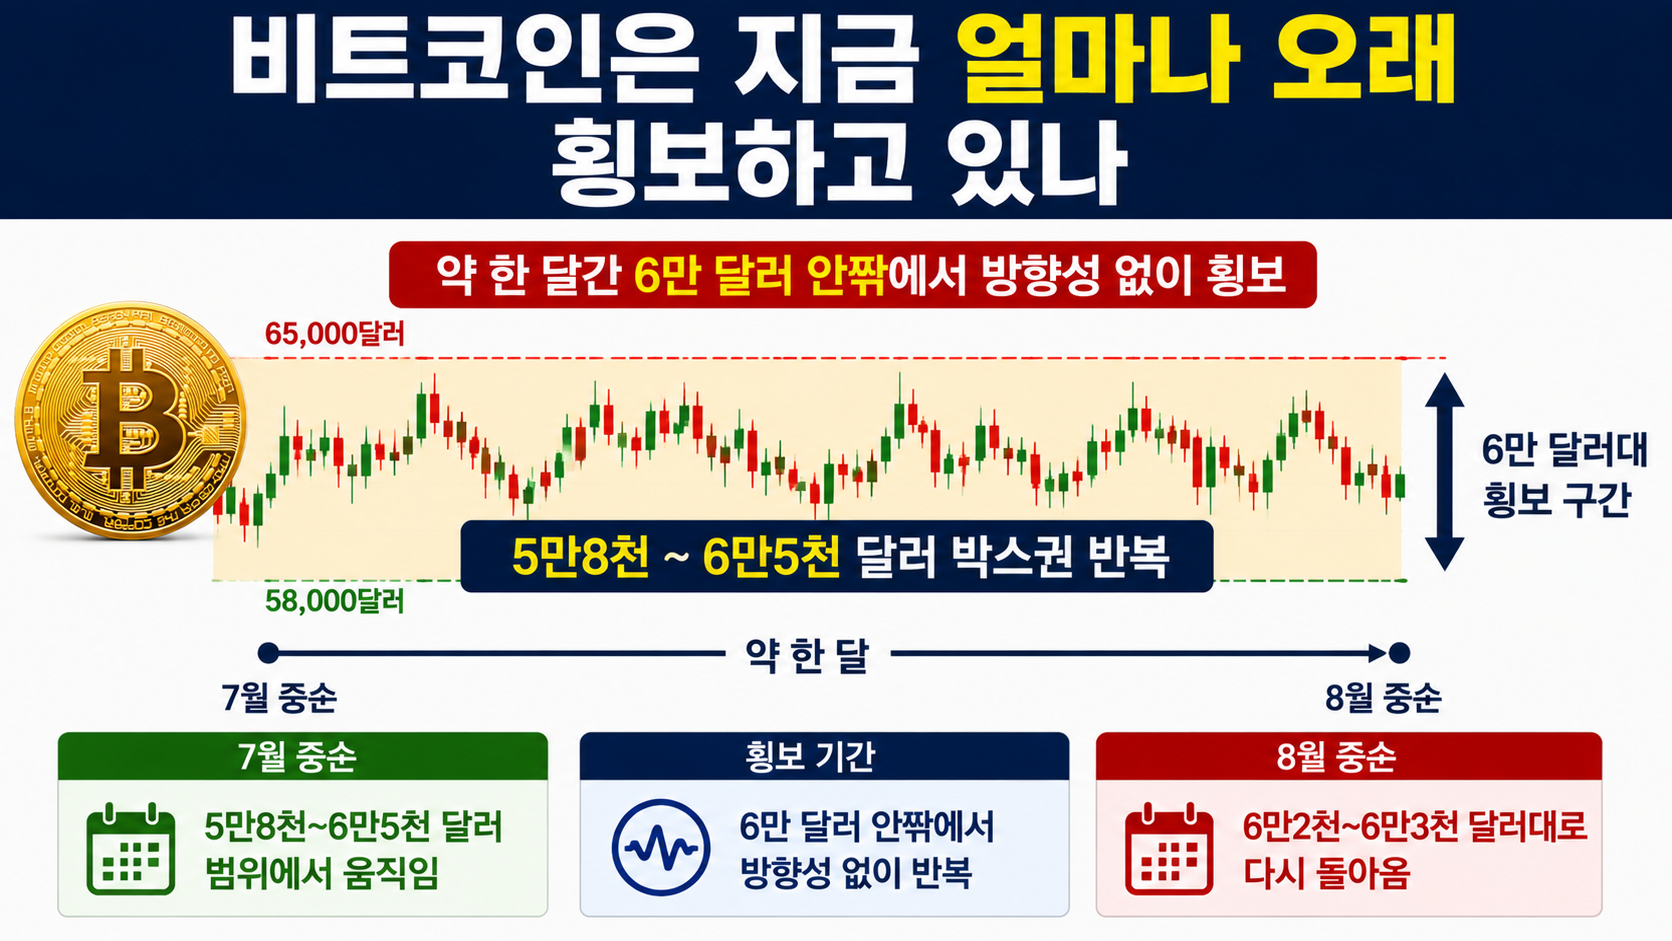
Looking at the broader trend, Bitcoin has spent roughly a month fluctuating around USD 60,000 without establishing a clear direction. In mid-July, Bitcoin traded within approximately 5,8–USD 65,000, and by mid-August, it had returned to around 6,2–USD 63,000.
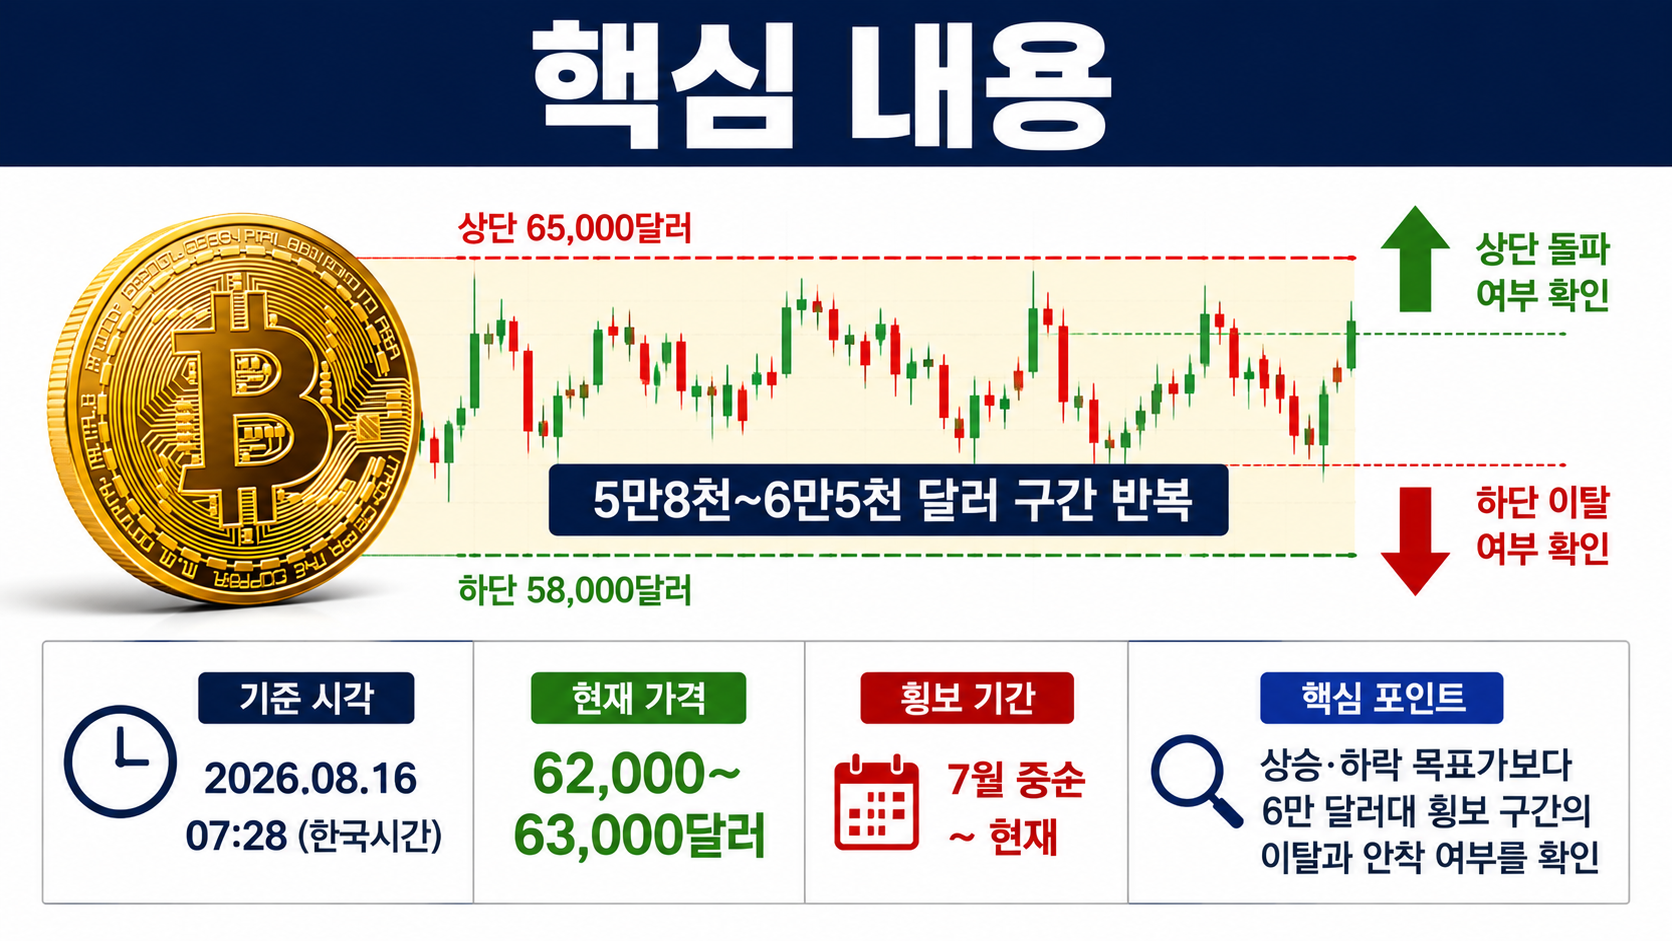
Looking only at the second week of August, the range was narrower. After the August 8 closing price of USD 64,873.89, Bitcoin fell to USD 63,322 on August 12. By August 14, its price had declined from approximately USD 65,000 at the beginning of the week to around USD 62,500. The real-time price at the August 16 observation point was also in the upper USD 62,000 range.
The important point is not to identify the exact day sideways trading began. Some investors may define 5,8–USD 65,000 as a broad trading range, while those examining a shorter period may use the recent 6,2–USD 65,000 range.
Therefore, rather than asking how many days Bitcoin has been moving sideways, investors should first establish which price range they are using to define sideways trading.
Does Breaking Above USD 65,000 Mean Sideways Trading Is Over?
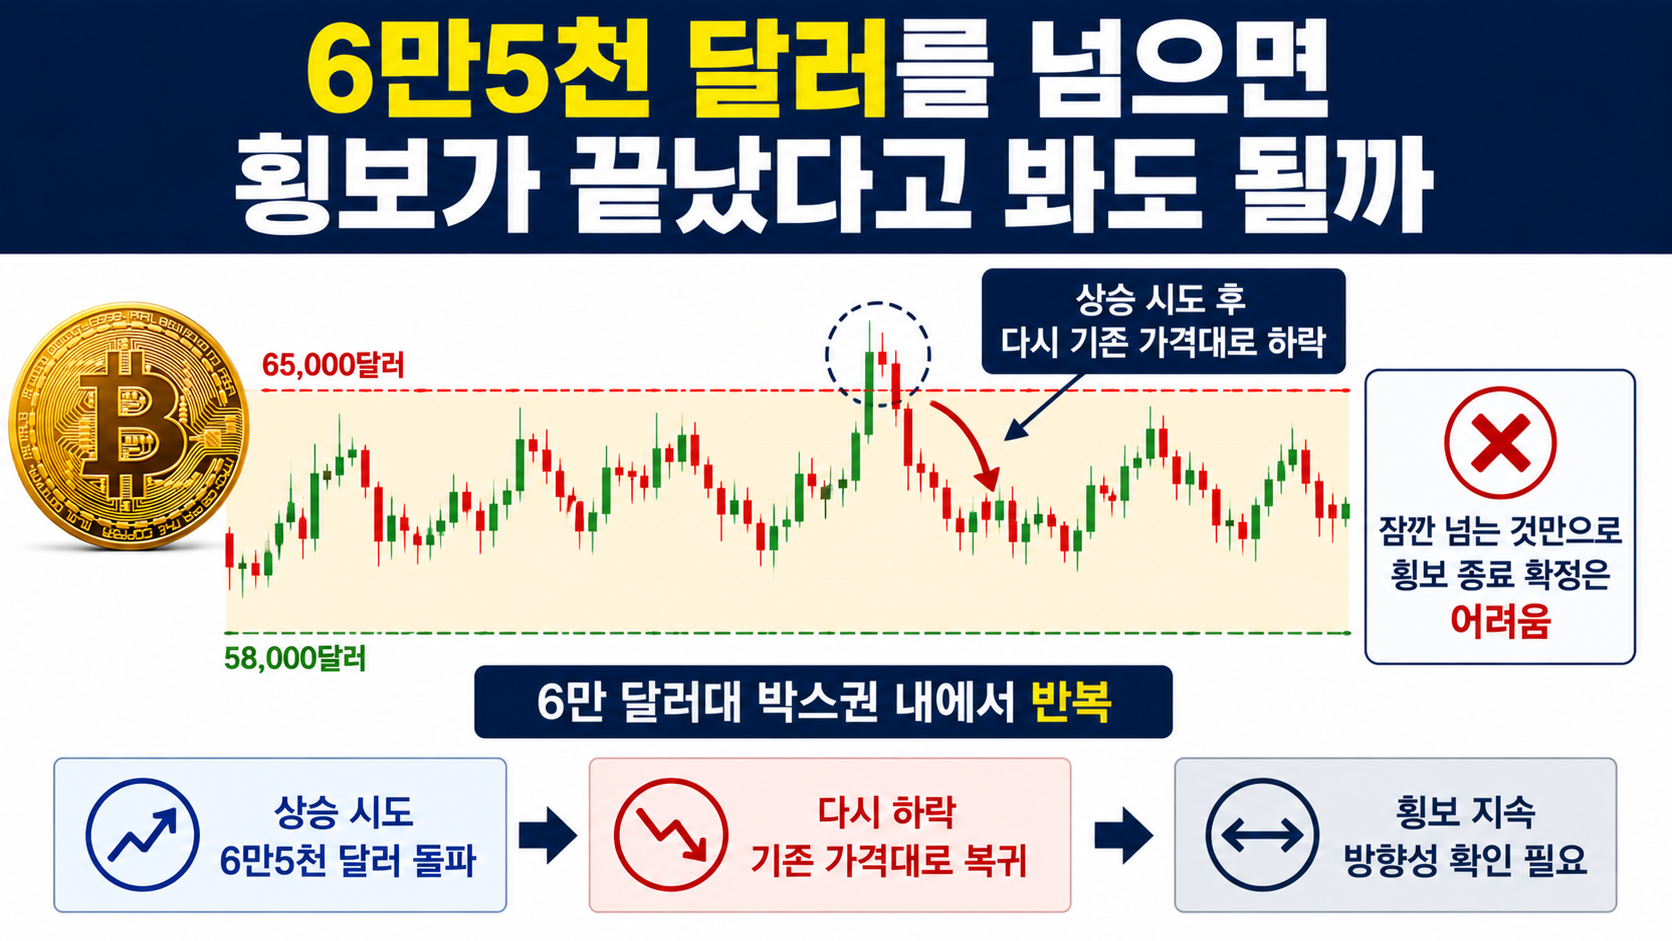
A brief move above USD 65,000 is not enough to confirm that sideways trading has ended. Recent price action has shown Bitcoin attempting to rally before falling back into its previous trading range.
On August 8, Bitcoin closed at USD 64,873.89, moving above both its 50-day moving average and the descending trendline extending from the October high of the previous year. However, on August 12, it fell to USD 63,322, slipping back below both technical levels.
This movement demonstrates why whether prices hold after a breakout matters more than a brief intraday move above resistance in a sideways market.
When monitoring the USD 65,000 level, it is therefore better to check whether the price remains above it through the next trading day and whether an area that previously acted as resistance subsequently provides support, rather than focusing on a single number.
The same principle applies in the opposite direction. If Bitcoin falls toward USD 60,000 but quickly recovers, the existing range may remain intact. However, if prices continue trading below that level, the established range may need to be redefined.
In other words, the key test for the end of sideways trading is not whether Bitcoin touches a particular price once, but whether trading continues outside the previous range.
Do Recent Prices Favor an Upward or Downward Move?
Based solely on short-term prices observed through mid-August, it is difficult to conclude that a strong upward trend has been established. The rally attempted on August 8 did not hold, and by August 14, Bitcoin had fallen from approximately USD 65,000 at the start of the week to around USD 62,500.
According to the author's calculation, the difference between USD 65,000 and USD 62,500 is USD 2,500.
The formula is `(62,500 - 65,000) ÷ 65,000 × 100`, producing approximately -3.85%.
However, a decline of approximately 3.85% alone does not confirm a larger downward trend. Bitcoin remains within the broad 5,8–USD 65,000 range observed since mid-July.
For this reason, rather than immediately choosing between a bullish and bearish outlook, the current market is better understood as a period for identifying where the lower boundary forms while attempts to break above the upper boundary repeatedly fail. This interpretation is more consistent with recent price action.
Why Bitcoin Price Forecasts Differ So Widely
Bitcoin forecasts for 2026 vary substantially among institutions and analysts. A comparison of forecasts published through July 23 showed a wide range, from bearish scenarios of 3,8–USD 39,000 to bullish projections of 20–USD 250,000.
It would be inappropriate to average these figures into a single market consensus price because the forecasts rely on different assumptions and time horizons.
Some projections apply the magnitude of previous bear-market declines to current conditions, while others assume increased institutional investment or long-term adoption. Indeed, some major institutions that revised their forecasts during 2026 lowered their previous price targets.
Rather than focusing on a single figure for how high Bitcoin might rise in 2026, investors should examine the assumptions underlying each forecast.
With Bitcoin currently trading around USD 62,000, a year-end price target above USD 100,000 does not guarantee that Bitcoin will reach that level. Conversely, the existence of a bearish scenario around USD 30,000 does not mean prices will necessarily fall that far.
Forecasts are best understood as conditional scenarios rather than guaranteed price targets.
What Should Investors Monitor During Sideways Trading?
In a sideways market, a practical approach is to consistently monitor the upper boundary, lower boundary, and whether a breakout holds, rather than repeatedly changing price targets.
Based on currently available data, the broad 5,8–USD 65,000 range observed since mid-July can serve as a reference. For a narrower assessment focused on recent price action, the 6,2–USD 65,000 range is worth monitoring first.
Three possible scenarios can be considered.
If Bitcoin moves back above USD 65,000 and holds that level, investors should assess whether the move differs from the recent pattern of failed breakouts. The key is not to declare a trend reversal based on a brief intraday move above resistance.
If Bitcoin continues fluctuating between 6,2 and USD 65,000, there is a strong case for interpreting the market as still trading sideways. Attempting to predict the next direction prematurely can increase the risk of losses as prices repeatedly move between the upper and lower boundaries.
If Bitcoin falls below USD 62,000, investors should examine whether the lower boundary of the broader range is being tested again, rather than immediately concluding that a long-term downtrend has begun. The wider trading range observed in mid-July extended into the USD 58,000 range.
These price levels do not guarantee future support or resistance. They are reference points derived from observed trading activity to help assess subsequent market movements.
How Should US Interest Rates and Spot Bitcoin ETFs Be Interpreted?
US monetary policy and capital flows into spot Bitcoin exchange-traded funds are useful variables to monitor when assessing Bitcoin's short-term direction. However, neither factor should be assumed to move Bitcoin prices in the same direction every time.
Following the release of US inflation data in July, some assessments suggested that pressure on the Federal Reserve to raise interest rates immediately in September had eased. Nevertheless, Bitcoin failed to establish a substantial rally at the time. This provides a real-world example of how Bitcoin does not necessarily follow broader macroeconomic developments in a predictable direction.
Likewise, a single day's net inflows or outflows from spot Bitcoin ETFs are insufficient to confirm a trend. Daily data published in June and July showed alternating net inflows and outflows.
Monitoring whether ETF capital flows remain positive over several trading days while Bitcoin breaks above the upper boundary of its range, or whether outflows persist as prices decline, provides more information than focusing on a single day's figures.
How to Confirm Whether Bitcoin's Sideways Trading Has Ended
At this stage, the most important question is not how high Bitcoin will eventually rise, but whether it has actually broken out of its current trading range.
At the 2026-08-16 observation point, Bitcoin was trading in the upper USD 62,000 range, and its recent attempt to rise above USD 65,000 had failed to hold. At the same time, it had not completely moved outside the broad 5,8–USD 65,000 range observed since mid-July.
A straightforward sequence can therefore be used to determine whether sideways trading has ended.
First, check whether Bitcoin moves back above the recent upper boundary near USD 65,000. Next, confirm whether the breakout price holds. If prices move lower, monitor whether Bitcoin remains below USD 62,000 and whether it approaches the lower boundary of the broader July trading range.
US monetary policy announcements and spot Bitcoin ETF capital flows can then be added as supporting indicators.
The longer sideways trading continues, the easier it becomes to assume that a major move is imminent. However, the duration of sideways trading alone does not determine the direction of the next move. At a time when forecasts vary as widely as they do now, using a framework that confirms a breakout and sustained trading outside the range before making a decision provides greater clarity than relying on price targets.
Bitcoin is a highly volatile asset with significant potential for losses. The price ranges and calculations above are reference points based on publicly available market data, intended to help readers understand current conditions. They do not guarantee profits, price appreciation, or any particular trading outcome.
※ This article is provided for informational purposes to help readers understand market trends and does not constitute investment advice or a recommendation to invest in any particular security or asset. All final investment decisions and associated responsibilities rest with the individual investor.