

When Is RSI Divergence Confirmed? Why Price Must Break a Previous High or Low
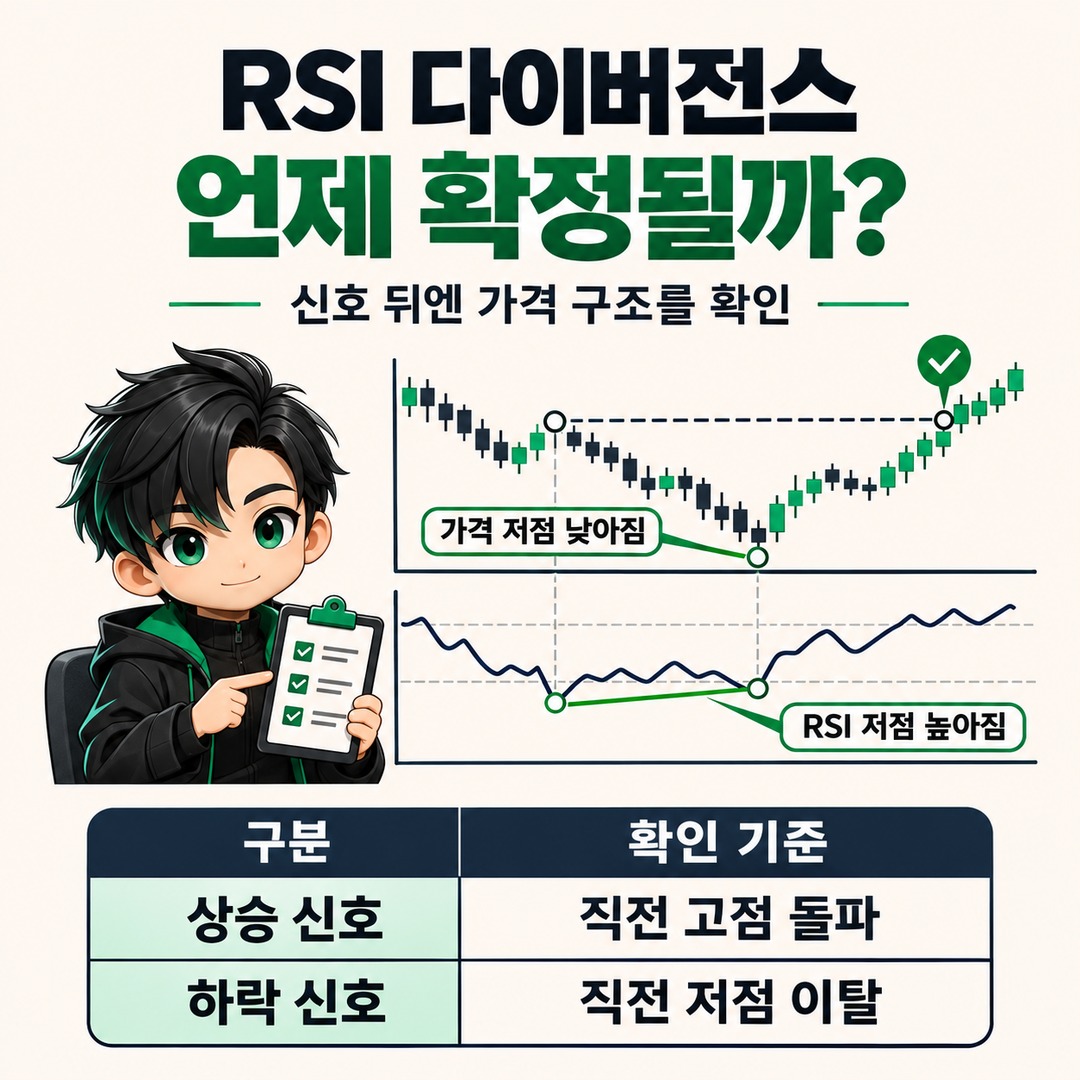
RSI divergence can be spotted when price and the RSI move in opposite directions, but that alone does not confirm a trend reversal. In practice, it is important to check whether price breaks the previous swing high or low after divergence appears. It is also important to understand why a signal may disappear from a chart or be confirmed later.
cuntegn## Under What Conditions Should RSI Divergence Be Confirmed?
To confirm RSI divergence, compare two price highs or two price lows with the corresponding RSI highs or lows.
The main types are as follows.
| Type | Price movement | RSI movement |
|---|---|---|
| Regular bullish divergence | Lower low | Higher low |
| Regular bearish divergence | Higher high | Lower high |
| Hidden bullish divergence | Higher low | Lower low |
| Hidden bearish divergence | Lower high | Higher high |
Regular divergence indicates a possible weakening of the existing trend, while hidden divergence is used to assess the possibility that the existing trend will continue.
The important point is that the comparison points for price and the RSI must correspond to each other.
Comparing lows on the price chart with highs on the RSI does not produce a valid divergence reading.
Also, rather than assuming that both points must form an extreme on the same candle, check whether they belong to swing intervals corresponding to the same market movement.
Why Divergence Appears Later: Pivot Confirmation
The point where divergence occurs on a chart and the time when the signal actually appears may differ. A common reason is the way a pivot is confirmed.
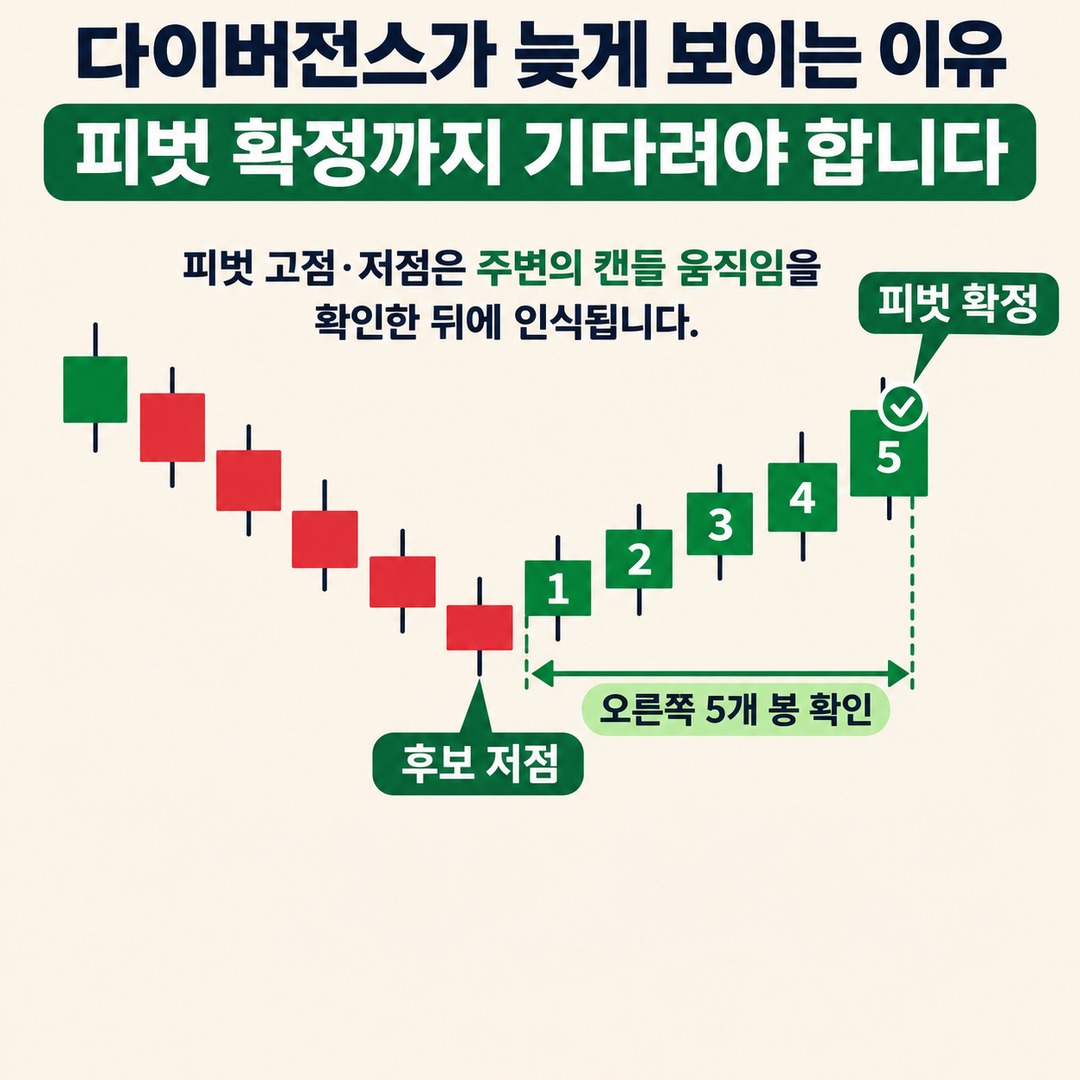
A pivot is confirmed as a high or low after the movements of surrounding candles have been checked.
For example, if the setting checks 5 candles to the left and 5 candles to the right, the candidate low can be confirmed only after the 5 candles to its right have completed.
Example of Pivot Confirmation Delay
Candidate low forms
Check 5 more candles

Pivot confirmed
Candle 100, candles 101–105, candle 105
A hypothetical example with right-side confirmation set to 5 candles
Some indicators display the signal at the location of the earlier 100 candle. As a result, looking only at the historical chart may make it seem as if the signal appeared immediately at the low.
In reality, however, the pivot was confirmed only after the 105 candle had been checked.
TradingView's explanation of pivots also states that highs and lows are determined by checking the candle movements on both sides of the reference candle.
Converted into time, this works out as follows:
On a 5-minute chart, checking 5 candles to the right: 25 minutes
On a 15-minute chart, checking 5 candles to the right: 75 minutes
On a daily chart, checking 5 candles to the right: 5 trading day

This is an example of calculating the time needed to confirm a pivot; not all RSI indicators use the same settings.
Therefore, do not assume that a signal displayed at a historical point on the chart could also have been confirmed at that same time in real time.
Why Price Must Break the Previous High or Low
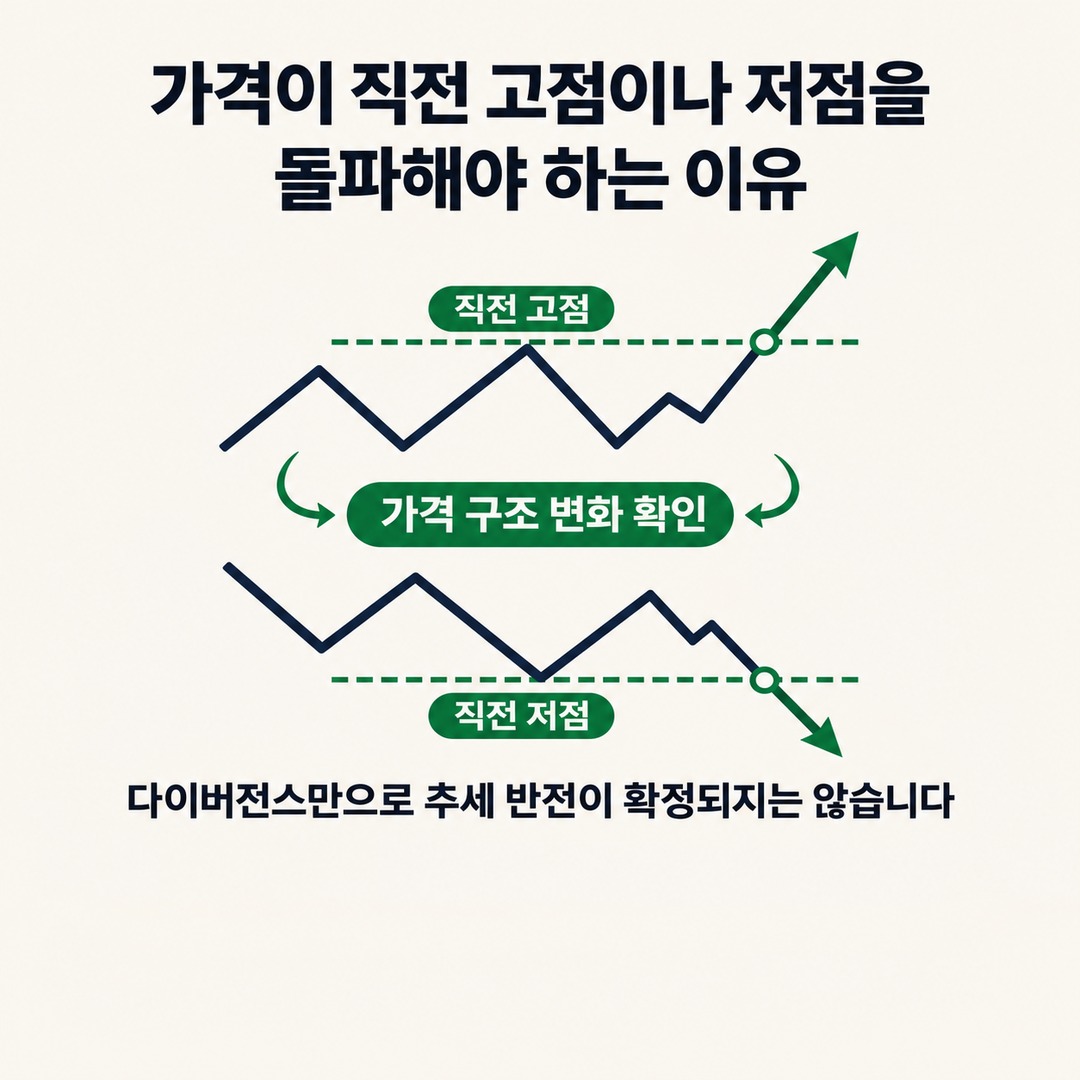
Once divergence forms, the next thing to check is a change in price structure.

A bearish divergence does not mean that a downtrend has started immediately. Price may continue rising while forming bearish divergence several times.
Conversely, price may continue falling even after bullish divergence appears.
The following sequence can be used to check for confirmation.
How to Confirm Bearish Divergence
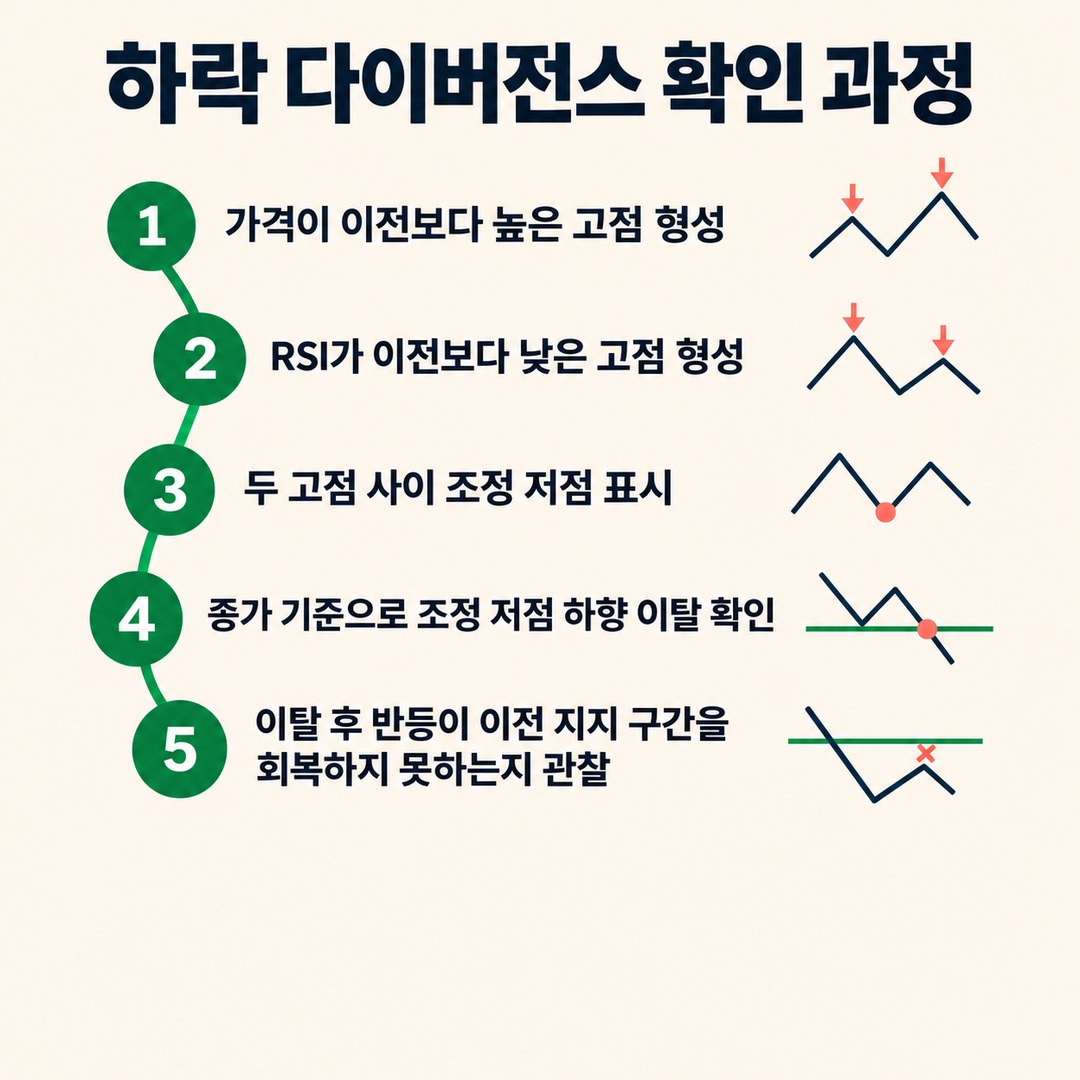
1. Price makes a higher high than the previous high.
2. The RSI makes a lower high than the previous high.
3. Mark the corrective low between the two highs.
4. Then check whether price breaks below the corrective low on a closing basis.
5. Observe whether price fails to recover the previous support area, even if it rebounds after the break.
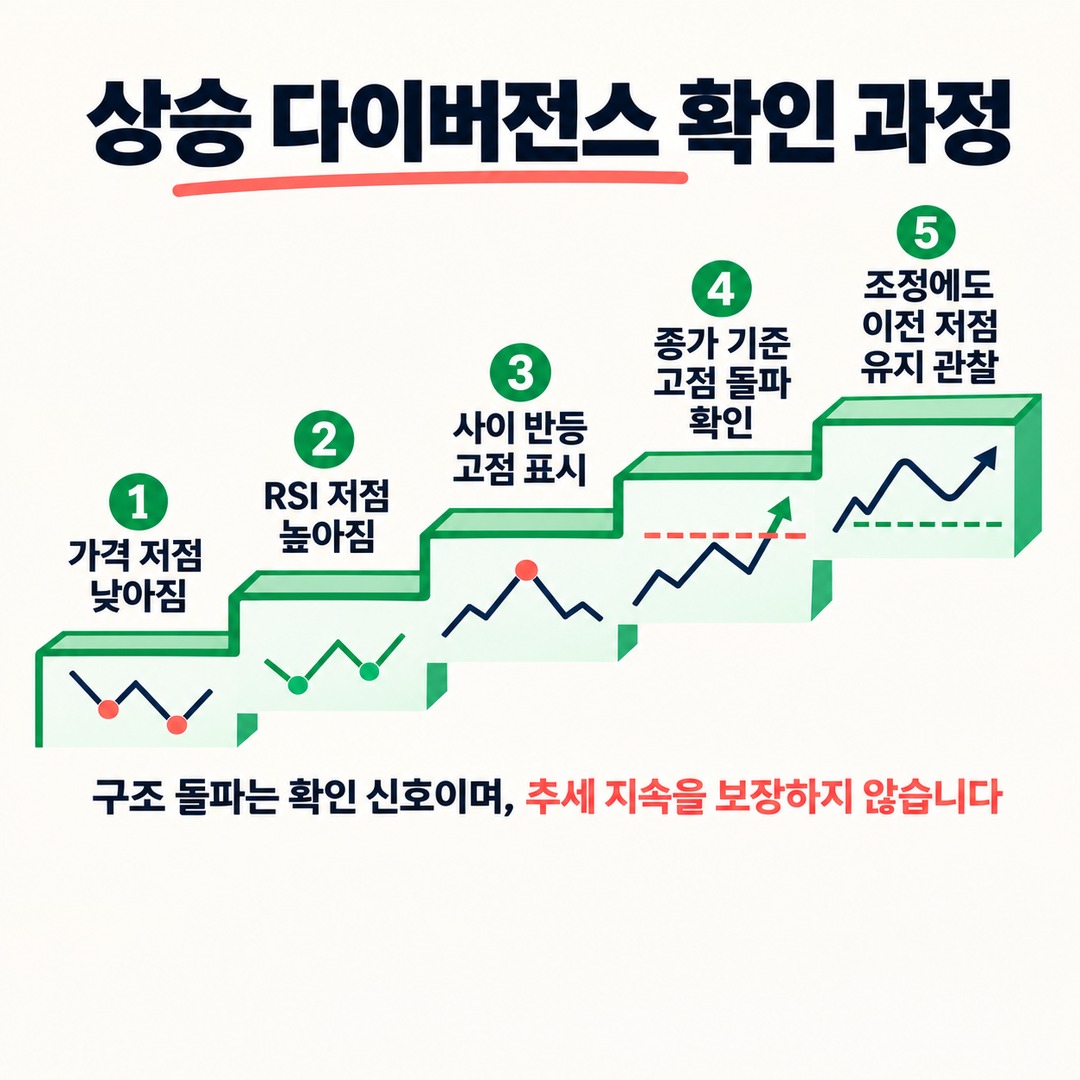
How to Confirm Bullish Divergence
1. Price makes a lower low than the previous low.
2. The RSI makes a higher low than the previous low.
3. Mark the rebound high between the two lows.
4. Then check whether price breaks above the rebound high on a closing basis.
5. Observe whether price stays above the previous low during any pullback after the breakout.
A break in price structure is an additional way to check for the possibility of a trend reversal; it does not guarantee that an uptrend or downtrend will follow.
StockCharts also explains that after RSI divergence, a break of a key price level can be used to confirm weakening momentum.
Earlier Confirmation Is Not Always Better
Methods for confirming divergence differ in how quickly they treat a signal as confirmed.
| Confirmation method | Characteristics | Caution |
|---|---|---|
| Reversal candle | Relatively quick response | Could be a temporary rebound |
| Break of a short-term trendline | Observes a change in momentum | Trendline placement is subjective |
| Break of the previous swing high or low | Confirms price structure | May lead to a later entry |
| Confirming the close of a higher-timeframe candle | Reviews the broader trend | Increases opportunity cost and waiting time |
A faster confirmation method can respond early in a price move, but it may expose you to false signals.
By contrast, waiting for a break of the previous swing high or low takes longer to confirm, but lets you also assess whether price structure has changed.
No single method can be called superior in every situation.
In particular, for highly volatile assets, an intraday break above a high and a break confirmed at the close can produce different results.
4 Common Situations in Which RSI Divergence Fails
1. Repeated Signals Against a Strong Trend
In a strong uptrend, price may continue rising even if bearish divergence appears several times.
Bullish divergence may also appear repeatedly during a downtrend.
StockCharts' RSI guide explains that divergence can be misleading in a strong trend and describes cases where an uptrend continued despite several bearish divergence signals.
2. Judging a Signal Before the Candle Closes
During the trading session, both price and the RSI continue to change.
A high or low observed before a candle closes may not be the final swing point.
Therefore, it is important not to treat divergence formed during the trading session as a confirmed signal.
3. Comparing Different Timeframes
Directly comparing a daily price high with an 15-minute RSI high combines different time structures.
The basic approach when checking for divergence is to compare price and the RSI on the same timeframe.
4. Mistaking a Signal Marked on a Historical Chart for a Real-Time Signal
Some indicators draw a signal at a historical location after the pivot has been confirmed.
A signal that looks precise on a historical chart was not necessarily just as easy to identify when it actually occurred.
Therefore, when reviewing a historical chart, record both the candle where the signal is marked and the candle where it was actually confirmed.
Checklist for Reviewing a Live Chart
After spotting RSI divergence, you can check the following items in order.
[ ] Are price and the RSI on the same timeframe?
[ ] Are the two highs or lows being compared clearly defined?
[ ] Are price and the RSI actually moving in opposite directions?
[ ] Are the comparison points confirmed pivots?
[ ] Have the candles to the right, needed to confirm the pivot, closed?
[ ] Is the existing trend still intact?
[ ] Has price broken the previous swing high or low?
[ ] Have you also checked the closing price and volume after the breakout?
[ ] Have you identified the price level that would invalidate your analysis if the market moves against expectations?
Meeting every condition does not guarantee a profit.
Divergence is an analytical tool for examining changes in market momentum. Actual trading also requires considering risks such as transaction costs, slippage, and gaps.
Frequently Asked Questions About RSI Divergence
Q. Does RSI divergence occur only when the RSI is at 70 or 30?
No. RSI divergence is not a pattern that requires the RSI to pass through 70 or 30. What matters is whether corresponding price and RSI highs or lows move in different directions.
Q. How many days after divergence appears should a reversal occur?
There is no set timeframe. The pace varies depending on the chart timeframe, the asset's volatility, and trend strength. A divergence cannot be considered automatically invalid just because a reversal did not occur within a certain period.
Q. Which is more accurate: RSI 14 or RSI 9?
RSI 14 is the commonly used default setting. RSI 9 responds more sensitively, so it may generate signals more often, but it may also produce more false signals. Which setting is more suitable should be evaluated based on the asset and timeframe.
Q. Is it okay to decide whether to buy or sell based only on divergence?
That is difficult to recommend. Divergence only indicates the possibility of weakening momentum. Price structure, key support and resistance levels, volume, and risk management conditions should also be reviewed.
---
The most important thing about divergence is to distinguish when it could actually be confirmed and how price structure changed afterward, rather than focusing only on where the signal appeared.
A signal that looks clear on a historical chart may differ from one that could be used in real time. Understanding this difference helps prevent mistaking RSI divergence for confirmation of a trend reversal.
※ This article provides information for understanding market movements and is not a recommendation to invest in any specific asset or security. You are responsible for your own final decisions and investments.