

Why Prices Can Keep Moving Even When RSI Divergence Appears: How to Distinguish Trend and Reversal Signals
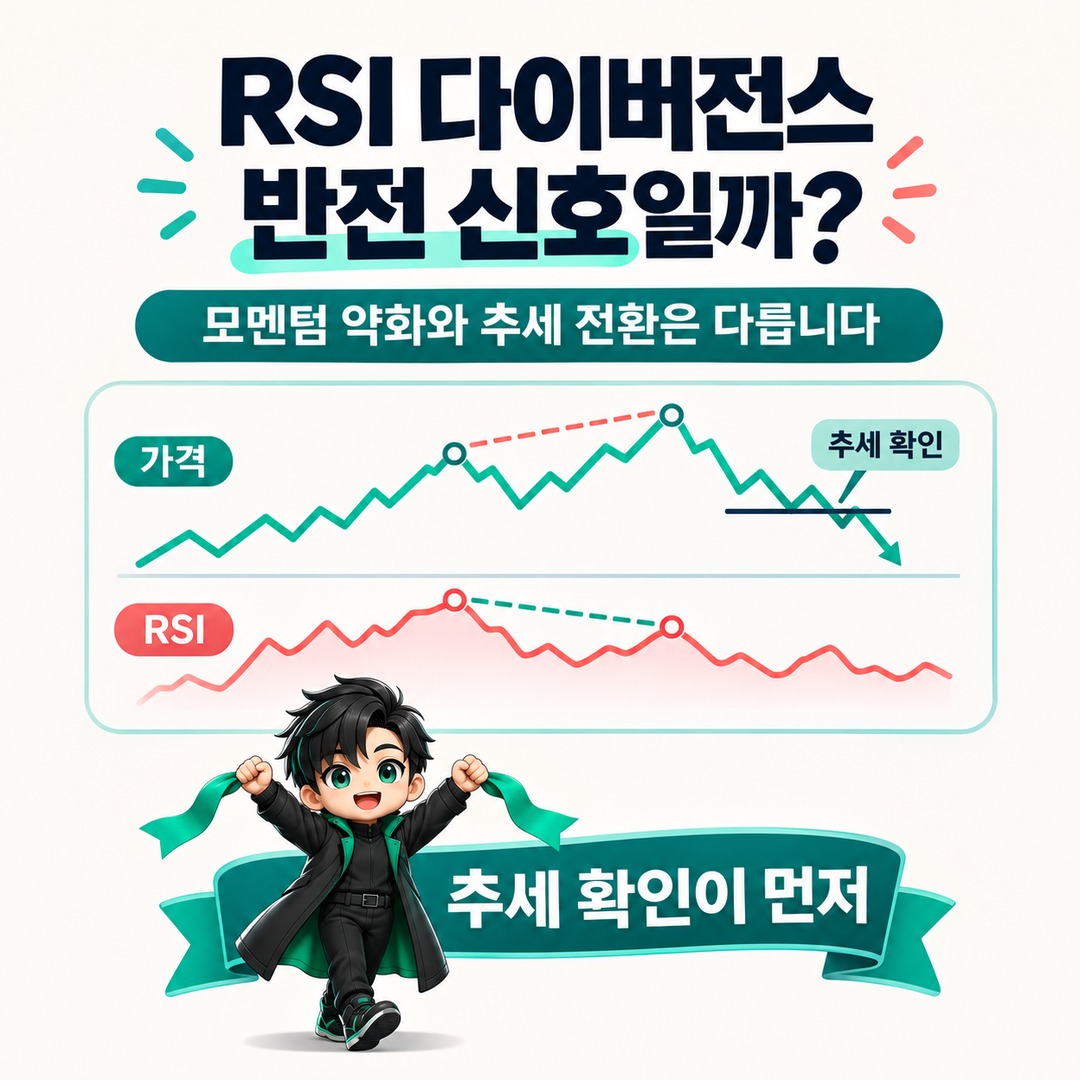
RSI divergence is a situation in which price and upward or downward momentum move in different directions; it is not a definitive signal that price will immediately reverse. In a strong uptrend, prices can keep rising even after bearish divergence appears several times, and in a strong downtrend, prices can continue falling even after bullish divergence appears. The key is to check whether price has actually changed trend, rather than simply whether divergence has appeared.
Why Doesn't RSI Divergence Guarantee a Price Reversal?
The appearance of RSI divergence does not mean that price must move in the opposite direction. RSI is a momentum indicator that compares average gains and average losses over a set period.
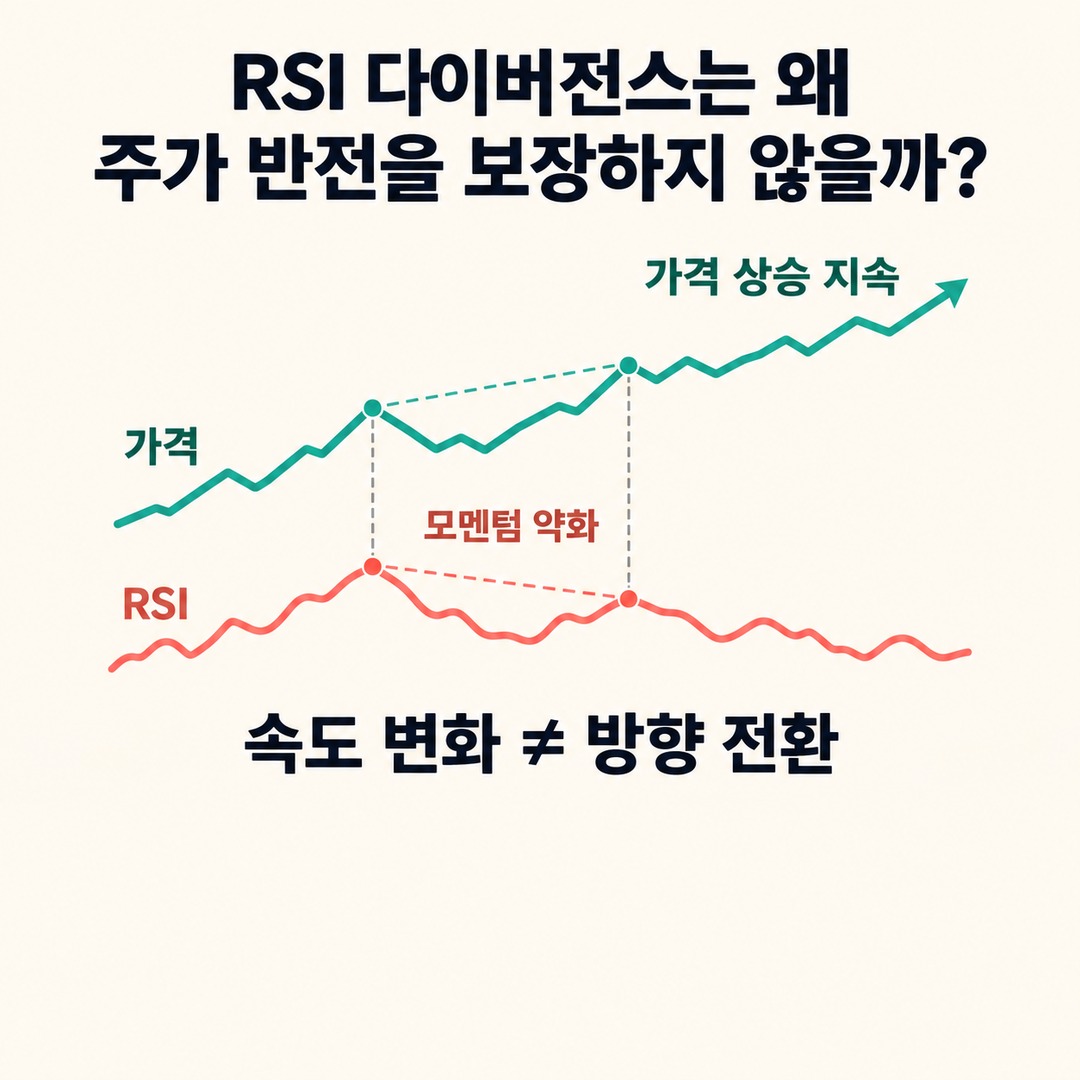
Divergence tells you that upward or downward momentum has changed compared with the existing price movement.
Price direction and the speed of its movement are different kinds of information.
For example, if price rises above its previous high while the RSI peak is lower, bearish divergence has occurred.
That does not erase the fact that price is rising. It adds the interpretation that the upward force has weakened compared with before.
Conversely, if price falls below its previous low while the RSI low is higher, that is bullish divergence. It can be interpreted as a sign that downward pressure has weakened, but it does not mean selling pressure has disappeared completely.
StockCharts' RSI technical analysis material also explains that divergence can be misleading in a strong trend, and that opposing signals may appear several times before the trend actually reverses.
Why Prices Keep Rising After Bearish Divergence Appears
Bearish divergence occurs when price forms a higher high while RSI forms a lower high.
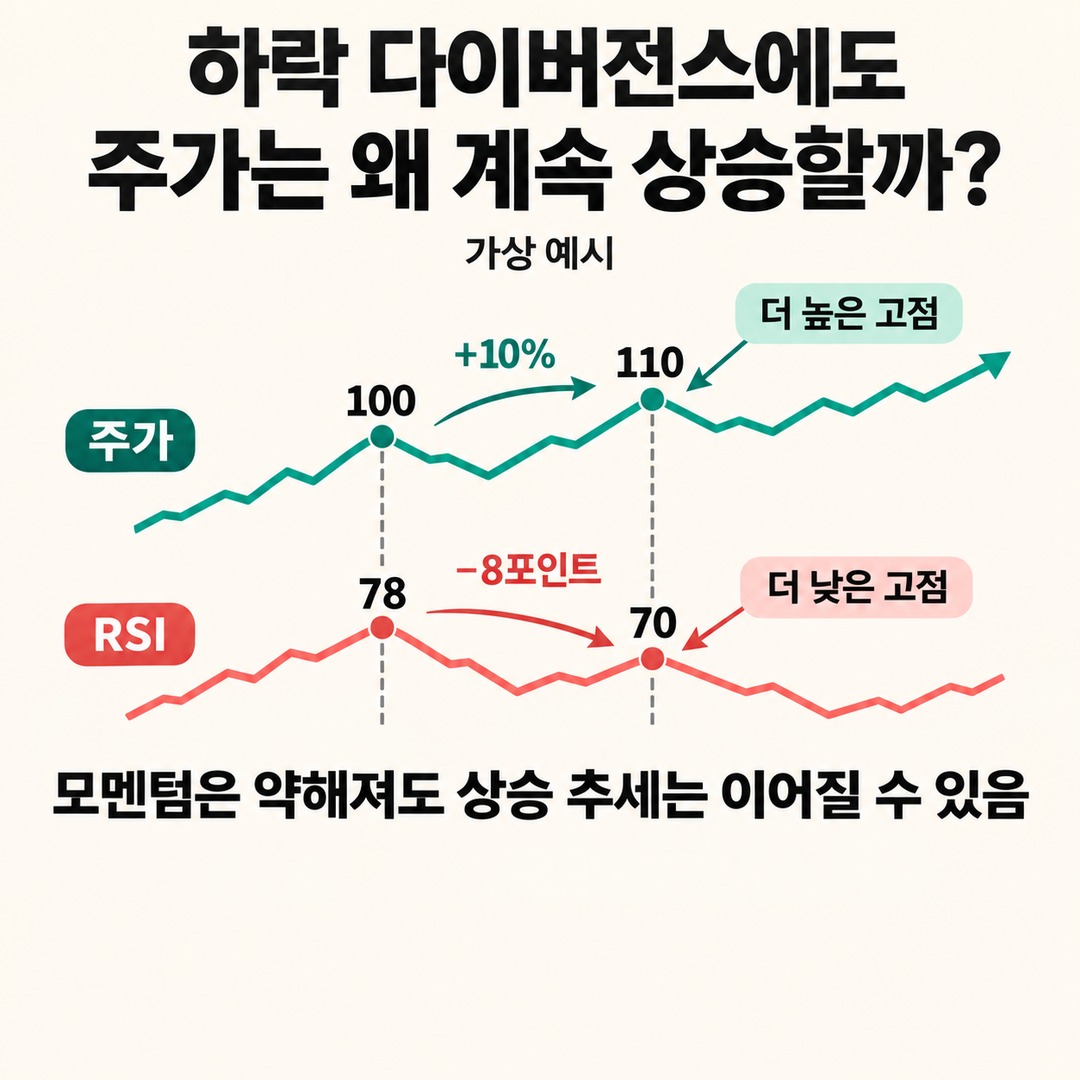
It is generally interpreted as a sign that upward momentum is weakening, but prices may continue to rise while the uptrend remains intact.
Consider a hypothetical chart example.
Hypothetical example: Bearish divergence
First peak# 100
Price
78
RSI
Second peak# 110
Price
70
RSI
Price movement
+10%
Change in RSI
-8 points
Bearish divergence. This explanation uses hypothetical numbers and does not represent historical data for an actual security.
Price rose from 100 to 110, while RSI fell from 78 to 70.
There are two things to check in this situation.
First, upward momentum has weakened.
Second, price is still forming a high above the previous high.
Therefore, you cannot conclude that the uptrend has ended simply because RSI has fallen.
In particular, the uptrend may continue after bearish divergence appears in situations such as these:
Price continues to form higher highs and higher lows.
Price holds above key support levels even when a pullback occurs.
The price structure remains upward even as RSI falls.
A short-term slowdown in momentum does not lead to a reversal of the long-term trend.
StockCharts' RSI material includes a chart example of the S&P 500 ETF, SPY. In that chart, bearish divergence appeared three times, but the uptrend continued.
The key point this example demonstrates is that the fact that divergence has appeared several times does not, by itself, confirm a trend reversal.
Why Prices Keep Falling After Bullish Divergence Appears
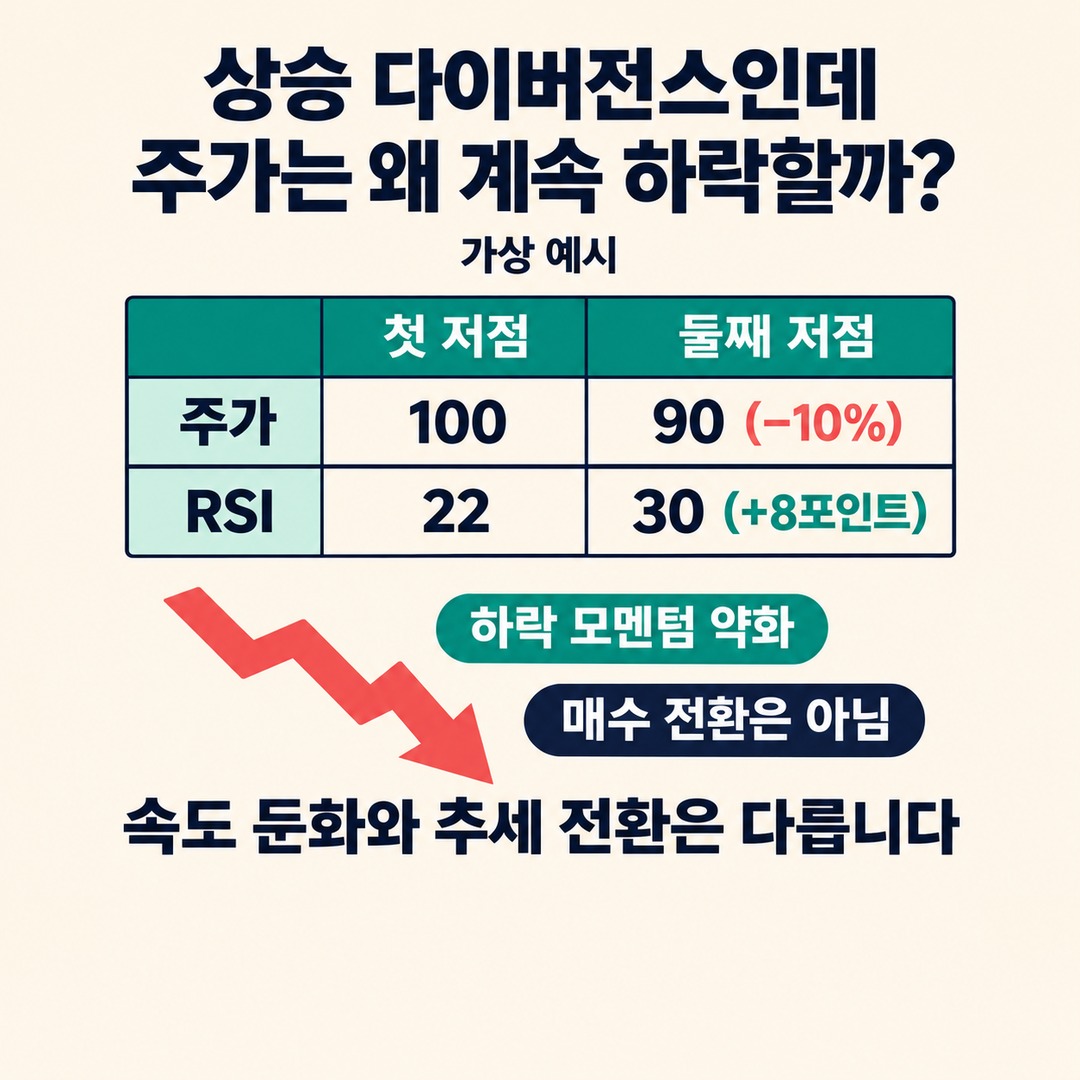
Bullish divergence occurs when price forms a lower low while RSI forms a higher low.
This is a sign that downward momentum is weakening, but it does not mean that buying pressure has actually shifted to pushing prices higher.
Let's compare using hypothetical numbers.
Hypothetical example: Bullish divergence
First low# 100
Price
22
RSI
Second low# 90
Price
30
RSI
Price movement
-10%
Change in RSI
+8 points
Bullish divergence. This explanation uses hypothetical numbers and does not represent historical data for an actual security.
Price fell further, from 100 to 90, while RSI rose from 22 to 30.
This means downward momentum has weakened compared with the previous decline.
However, weakening selling pressure is not the same as buying pressure becoming strong enough to push prices higher.
In a strong downtrend, prices may continue falling even if selling pressure eases somewhat, as long as buying pressure is not strong enough to change the trend.
So if bullish divergence appears, distinguish among the following:
The decline is slowing.
Price has begun to form higher lows.
Price has actually broken through resistance.
These are three different stages.
Concluding that the trend has already reversed when divergence first appears may lead to a premature trade.
How Do Regular and Hidden Divergence Differ?
When interpreting a situation in which prices keep rising or falling, distinguish between regular divergence and hidden divergence.
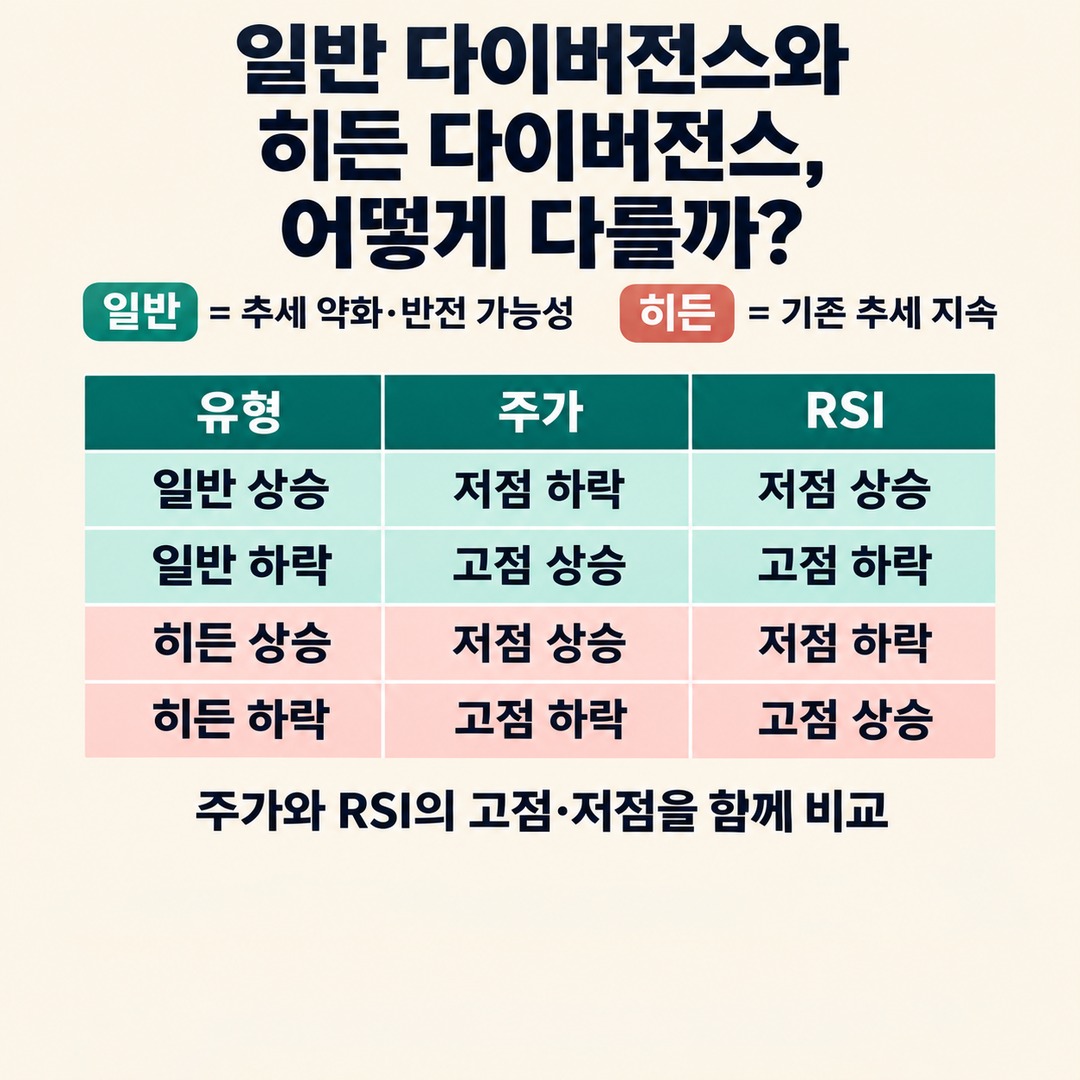
Regular divergence is used to examine weakening in the existing trend and the possibility of a reversal, while hidden divergence is used to interpret a situation in which the existing trend continues.
| Type | Price movement | RSI movement |
|---|---|---|
| Regular bullish | Lower lows | Higher lows |
| Regular bearish | Higher highs | Lower highs |
| Hidden bullish | Higher lows | Lower lows |
| Hidden bearish | Lower highs | Higher highs |
Two signals that appear in an uptrend
Hidden bullish: higher price lows + lower RSI lows
Interpreted as a signal that the existing uptrend is likely to continue.
Regular bearish: higher price highs + lower RSI highs
Interpreted as a signal that upward momentum is weakening and a reversal may be possible.
The two signals point in different directions.
In particular, do not identify bearish divergence in an uptrend just because RSI has fallen below its previous low. Check how the price lows have moved as well.
The same applies in a downtrend.
If price forms lower highs while RSI forms higher highs, this can be interpreted as hidden bearish divergence.
This distinction is also covered in tastytrade's RSI divergence explainer 2026-08-26.
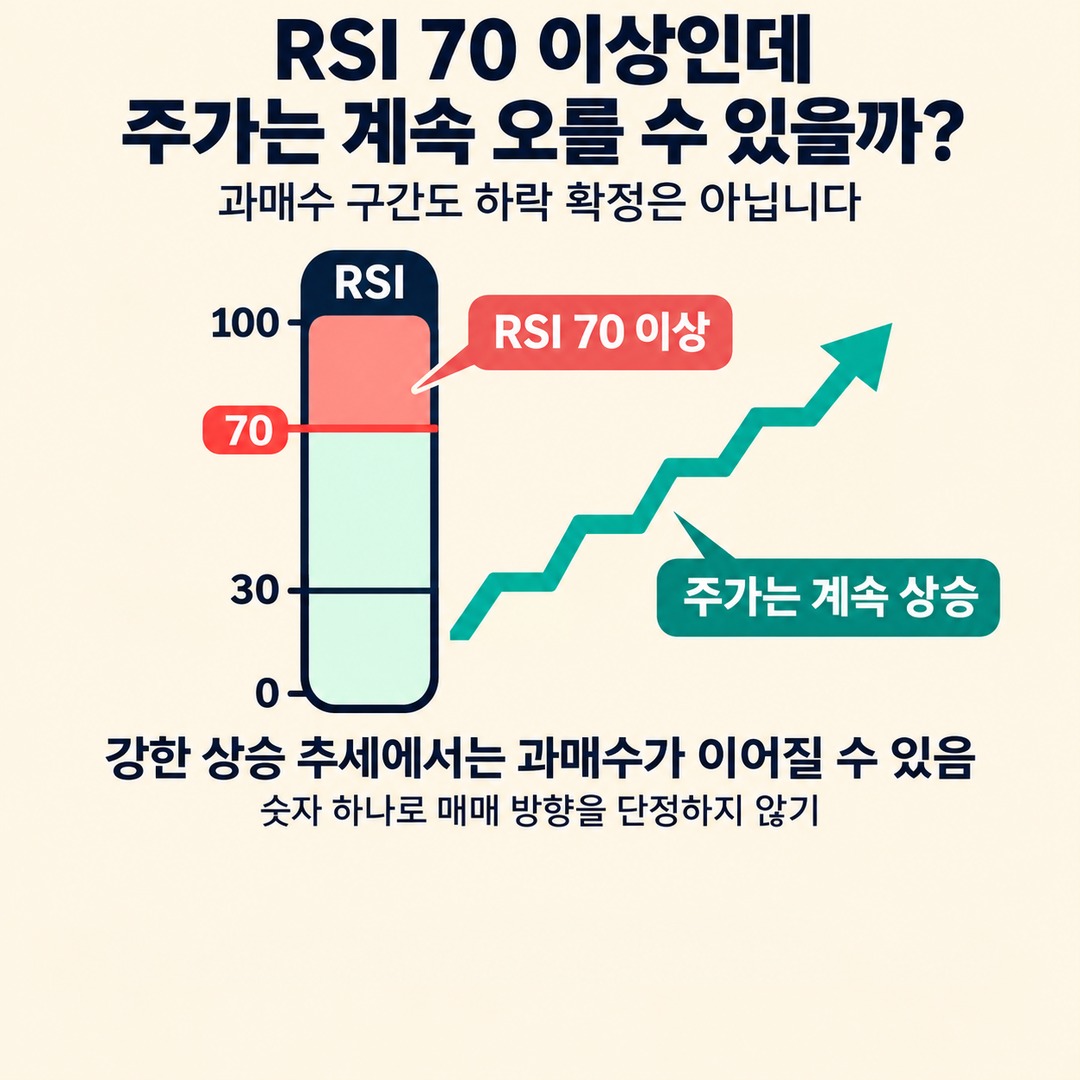
Is It the Same Principle When Price Keeps Rising Even Though RSI Is Above 70?
Yes. RSI above 70 is traditionally called the overbought zone, but it does not necessarily mean that price will fall.
RSI is an indicator that moves between 0 and 100. Generally, readings above 70 are interpreted as overbought, while readings below 30 are interpreted as oversold.
However, in a strong uptrend, RSI can remain in the overbought zone for a long time.
Conversely, in a strong downtrend, RSI can remain in the oversold zone for an extended period.
Fidelity's RSI technical analysis guide explains that in an uptrend, RSI tends to stay within the 40 to 90 range, while in a downtrend, it tends to stay within the 10 to 60 range.
This is not a fixed rule that applies to every security; it means that RSI movements can be interpreted differently depending on the trend.
It is therefore best to avoid conclusions such as:
RSI breaks above 70 → sell no matter what
RSI breaks below 30 → buy no matter what
Bearish divergence → immediate reversal downward
Bullish divergence → immediate reversal upward
If you decide which way to trade based on a single RSI reading, your judgment may not match actual price movements.
What Else Should You Check When Divergence Appears?
After identifying divergence, check whether price itself is showing signs of a trend change.

In particular, it is important not to treat the formation of a second high or low alone as confirmation of an entry point.
You can check in the following order.
1. Check that the two highs or lows are being compared correctly. Compare highs with highs or lows with lows on the price chart, and match them to the RSI highs and lows at the corresponding times. Do not mix values from different timeframes.
2. Check whether the current trend is upward or downward. Look at the sequence of recent highs and lows, the direction of major moving averages, and other factors. Also check whether regular divergence appeared within a strong trend.
3. Check whether the intervening price structure is breaking down. For bearish divergence, see whether price closes below the key low formed between the two highs. For bullish divergence, check whether it closes above the key high between the two lows.
4. Consider volume along with key support and resistance. Check how price moves at key support levels and whether volume changes as price breaks through or falls below a level.
5. Define the price structure that would invalidate the signal. Watch what happens after the second high or low that formed the divergence. If price moves differently than expected, reassess the original interpretation.
The key difference here is when you make the assessment.
Assessing the situation immediately after divergence appears is faster, but you may react to a false signal while the trend remains intact.
By contrast, waiting until a key price structure has actually changed can mean a later signal, but it gives you additional price action to confirm the move.
Technical analysis materials from StockCharts and tastytrade also explain that divergence should be assessed alongside price action and other indicators.
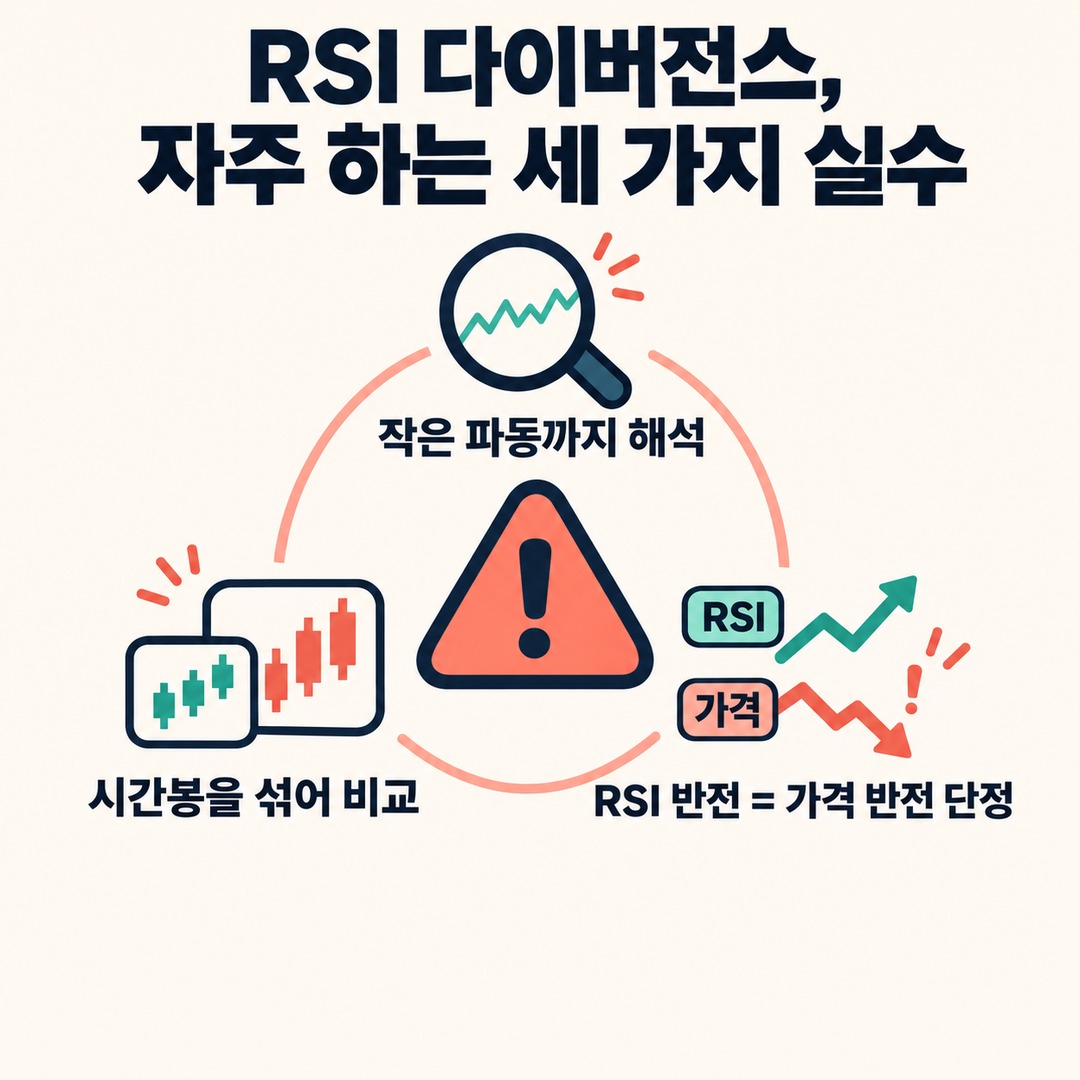
Three Common Mistakes in Reading RSI Divergence
The first is interpreting even small swings as divergence.
Drawing lines arbitrarily when two highs or lows are not clear can produce too many signals.
StockCharts' divergence analysis material explains that identifying highs and lows can be subjective, and that it can be difficult to distinguish meaningful divergence from ordinary price fluctuations.
The second is ignoring the timeframe on which the divergence appears.
Divergence on a 5-minute chart and divergence on a daily chart reflect different ranges of price movement.
Do not interpret a signal on a short-term chart as a reversal of the long-term trend.
The basic approach is to compare price and RSI using the same timeframe and the same criteria.
The third mistake is assuming that price will soon move in the opposite direction whenever RSI does.
RSI is an indicator calculated from past price changes. It is not an independent forecasting tool that determines the future direction of price.
Even if divergence repeats several times, the existing trend may continue as long as the price structure holds.
In Closing: Divergence Signals a Change in Trend Conditions, Not a Trading Direction
There is no contradiction when prices keep rising or falling after RSI divergence appears.
Price may still be rising or falling, while the momentum driving that movement has changed.
The key points are these:
1. Regular divergence signals weakening momentum in the existing trend.
2. Hidden divergence signals the potential continuation of the existing trend.
3. Whether the trend has actually reversed should be confirmed through price action, including highs, lows, support, and resistance, rather than RSI alone.
If you spot divergence on a chart, instead of immediately deciding whether to buy or sell, first look at how the price structure changes after the second high or low.
Divergence is not the right answer for a trade; it is a reference signal that tells you when to take another look at the chart.
This article is educational information about technical analysis and is not a recommendation to buy or sell any particular security. RSI and divergence are indicators based on historical price data; when investing, you should take into account the possibility of losing principal.
※ This article is for reference to help readers understand market trends and is not investment advice regarding any particular security or asset. You are responsible for your final decisions and investment outcomes.