

Jesse Livermore’s Failed Pivot Point Breakout: The Price Signal to Abandon a Momentum-Buying Thesis
In Jesse Livermore’s pivot point trading, a breakout is not judged to have failed simply because the stock price briefly declined. The key is whether the expected rise continues after the price passes the pivot point, or whether buying weakens immediately after the breakout and the price falls back to its previous range. Livermore viewed the absence of the expected move as a warning signal
This post contains Coupang Partners affiliate links. We may earn a commission from qualifying purchases.
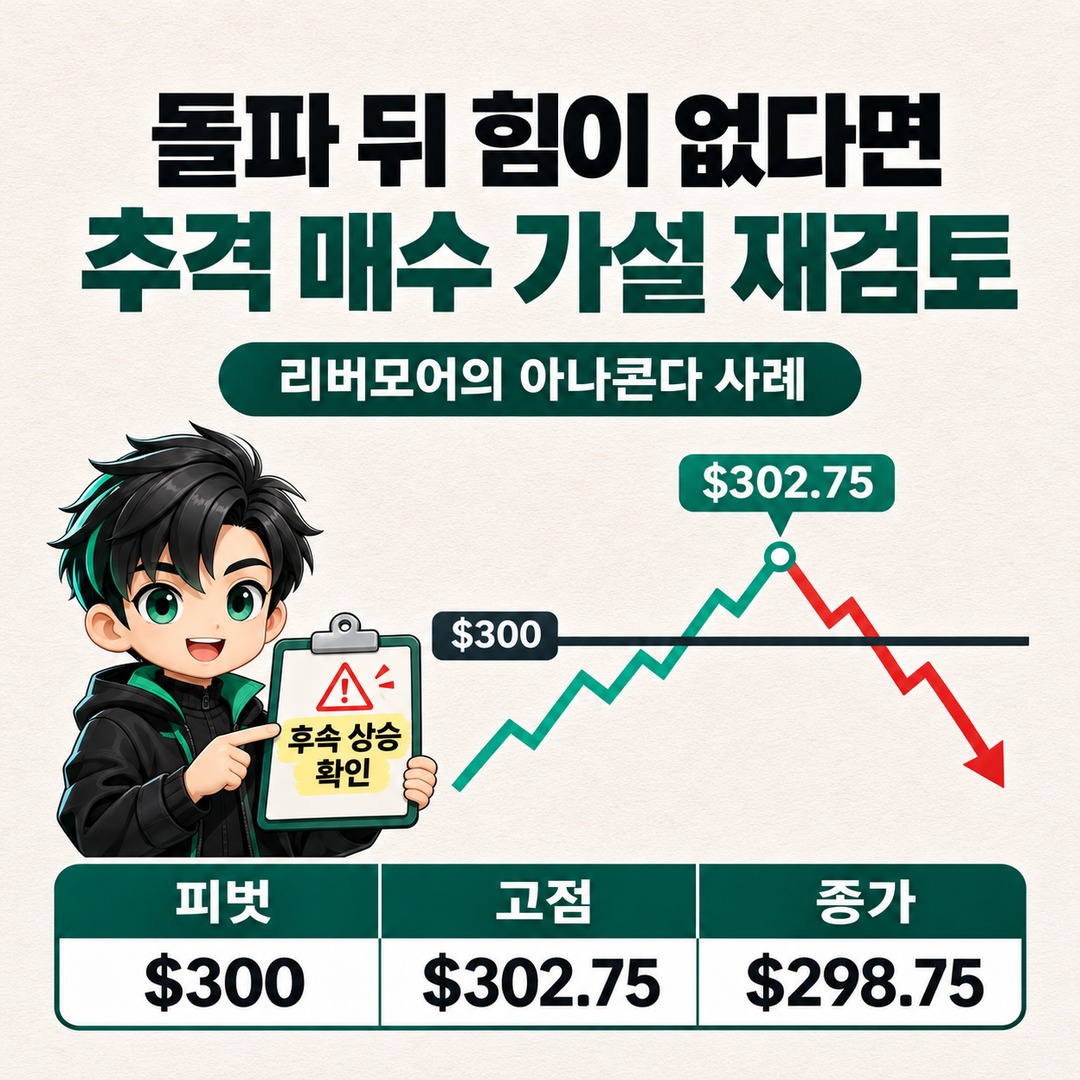
In Jesse Livermore’s pivot point trading, a breakout is not judged to have failed simply because the stock price briefly declined. The key is whether the expected rise continues after the price passes the pivot point, or whether buying weakens immediately after the breakout and the price falls back to its previous range. Livermore explained that the absence of the expected move was a warning signal and that the position should be closed.
This principle is recorded in 《How to Trade in Stocks》, published in 1940. In particular, reading the Anaconda case alongside the explanation of the Market Key helps distinguish when to stop chasing a breakout immediately after it occurs from when the trend itself has become invalid.
Judge a failed pivot point breakout by what follows, not by price alone
The key point Livermore emphasized was not the fact that the price passed the pivot point, but how it moved afterward.
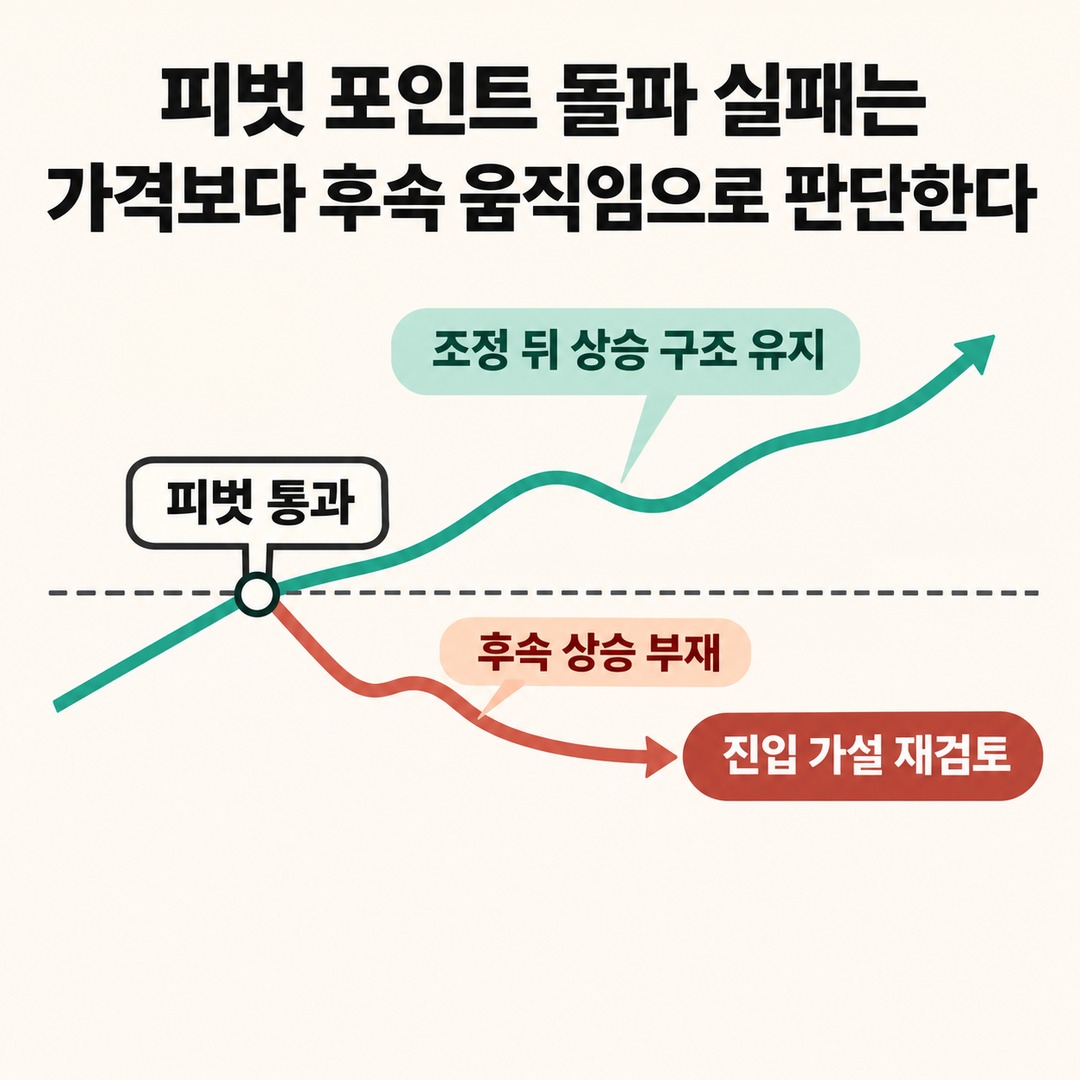
If you bought in anticipation of an upward breakout, the stock price would generally be expected to behave as follows.
It passes the pivot point.
The upward move continues after the breakout.
Even if a normal correction occurs, the structure of the uptrend remains intact.
The price moves above the previous high.
Conversely, if the rise does not continue properly after the breakout and selling keeps coming into the market, the original entry thesis should be reassessed.
There is an important distinction here.
A normal correction does not immediately invalidate the bullish thesis, but the absence of the expected price action after a breakout is a warning signal that calls for an immediate response.
Livermore explained this principle through the Anaconda case in the pivot point chapter of 《How to Trade in Stocks》.
How the USD 300 breakout failed in the Anaconda case
The Anaconda case Livermore described firsthand is a useful historical example for understanding a failed breakout.

He explained that he bought Anaconda stock when it passed USD 100 and USD 200, respectively, and that at the time, a rapid rise followed immediately after each pivot point was crossed.
But the situation was different at USD 300.
Jesse Livermore, How to Trade in Stocks, 1940, Chapter 5, The Pivotal Point
| Category | Recorded price movement |
|---|---|
| First pivot | USD 100 |
| Second pivot | USD 200 |
| Third pivot | USD 300 |
| High after the USD 300 breakout | USD 302.75 |
| Rise from USD 300 | USD 2.75 |
| Closing price at the time | USD 298.75 |
The point to note is that although the price moved above USD 300, it rose to USD 302.75 and then failed to continue the expected advance.
Livermore explained that when the price previously broke above USD 100 and USD 200, it rose quickly by at least 10~15 points immediately after each breakout.
But at USD 300, the stock behaved differently. In his observation, the price could not continue rising because more shares were being offered to the market than buyers were willing to purchase.
He sold his 8,000 shares. The stock then closed below USD 300, opened substantially lower in the New York market the next day, and fell to USD 225 within a few days.
The important point in this case is not the number USD 302.75 itself.
It is that, compared with earlier breakouts in the same stock, the price reaction after this breakout was markedly different.
Livermore described this as a warning signal that must be watched after a pivot point breakout.
Original source: Jesse Livermore, How to Trade in Stocks, original PDF
How can you distinguish a normal correction from an invalidated entry thesis?

Both situations share the fact that the stock price falls after a breakout, but they have different meanings.
A normal correction is a move in the opposite direction within the existing trend. A failed breakout, by contrast, means the market has been unable to move in the expected direction after passing the pivot point.
| Assessment | Normal correction | Possible failed breakout |
|---|---|---|
| Pivot support | Support structure holds | Price falls back below the breakout level |
| Follow-through | Upward move resumes | Upward momentum lacks continuity |
| Buying | Upward move holds | Selling supply increases |
| Response | Monitor the trend | Reassess the entry thesis |
This table presents an interpretive framework for observing Livermore’s original account on modern charts. His original trading rules should not be inferred from a single candlestick or a single volume reading.
In particular, the original text does not establish a rule that a trader must immediately sell in every situation just because the price briefly fell below the pivot intraday.
In practice, the stop-loss price set before entry and the trading time frame should also be taken into account.
Livermore’s Market Key has a separate benchmark of 3 points
There is one more point to consider here.

Livermore used not only simple psychological price breakouts, but also a system called the Market Key, which recorded price advances and corrections.
In this system, the question is whether the uptrend resumes after a Natural Reaction.
Under the rules described in Chapters 9 and 10 of the original 1940 publication, a move of at least 3 points above an individual stock’s previous pivot point serves as a benchmark for confirming that the trend has resumed.
Specifically, the process is as follows.
1. A Natural Reaction occurs during an uptrend.
2. After the correction, observe whether the upward move resumes.
3. The uptrend is considered to have resumed positively only if the price moves at least 3 points above the previous pivot point.
4. Conversely, if the price falls at least 3 points below the pivot of the previous uptrend during the correction, this is interpreted as a signal that the uptrend has ended.
This benchmark belongs to a price-recording system used at the time for individual stocks. Key Price has a separate 6-point benchmark.
Therefore, 3 points should not be applied directly to modern stocks or cryptocurrencies. Price levels, volatility, and trading units differ.
The key point established by the original text is not to apply a specific number to every stock, but to use the previous pivot as the reference for checking whether the trend has resumed.
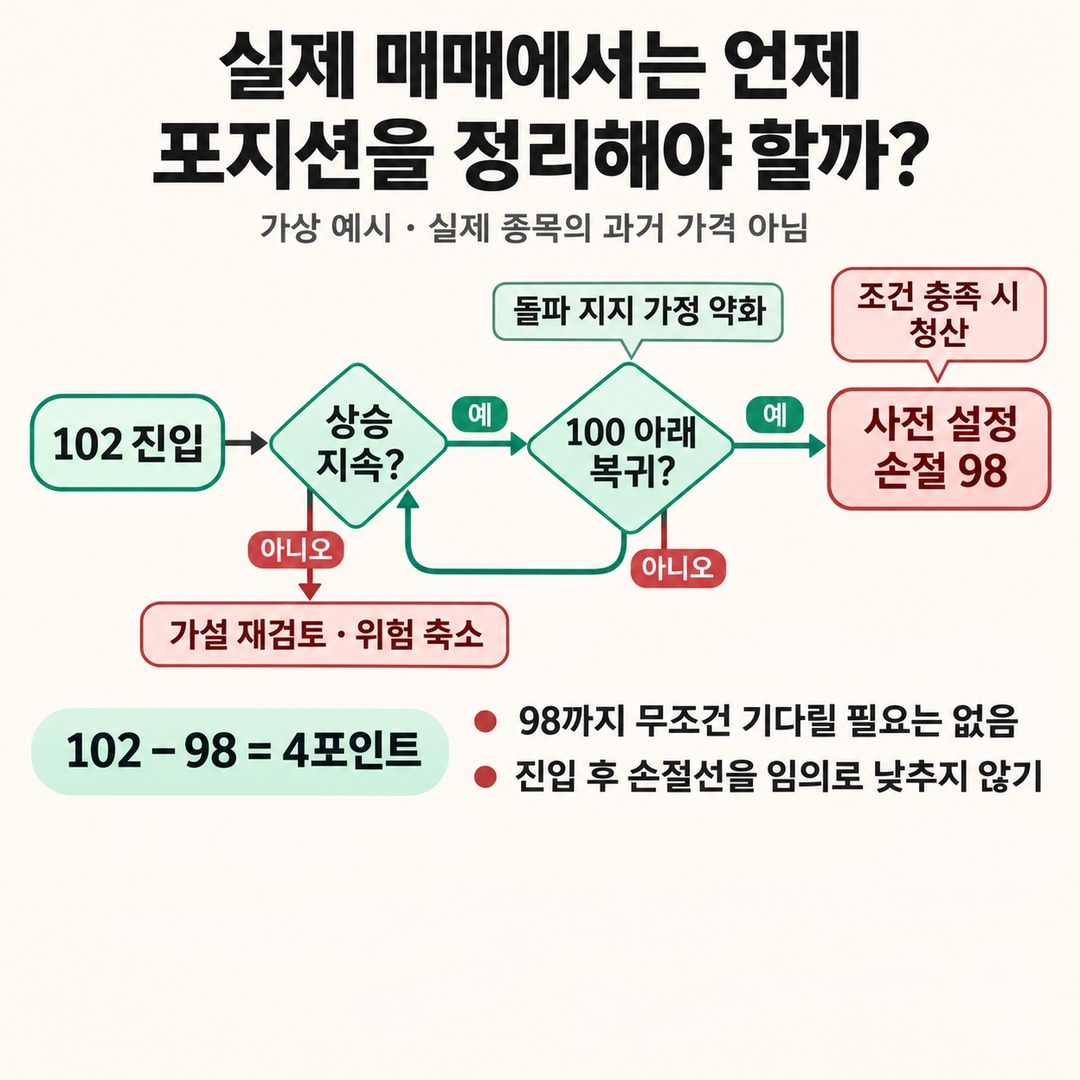
When should you close a position in actual trading?
To apply Livermore’s principles to modern charts, it is useful to define invalidation conditions before entering a trade.
For example, consider the following hypothetical upward-breakout scenario.
Hypothetical example · Not the historical price or trading result of an actual security
Pivot point: 100
Breakout confirmation price: 102
Expectation of a rise after the breakout
Pre-set stop-loss price: 98
There are three things to assess in this situation.
First, does the price continue rising immediately after the breakout?
If you enter at 102 after the price moves above 100, but the rise does not continue and selling pressure appears, reassess the original thesis.
Second, does the price fall back below the pivot point?
If the price falls back below 100, the assumption that the breakout has turned into support is weakened. Close the position if the pre-set stop-loss condition is met.
Third, is it reasonable to wait until the stop-loss price?
If the pre-set stop-loss price is 98, that does not mean you must always wait until the price reaches it. If abnormal price action appears first after the breakout, you may need to reduce risk.
In this example, the difference between the entry price and the stop-loss price is 4 points.
Author’s calculation:
102 - 98 = 4 points
This is a simple price difference that excludes fees, slippage, and taxes.
The key is not to change the stop-loss level based on emotions after entering. If you decide the breakout has failed but keep lowering the stop-loss you originally set, your actual response contradicts your initial entry thesis.
After a failed breakout, consider re-entering only after a new pivot forms
A single failed breakout does not mean the security has permanently lost its potential to rise.

Livermore also explained the view that when the market shows warning signs, you should first exit the position, and that you may re-enter later if conditions improve again.
However, buying again at the same price immediately after closing the position may amount to clinging to the original thesis.
To consider re-entering, reassess the following conditions.
Has the price recovered the previous pivot?
Has a new correction range formed?
Is there evidence of an upward move resuming after the correction?
Is the difference between the new entry price and stop-loss price manageable?
In modern technical analysis, this can be interpreted as the formation of a new breakout structure.

The important thing is to form a separate trading thesis based on new price action, rather than re-entering to recover the previous loss.
The key criterion to remember
In Jesse Livermore’s pivot point trading, the market’s reaction after the breakout matters most, not the moment of the breakout itself.
The Anaconda case, in which the stock passed USD 300 but failed to continue rising at USD 302.75, shows that a breakout and a successful trend reversal are two different things.
In actual trading, distinguish among these three situations.
1. Normal correction: Observe whether the pivot and trend structure remain intact.
2. Weakening momentum after a breakout: If the expected follow-through rise does not occur, treat it as a warning signal.
3. Invalidated thesis: Close the position if the pre-set stop-loss condition is met or a breakdown in the trend structure is confirmed.
Continuing to hold just because a breakout succeeded is risky, but selling after every minor correction may also conflict with the purpose of trend trading.
Livermore’s principle can be put in one sentence:
If the price does not move in the expected direction, change your own judgment first instead of demanding an explanation from the market.
※ This article is for informational purposes to help readers understand market movements and is not an investment recommendation for any specific security or asset. The final decision and responsibility for investing rest with you.
This post contains Coupang Partners affiliate links. We may earn a commission from qualifying purchases.