

How Much Did U.S. Stocks Rise on September 11?
이 포스팅은 쿠팡 파트너스 활동의 일환으로, 이에 따른 일정액의 수수료를 제공받습니다.

Three Major U.S. Stock Indexes Rebound by Around 1%: A 2.8% Drop in Oil Prices Changes Friday's Market Direction Amid Iran Tensions# Three Major U.S. Stock Indexes Rebound by Around 1%: A 2.8% Drop in Oil Prices Changes Friday's Market Direction Amid Iran Tensions
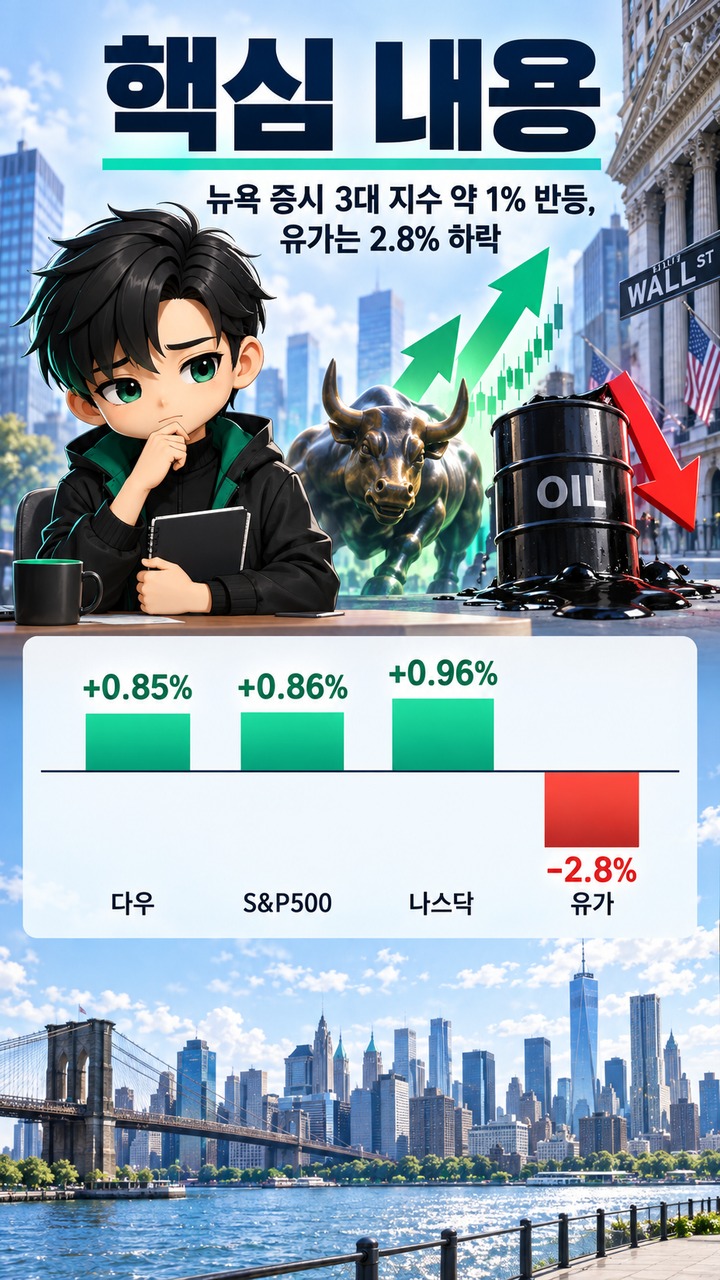
Despite continuing instability in the Middle East involving the United States and Iran, all 3 major U.S. stock indexes rose on September 11 (local time). The S&P500 gained 0.86%, the Nasdaq rose 0.96%, and the Dow gained 0.98%. Meanwhile, Brent crude fell 2.8% to close at 104.61 dollars per barrel, partially easing the oil-price pressure that had weighed on markets.
However, it would be premature to conclude that the risks have disappeared based on a single day's rebound. For the week, the S&P500 fell 0.8%, the Nasdaq declined 0.7%, and the Dow lost 1.6%. Meanwhile, U.S. consumer prices for August increased 0.4% from the previous month, a larger rise than the 0.1% recorded in July. The next key event is the Federal Open Market Committee (FOMC) meeting scheduled for 15–16 of September.
How Much Did U.S. Stocks Rise on September 11?
All three major indexes rebounded by around 1% in Friday's session. The S&P500 closed at 7,656.98, the Nasdaq Composite at 26,333.04, and the Dow Jones 30 Industrial Average at 52,573.29.

The changes from the previous session were as follows.
| Index | September 11 Closing Level | Daily Change |
|---|---|---|
| S&P500 | 7,656.98 | +0.86% |
| Nasdaq | 26,333.04 | +0.96% |
| Dow Jones | 52,573.29 | +0.98% |
The Dow gained 509.19 points during the session, while the S&P500 rose 65.28 points and the Nasdaq advanced 251.31 points. The S&P500 also ended a streak of 4 consecutive trading days of declines.
The simple average of the three indexes' percentage gains was approximately 0.93%. This figure was calculated by the author using `(0.86% + 0.96% + 0.98%) ÷ 3`. In other words, the session represented a broader rebound across the large-cap stock market rather than gains confined to a single index.
Weekly returns, however, told a different story. Even after Friday's rebound, the S&P500 was down 0.8% for the week, the Nasdaq had lost 0.7%, and the Dow had declined 1.6%. This is why daily and weekly market movements need to be considered separately.
Why Did Stocks Rise Despite Continuing Tensions Involving Iran?

The most immediate change observed in the September 11 market was that international oil prices retreated from their previous sharp rise. Brent crude fell 2.8% that day, closing at 104.61 dollars per barrel.
Over the preceding days, international oil prices had surged amid attacks involving Middle Eastern transportation routes and concerns about supply disruptions. Fears that higher energy prices could again put upward pressure on U.S. inflation and interest rates weighed on stocks. On September 10, the S&P500 fell 0.58%, the Nasdaq declined 0.65%, and the Dow lost 0.60%.
On Friday, oil prices moved in the opposite direction. Brent crude fell by approximately 3% in a single day, somewhat easing near-term concerns that energy prices would continue surging.
That does not mean the oil market had stabilized. Even after Friday's decline, Brent crude remained above 104 dollars and was still up approximately 9% for the week. Therefore, the September 11 stock market gains are more accurately understood as a rebound accompanying a one-day pullback in sharply elevated oil prices, rather than as evidence that Middle Eastern risks had ended.
U.S. CPI for August Actually Rose More Than in the Previous Month
The U.S. inflation data released on the day stocks rose did not show a clear slowdown. The U.S. Consumer Price Index (CPI) for August increased 0.4% month over month on a seasonally adjusted basis, while the increase over 12 months was 3.4%.
The month-over-month increase for July was 0.1%. Because the increase accelerated to 0.4% in August, the monthly rate of increase rose by 0.3% percentage points.
According to the author's calculation, `0.4% - 0.1% = 0.3% percentage points`. Comparing only the monthly rates, the 0.4% increase in August was four times the 0.1% increase in July. However, monthly figures can be volatile, so this should not be interpreted as a fourfold increase in the long-term inflation trend.
Energy-price movements were also reflected in the CPI. In August, the U.S. gasoline price index rose 3.9% month over month, while the energy index increased 2.1%. Shelter costs rose 0.3%, and food prices increased 0.1%.
Core CPI, which excludes volatile food and energy prices, increased 0.3% during August and rose 2.4% over 12 months. The annual core inflation rate for July was 2.5%.
Therefore, the inflation data for August showed two developments at once. The monthly rate of increase in headline CPI accelerated, while the 12-month increase in core CPI eased from 2.5% to 2.4%.
Is It Contradictory for Stocks to Rise Despite High Inflation?
Looking only at stocks and inflation data from the same day, the market's reaction may seem somewhat unusual. Consumer prices rose 0.4% month over month, yet stocks gained around 1%.
However, inflation was not the only factor influencing the September 11 market. International oil prices, which had surged earlier, declined, and market participants incorporated the new inflation figures into their expectations for the following week's monetary policy decision.
In the interest-rate futures market, expectations increased that the Federal Reserve would raise its benchmark interest rate on September 16. The probability implied by market prices at the time was approximately 90%, up from around 72% the previous day.
This figure does not mean the Federal Reserve's decision had been finalized. It represents only market participants' expectations inferred from interest-rate futures prices. The Federal Reserve's actual decision will be announced following the FOMC meeting on 15–16 of September.
Changes were also evident in the bond market. The yield on 2-year U.S. Treasury securities rose from 4.56% the previous day to 4.62%, while the 10-year yield increased from 4.95% to 4.97%. The more pronounced movement in the 2-year yield, which is sensitive to short-term policy rates, also reflected the shift in interest-rate expectations at the time.
Not All Technology Stocks Rose
Although the Nasdaq gained 0.96%, not every major technology stock advanced. Individual company performances varied considerably.
Dell rose 12% to reach an all-time high, while Hewlett Packard Enterprise also gained 12% and HP advanced 8.4%. Oracle, meanwhile, initially showed strength early in the session but ultimately fell approximately 1.8%.
Of the 11 sectors in the S&P500, 9 finished higher. Communication services led with a gain of 1.35%, while consumer discretionary rose 1.13%.
Therefore, rather than describing the September 11 session simply as a 'technology stock surge,' it is more accurate to say that a broad rebound occurred amid falling oil prices and changing interest-rate expectations, while individual stocks still moved differently depending on earnings and company-specific developments.
Why Weekly Performance Matters Alongside a Single Day's Gains
Looking only at Friday's closing prices, it might appear that U.S. stocks had quickly absorbed the risks associated with the Middle East. However, weekly figures show that the market had not yet fully recovered its earlier losses.
The S&P500 rose 0.86% on Friday but fell 0.8% for the week as a whole. The Nasdaq also gained 0.96% on Friday but declined 0.7% for the week. Despite rebounding 0.98% in a single day, the Dow recorded a weekly decline of 1.6%.
International oil prices should be viewed in the same way. Although Brent crude fell 2.8% on Friday, it had risen approximately 9% over the week.
Ultimately, the key point of this rebound is not simply that 'stocks rose despite risks involving Iran.' Rather, oil prices that had previously pressured markets fell on Friday, while newly released U.S. inflation figures prompted stock and bond markets to establish new price levels ahead of the September FOMC meeting.
The Next Date to Watch Is September 16
The Federal Reserve will hold its regular FOMC meeting on 15–16 of September 2026. Economic projections are also scheduled to accompany the September meeting. The policy decision is scheduled to be announced at 2 p.m. U.S. Eastern Time on September 16, followed by a press conference at 2:30 p.m.
As of September 11, market expectations for an interest-rate increase had risen substantially, but the actual policy-rate decision had not yet been announced. Therefore, when assessing the next direction of U.S. stocks, it is useful to monitor three figures separately.
The first is international oil prices. Whether Brent crude rises again from its September 11 level of 104.61 dollars or continues declining will affect inflationary pressures.
The second is U.S. Treasury yields. In particular, it is important to distinguish movements in 2-year securities, which are sensitive to policy-rate expectations, from those in 10-year securities, which reflect longer-term growth and inflation expectations.
The third is the actual FOMC decision on September 16. Probabilities reflected in interest-rate futures before the meeting represent market expectations, not the outcome itself.
The U.S. stock market did not rise on September 11 because uncertainty surrounding Iran and the Middle East had disappeared. Instead, the S&P500, Nasdaq, and Dow rebounded 0.86%, 0.96%, and 0.98%, respectively, as Brent crude fell 2.8%, partially easing the pressure from its earlier surge. At the same time, the August CPI increased 0.4% month over month, further strengthening expectations for an interest-rate increase.
Viewed in isolation, the daily stock performance represents a rebound. But considering weekly index performance and oil prices together, it is still too early to conclude that volatility has ended. The next key reference points for determining market direction are the FOMC meeting on 15–16 of September and subsequent movements in international oil prices.
※ This article is provided for informational purposes to help readers understand market developments and does not constitute an investment recommendation for any particular stock or asset. Final investment decisions and responsibility rest with the individual investor.
Related Articles
The Reference Time Is 2026-09-13 at 21:01 Korea Standard Time.
이 포스팅은 쿠팡 파트너스 활동의 일환으로, 이에 따른 일정액의 수수료를 제공받습니다.