

Why a Recovery Above USD 65,000 Alone Is Not Enough to Confirm a Trend Reversal
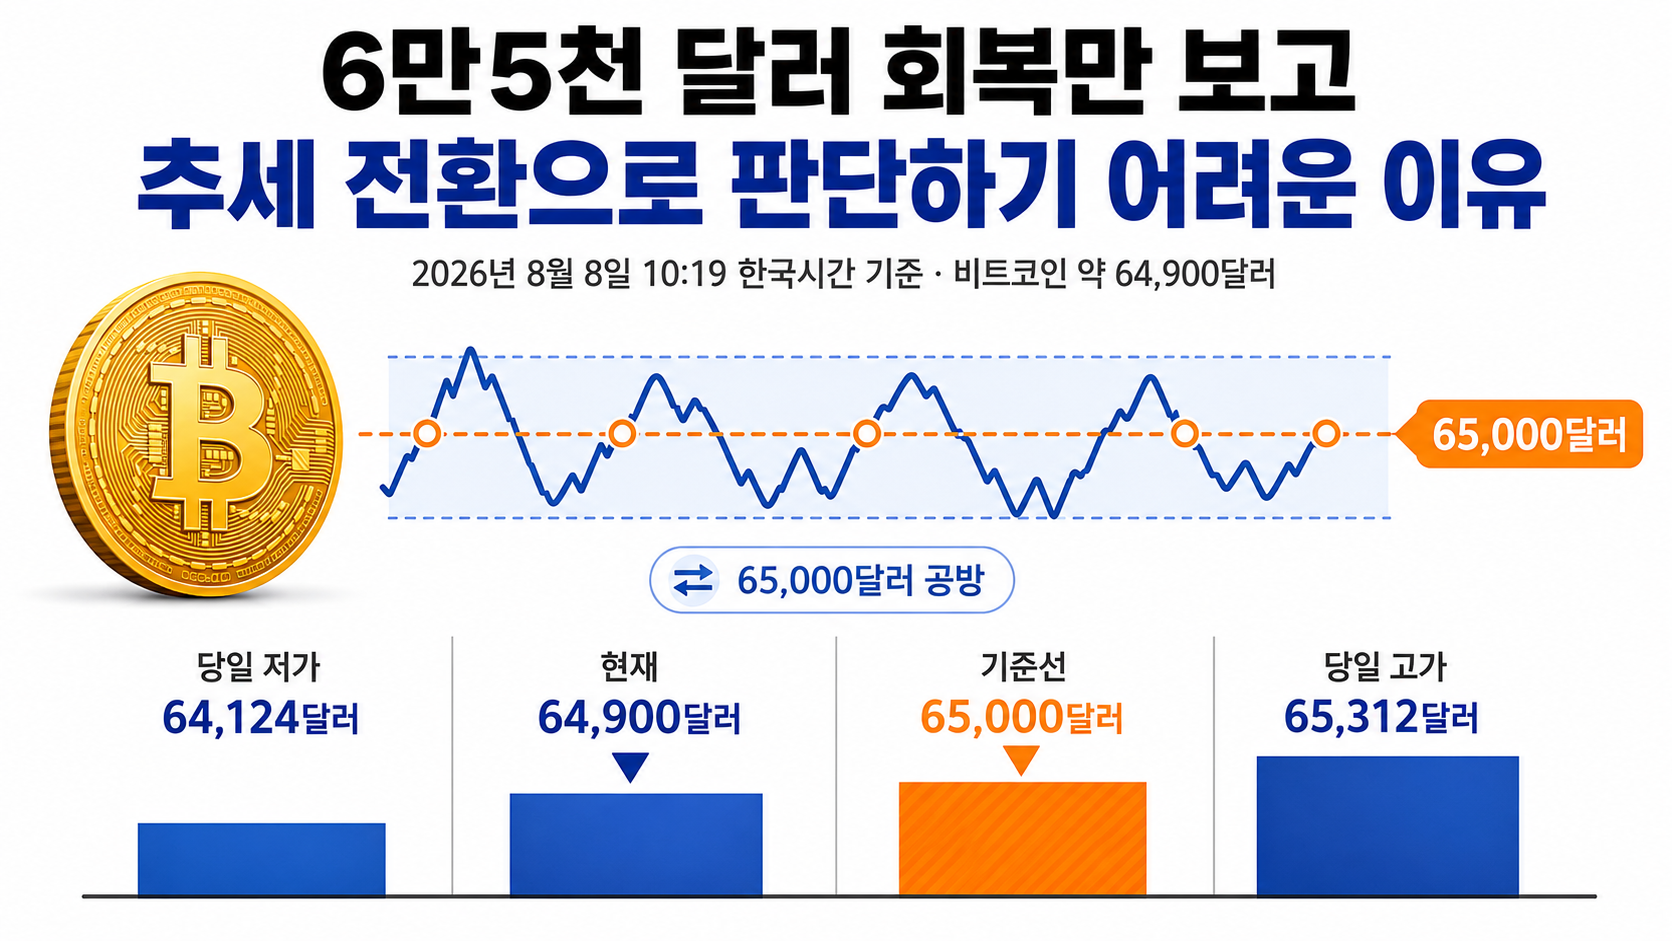
Bitcoin is trading at approximately USD 64,900 as of 10:19 Korea time on 2026-08-08. The observed trading range for the day is approximately 6 million 4,124~USD 65,312. Although Bitcoin has been moving above and below USD 65,000, it is still difficult to conclude that it has decisively broken out of its trading range.
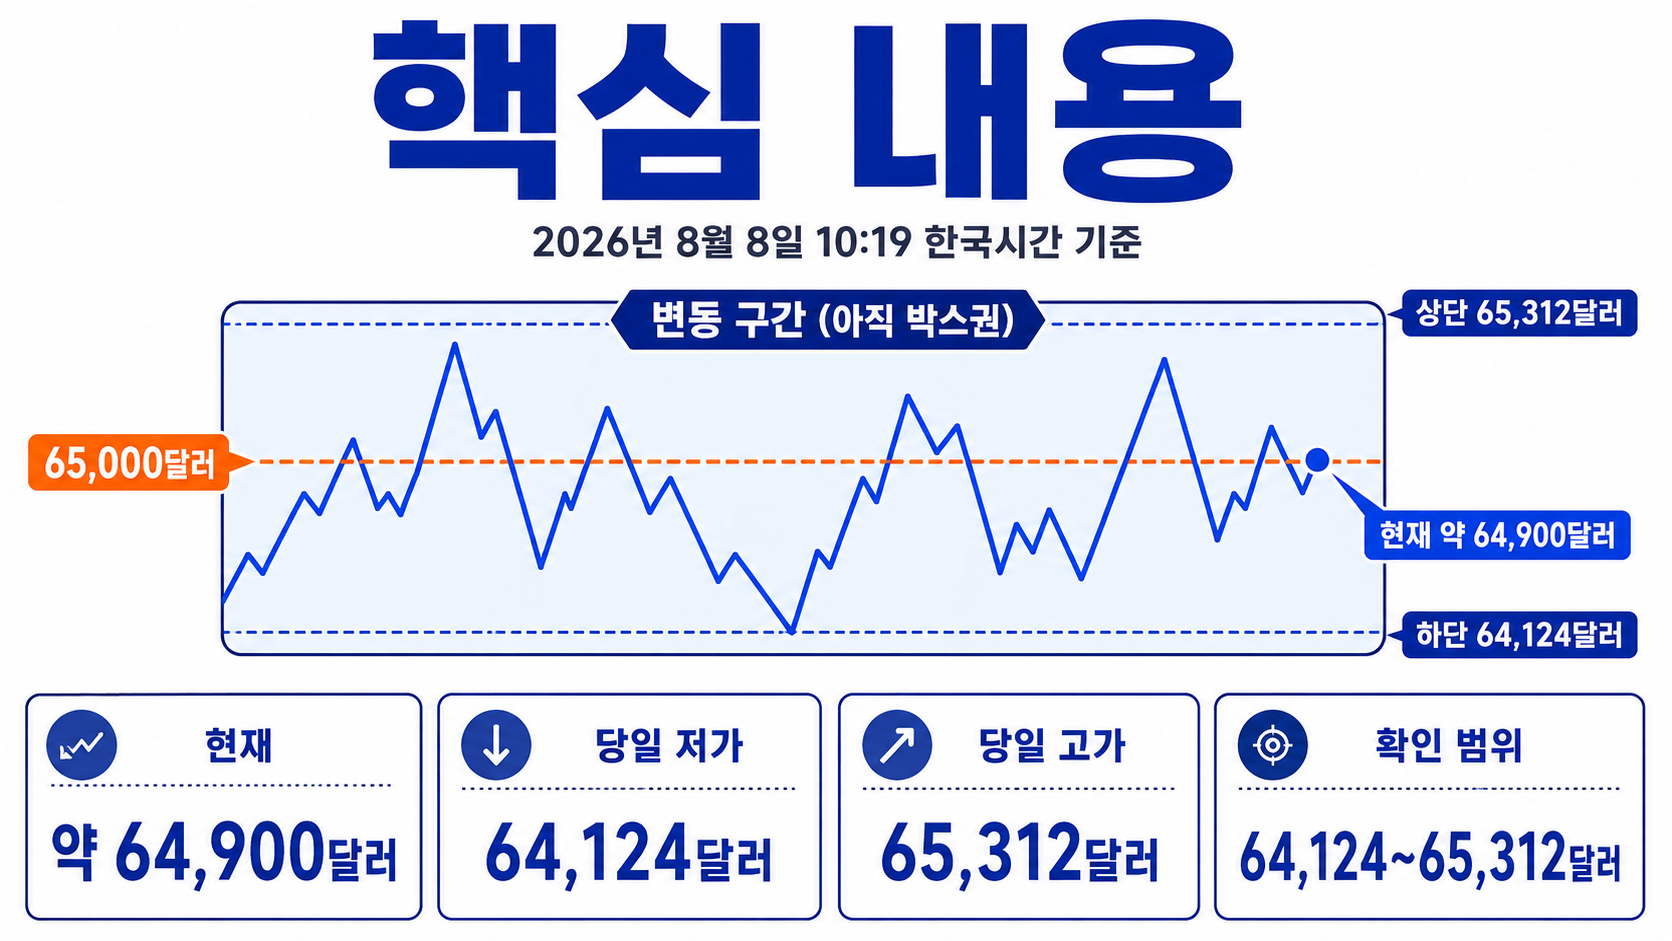
The recent rebound has been supported by both easing concerns about interest rate hikes following weaker US employment data and renewed net inflows into US spot Bitcoin ETFs. However, a price rebound does not mean that the decline from the previous peak has been fully recovered.
Comparing the previous high of approximately USD 126,200 reached in October 2025 with the current USD 64,901, the decline is approximately 48.6%.
Author's Calculation
Reference values: USD 126,200 → USD 64,901
Formula: (64,901 - 126,200) ÷ 126,200 × 100
Result: Approximately -48.6%
The current market is therefore better characterized as an attempt to rebound after Bitcoin fell to roughly half its all-time high. This is why a price cannot be considered undervalued simply because it is cheaper than it was at its peak.
Spot ETF Inflows Have Resumed, but Their Strength Also Matters
US spot Bitcoin ETFs have begun recording net inflows again in August. Data compiled on August 6 showed net inflows of approximately 1 hundred million USD 37,600,000, while the latest figures for August 7 confirmed net inflows of approximately USD 15,000,000.

The important distinction here is between whether money is flowing in and how much money is flowing in. Even if inflows continue for several consecutive days, a decline in daily inflow amounts could mean that the buying pressure supporting prices is weakening.
ETF figures may differ on the same day depending on each data provider's update schedule and when its reporting is finalized. It is therefore more useful to examine whether the direction of fund flows remains consistent over several days rather than focusing on a single day's figure.
If Bitcoin prices fail to rise despite continued ETF net inflows, it is also worth examining whether selling by existing holders is offsetting the incoming capital.
Why US Employment Data Matters for Bitcoin

US nonfarm payroll employment in July fell by 2 ten thousand 3,000 people, while the unemployment rate was reported at 4.1%. As employment weakened more than expected, market participants began assigning a lower probability to additional Federal Reserve interest rate hikes.
Because Bitcoin does not pay interest, an extended period of high interest rates can make it relatively less attractive. Conversely, when upward pressure on market interest rates eases, conditions may become more favorable for risk assets such as stocks and cryptocurrencies.
However, deteriorating employment conditions do not always lead to higher Bitcoin prices. If slowing employment growth raises fears of a recession, investors may become more inclined to reduce their exposure to risk assets altogether.
Rather than assuming that weaker employment automatically means higher Bitcoin prices, it is more useful to follow the sequence of employment → interest rate expectations → the dollar and bond yields → changes in risk appetite to understand actual market movements.
August 12 and September 15–16: Key Dates That Could Trigger the Next Wave of Volatility
In the near term, the first event to watch is the release on August 12 of the US Consumer Price Index (CPI) for July. If inflation exceeds expectations, concerns about further interest rate hikes could intensify again. Conversely, easing inflationary pressure could be interpreted as a favorable development for Bitcoin.

The Federal Reserve maintained its target interest rate range at an annual 3.50~3.75% on July 29. The next regularly scheduled FOMC meeting is set for September 15–16.
Rather than watching prices alone, it is better to monitor the following four factors together.
1. The direction of daily net inflows and outflows for US spot Bitcoin ETFs
2. The difference between the US CPI released on August 12 and market expectations
3. Movements in US Treasury yields and the dollar
4. Whether sustained buying interest emerges in the 6 million 5 thousand~USD 66,000 range
In particular, briefly moving above USD 65,000 is not the same as maintaining that price level for several days.
What to Examine Before Making Bitcoin Price Predictions
Predicting Bitcoin's short-term price with a single number is unreliable. Interest rates, ETF flows, geopolitical risks, selling by long-term holders, and derivatives positions can all move in conflicting directions at the same time.
Under current conditions, dividing the outlook into three scenarios is a practical approach.
If the Price Holds Above 6 Million 5 Thousand~USD 66,000
If ETF net inflows also continue, this would provide another reason to examine whether Bitcoin is breaking away from the bearish trend that has persisted since July. However, a short-term breakout alone does not confirm the start of a new uptrend.
If the Price Continues Trading Between 6 Million 3 Thousand~USD 65,000
This could be viewed as a sideways trading range in which buying and selling pressure are balanced. With no clear direction established, economic indicators and ETF fund flows are more likely to determine the next move.
If Bitcoin Falls Below Its Recent Low Again
This could indicate that selling pressure is stronger than the capital flowing into ETFs. In that situation, identifying the reasons for the decline should take priority over assuming that a rebound is inevitable simply because prices have already fallen significantly.
Judgments That First-Time Bitcoin Investors Should Be Especially Careful to Avoid
A substantial decline from an all-time high does not automatically mean that Bitcoin is cheap enough to buy. The percentage decline from a peak only indicates the current price's relative position; it is not a measure of fair value.
ETF net inflows are not a guarantee of rising prices either. Existing investors may increase their selling even as institutional capital enters the market, and macroeconomic conditions can change rapidly.
Leveraged products carry greater risks than spot Bitcoin. Even relatively small price movements can trigger forced liquidations, so the risks of leveraged positions should not be evaluated using the same criteria as spot price forecasts.
Another mistake is relying too heavily on specific price predictions. No method has been demonstrated to reliably predict Bitcoin's price several months into the future, and models that performed well in the past may produce very different results under different market conditions.
What to Check From Here
Anyone continuing to monitor Bitcoin's current market conditions does not need to follow every complicated indicator.
First, check whether Bitcoin can maintain its price around USD 65,000. Next, examine the direction of flows into US spot ETFs, and compare bond yield movements with Bitcoin's price movements after the CPI release on August 12 to see whether they move in the same direction.
The next step is to monitor how market interest rate expectations change ahead of the FOMC meeting on September.
Bitcoin's price being substantially below its previous all-time high, the resumption of ETF net inflows, and weaker employment data are all factors worth monitoring. However, none of them guarantees that Bitcoin will rise or that an investment will generate a profit.
Bitcoin is an asset that can experience significant price fluctuations even over short periods. Whether to invest and how much to allocate should be determined separately based on each individual's financial circumstances and ability to tolerate losses.
※ This article is provided for informational purposes to help readers understand market trends and does not constitute a recommendation to invest in any particular security or asset. All final investment decisions and responsibilities rest with the individual investor.