

How to Read 50-Day and 200-Day EMA and Moving Average Crossovers How to Read 50-Day and 200-Day EMA and Moving Average Crossovers: 3 Things to Check Before the Crossover
이 포스팅은 쿠팡 파트너스 활동의 일환으로, 이에 따른 일정액의 수수료를 제공받습니다.
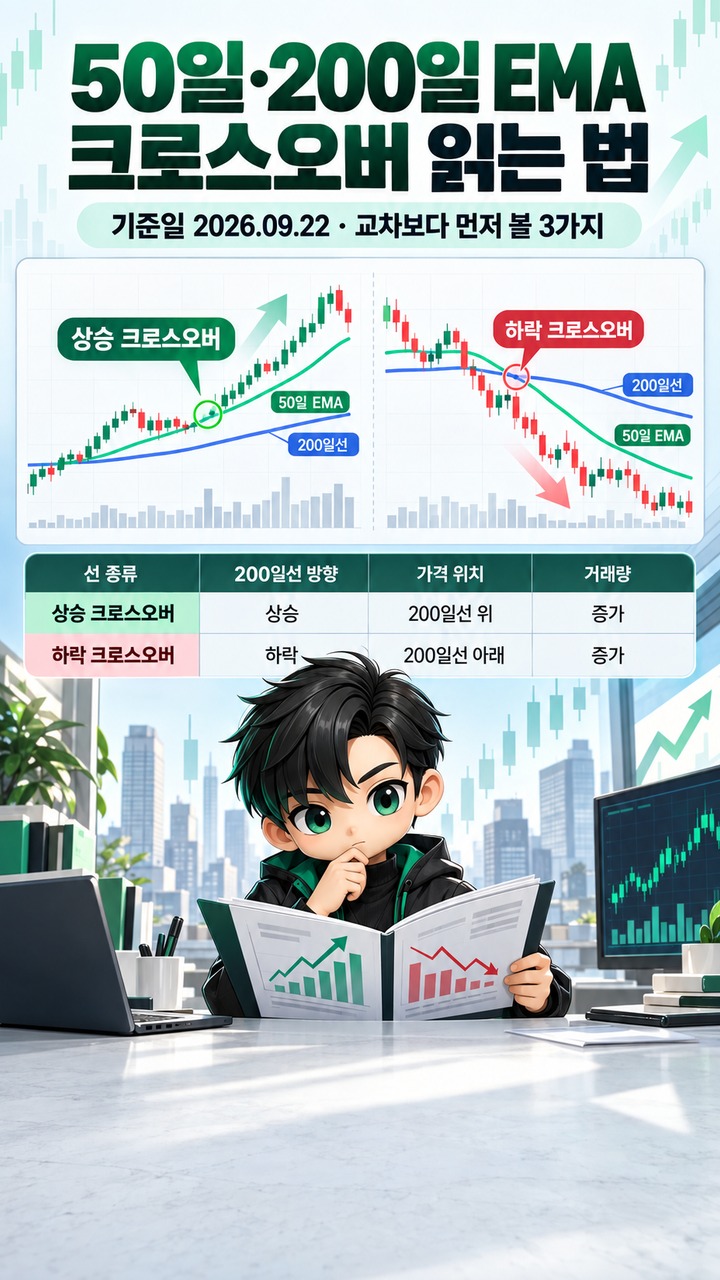
When the 50-day moving average crosses above the 200-day moving average from below, it is interpreted as a bullish crossover. Conversely, when it crosses below from above, it is interpreted as a bearish crossover. However, based on technical analysis materials reviewed as of 2026-09-22, rather than confirming a medium- to long-term trend reversal from a single crossover, it is more appropriate to consider the type of moving average, the direction of the 200-day moving average, price position, trading volume, and whether a breakout has occurred.

What Does a Crossover Between the 50-Day and 200-Day Moving Averages Indicate?
A moving average (MA) is a trend indicator that averages prices over a specified period to smooth out short-term fluctuations. The 50-day moving average responds more quickly to recent price changes than the 200-day moving average, while the 200-day moving average provides a smoother view of longer-term price movements.

When the 50-day moving average crosses above the 200-day moving average from below, the pattern is generally called a golden cross. Conversely, when the 50-day moving average crosses below the 200-day moving average from above, it is called a death cross.
The important point is that both lines are calculated using historical prices. Rather than predicting a market bottom or top in advance, a crossover is primarily a lagging signal confirming that the trend's condition may be changing after price movements have accumulated.
Even With the Same 50-Day and 200-Day Periods, EMA and SMA Signals May Occur at Different Times

MA is a general term for moving averages, with SMA and EMA being two common calculation methods.
An SMA (Simple Moving Average) calculates the average by assigning equal weight to prices within the selected period. For example, a 50-day SMA gives equal weight to prices from the most recent 50 periods.
An EMA (Exponential Moving Average) assigns greater weight to more recent prices. As a result, when the same period is used, an EMA may respond more sensitively to recent price changes than an SMA.
This difference matters when interpreting crossovers. A chart comparing the 50 EMA with the 200 EMA cannot be assumed to produce crossovers at the same time as a chart comparing the 50 SMA with the 200 SMA. Although an EMA responds more quickly to changes, it may also be more affected by short-term price movements.
Therefore, when comparing your chart with someone else's chart or analysis, it is advisable to first check whether the 50-day and 200-day moving averages are SMAs or EMAs. Identical period settings do not necessarily produce identical signals.

To Assess a Medium- to Long-Term Trend Reversal, First Check the Direction of the 200-Day Moving Average and Price Position
Before focusing on whether a bullish crossover has occurred, it is important to examine the direction of the longer-term moving average itself.
When evaluating a potential uptrend, you can check whether the price is above the 200-day moving average and whether that moving average is also rising. Conversely, if the price is below the 200-day moving average and the moving average is declining, this is commonly interpreted as indicating that the longer-term trend is also pointing downward.
For example, if the 50-day moving average has barely crossed above the 200-day moving average, but the 200-day moving average is still declining and the price remains below it, it is difficult to conclude that a long-term bullish reversal has been completed based on the crossover alone.
Conversely, whether the crossover direction, price position, and direction of the longer-term moving average all point the same way provides additional information for assessing the current trend.
Check Breakouts and Trading Volume After a Crossover
In technical analysis, rather than relying on a single indicator in isolation, analysts often examine whether other elements of price structure confirm the same direction.
Following a bullish crossover, you can additionally check whether the price breaks above an existing resistance zone and whether trading volume supports the move. Following a bearish crossover, you can examine whether changes in price structure, such as a breakdown below a support zone, occur in the same direction.
Neither trading volume nor a breakout guarantees future price direction. The purpose is to avoid relying entirely on one crossover and instead evaluate several different pieces of information together.
Golden Crosses and Death Crosses Can Occur Repeatedly in Sideways Markets
Moving average crossovers can be particularly confusing when the market lacks a clear directional trend.
When prices fluctuate within a defined range, the shorter-term moving average may repeatedly cross above and below the longer-term moving average. For example, a bullish crossover may be followed shortly afterward by a crossover in the opposite direction.
Because an EMA is more sensitive to recent price changes than an SMA, these short-term fluctuations may appear more frequently in an EMA than in an SMA using the same period. Conversely, an SMA generally moves more smoothly, but its signals may appear later.
Therefore, rather than focusing solely on whether a crossover has occurred, it is important to distinguish whether the crossover occurred within a clearly established trend or during directionless price fluctuations.
Following This Order When Reading Charts Can Reduce Confusion
When using the 50-day and 200-day moving averages to assess medium- to long-term market trends, the following sequence is practical.
1. First, check whether the two moving averages are SMAs or EMAs.
2. Determine whether the 200-day moving average is rising, falling, or moving sideways.
3. Check whether the current price is above or below the 200-day moving average.
4. Identify the direction in which the 50-day moving average has crossed the 200-day moving average.
5. Check whether other factors, including support or resistance breakouts and trading volume, confirm the same direction.
6. Examine whether opposite crossovers repeatedly occur within short intervals during sideways trading conditions.
Following this sequence helps you move beyond simply memorizing a golden cross as a 'buy signal' and a death cross as a 'sell signal.' Instead, moving average crossovers can be used as tools for understanding the market's current trend structure.
The 50-day and 200-day crossover is not an indicator designed to predict exact market bottoms or tops. Because moving averages inherently lag behind prices, actual investment decisions should also consider the investment horizon, risk of loss, and other technical and fundamental information.
※ This article is provided for informational purposes to help readers understand market trends and does not constitute investment advice or a recommendation to buy or sell any particular security or asset. Final investment decisions and responsibility rest with the individual investor.
Related Articles
Based on Their Birth Years, Ki Hee-hyun and Lee Sang-yoon Have an Age Gap of 1 Years
Won Hyun-joon and Lee Soo-jin's October 4 Marriage: What the Two Actors Announced Themselves
이 포스팅은 쿠팡 파트너스 활동의 일환으로, 이에 따른 일정액의 수수료를 제공받습니다.