

October 21 KOSPI Outlook: Rebound, Sideways Trading, and Further Decline Scenarios After the 5552.74 Close
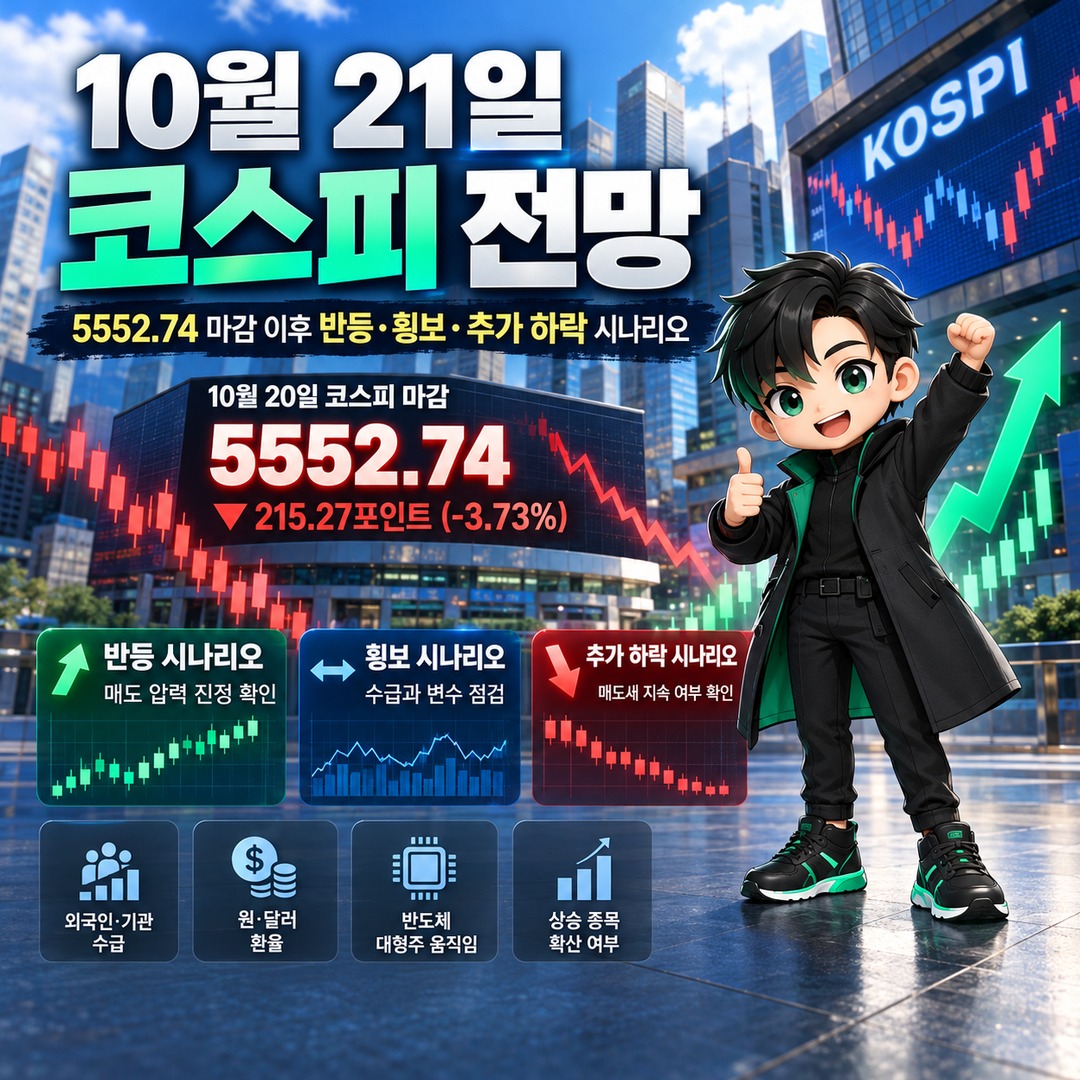
The key question for the KOSPI on 2026-10-21 is whether selling pressure is easing after the previous day's sharp 3.73% decline. On 20, the KOSPI closed at 5552.74, down 215.27 points. Today, investors should look beyond a simple index rebound and examine foreign and institutional investor flows, the Korean won–U.S. dollar exchange rate, movements in major semiconductor stocks, and whether gains are spreading across the broader market.
The current time in South Korea is 2026-10-21 at 9:14 a.m. (KST). The regular KOSPI trading session has already opened.
However, the data cutoff for this analysis is the market-closing report published on October 20 at 3:58 p.m. This article is therefore not a real-time intraday forecast. It is a conditional scenario analysis based on the previous trading day's closing data. It does not incorporate the intraday index level, foreign and institutional net trading, exchange-rate movements, or closing price for 21.
1. Summary of the KOSPI Close on October 20
| Category | Confirmed Figure for October 20 | Significance |
|---|---|---|
| KOSPI closing level | 5552.74 | Previous trading day's close |
| KOSPI point change | -215.27 points | Compared with the preceding trading day |
| KOSPI percentage change | -3.73% | A substantial decline |
| KOSDAQ closing level | 781.97 | Previous trading day's close |
| KOSDAQ percentage change | -3.33% | The KOSDAQ also declined |
| Recent trend | Decline following a 2-trading-day rebound | Need to reassess whether the rebound can continue |
Sources: NewsPim's market-closing report published on 2026-10-20 at 15:58, and YTN's report on the October 20 market close.
The KOSPI had rebounded over the preceding 2 trading days but failed to maintain its upward momentum on 20. With the KOSDAQ also falling by more than 3%, the session can be interpreted as one in which investor sentiment weakened.
However, the index's percentage decline alone cannot establish how much foreign investors sold or whether a particular sector led the downturn. Such conclusions require separate investor-flow and sector-level data.
Whether this decline represents a temporary correction or the beginning of further losses must be assessed through trading activity on 21.
2. What Is the Key Question for the October 21 KOSPI Outlook?
The most important question today is not how far the KOSPI might rise, but whether the intense selling pressure seen the previous day is beginning to ease.
A technical rebound can occur during the trading session following a sharp decline. However, an early rise in the index does not necessarily mean the downward trend has ended.
For a rebound to hold, investors need to determine whether buying is concentrated in a handful of large-cap stocks or spreading across the broader market. Conversely, if the index gives back its early gains and the number of declining stocks increases, the sustainability of the rebound should be assessed cautiously.
In particular, the 20 closing level of 5552.74 can serve as a reference point for evaluating today's market movements. Trading above that level alone does not confirm a reversal into an upward trend.
3. 4 Key Indicators to Monitor During Today's Trading Session
| Indicator | Positive Conditions | Warning Signs |
|---|---|---|
| Foreign and institutional investor flows | A sustained shift toward net buying or easing selling pressure | Increasing net selling by both investor groups |
| KRW/USD exchange rate | Easing upward pressure on the exchange rate and relatively stable movements | A sharp rise in the exchange rate accompanied by stock-selling pressure |
| Major semiconductor stocks | A sustained rebound in leading large-cap stocks that supports the index | A brief rebound in a few stocks followed by renewed declines |
| Market breadth | More stocks advancing and gains spreading across multiple sectors | The index rises while declining stocks outnumber advancing stocks |
This table outlines conditions to monitor during the 21 trading session. It does not represent actual results for that day.
Intraday estimates of foreign and institutional investor flows can change, so net buying observed at a particular moment should not be treated as confirmation of the market's final direction.
The KRW/USD exchange rate is also more useful when considered alongside foreign investor flows rather than in isolation. Stock selling can continue even when the exchange rate stabilizes.
Major semiconductor stocks are important indicators for understanding index movements. However, investors should distinguish between an index rise driven by a few large-cap stocks and a broader advance involving an increasing number of stocks across the market.
4. What Do KOSPI Levels 5500 and 5600 Mean?
Relative to the 20 closing level of 5552.74, 5500 is 52.74 points lower, while 5600 is 47.26 points higher.
These two figures are psychological round-number levels that make it easier for investors to understand the market's position.
However, this does not mean 5500 is a technically validated support level or 5600 is a confirmed resistance level. The support or resistance function of a particular price cannot be established without further analysis of trading volume, historical trading activity at different price levels, investor flows, and volatility.
Therefore, it would be inappropriate to treat 5500 as an unconditional buying zone or 5600 as an automatic selling level.
What matters is not whether the index briefly crosses a particular level, but how buying and selling pressure and broader market movements develop afterward.
5. Strategies for Rising, Sideways, and Falling Market Scenarios
The following three scenarios are not predicted outcomes. They are conditional situations that may be observed in today's market. It is not yet possible to determine which direction the market will take.
| Scenario | Confirmation Conditions | Invalidation Conditions | Response Principle |
|---|---|---|---|
| Rising market | Easing foreign and institutional selling, a sustained semiconductor rebound, and more advancing stocks | Gains are surrendered and selling pressure intensifies again | Monitor developments in stages rather than chasing rising prices |
| Sideways market | Fluctuations near the previous close, with mixed buying and selling signals | Price movements strengthen in one direction and investor flows align with that movement | Stay on the sidelines until the trading direction becomes clearer |
| Falling market | Intensifying selling pressure, continued semiconductor weakness, and more declining stocks | Selling pressure eases and a broad market rebound develops | Avoid new entries and review loss limits |
Rising Market Scenario
If the KOSPI recovers its previous closing level and selling pressure from foreign and institutional investors eases, a short-term rebound may become possible.
However, an increase in the index alone is not sufficient. Investors should also check whether gains in major semiconductor stocks are sustained and whether more stocks in other sectors begin to advance.
Sideways Market Scenario
If the KOSPI struggles to establish a clear direction around 5552.74, the market may be going through a process in which buyers and sellers are finding a balance.
In this situation, even active trading may fail to produce a clear directional trend. It is therefore important not to prematurely conclude that the market is moving decisively upward or downward.
Falling Market Scenario
If the previous day's selling pressure continues and major large-cap stocks weaken further, downside risk should be the primary concern.
In particular, if a falling index is accompanied by a widespread increase in declining stocks, investors should assess whether the weakness reflects broader market-wide risk aversion rather than problems affecting only a few individual stocks.
6. How Should Beginner Investors Respond?
Prices can move sharply on the trading day following a steep decline, but high volatility does not automatically create a reliable trading opportunity.
For beginner investors, it may be useful to observe market developments at several different points during the session rather than committing all available investment funds based on a single judgment.
Before placing trades, investors should also determine the maximum amount and percentage of losses they can afford to absorb. Appropriate loss limits depend on each investor's financial circumstances and risk tolerance, and no single standard applies to everyone.
Observing the market in stages is not a strategy that guarantees protection against losses. If prices continue falling, losses can still occur even when investments are made in separate installments.
7. Conclusion: Today's KOSPI Outlook
When evaluating the KOSPI on October 21, it is essential to distinguish between the confirmed previous-day closing level of 5552.74 and new market developments occurring today.
A rebound remains possible following the previous session's sharp decline. However, whether that rebound can continue depends on support from foreign and institutional investor flows, major semiconductor stocks, exchange-rate movements, and overall market breadth.
The central task today is not to predict whether the index will reach 5500 or 5600, but to determine whether selling pressure is genuinely easing.
Sources for the previous day's market close: NewsPim report · YTN report.
This outlook is a conditional analysis intended to help readers understand market conditions. It does not constitute a recommendation to buy or sell any particular stock or a guarantee of investment returns.