

How to Read Candlestick Charts: Understanding Open, Close, and Wicks Before Bullish and Bearish Candles
이 포스팅은 쿠팡 파트너스 활동의 일환으로, 이에 따른 일정액의 수수료를 제공받습니다.
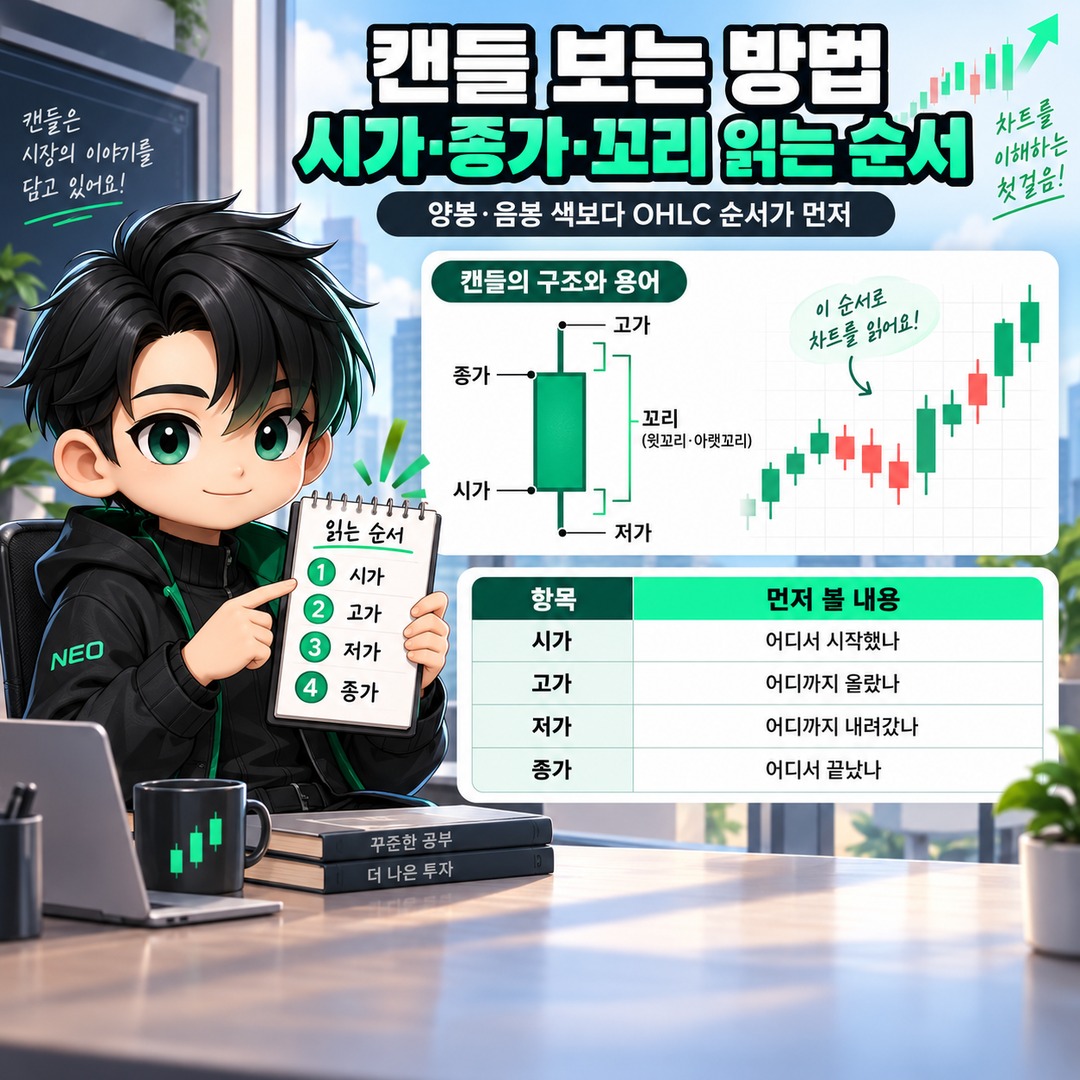
A single candlestick is a price record that shows the open, high, low, and close (OHLC) for a specified period. Rather than memorizing colors first, beginners can read candles more accurately by identifying where the price started, how far it moved, and where it finished. The colors used for bullish and bearish candles may vary depending on chart settings.
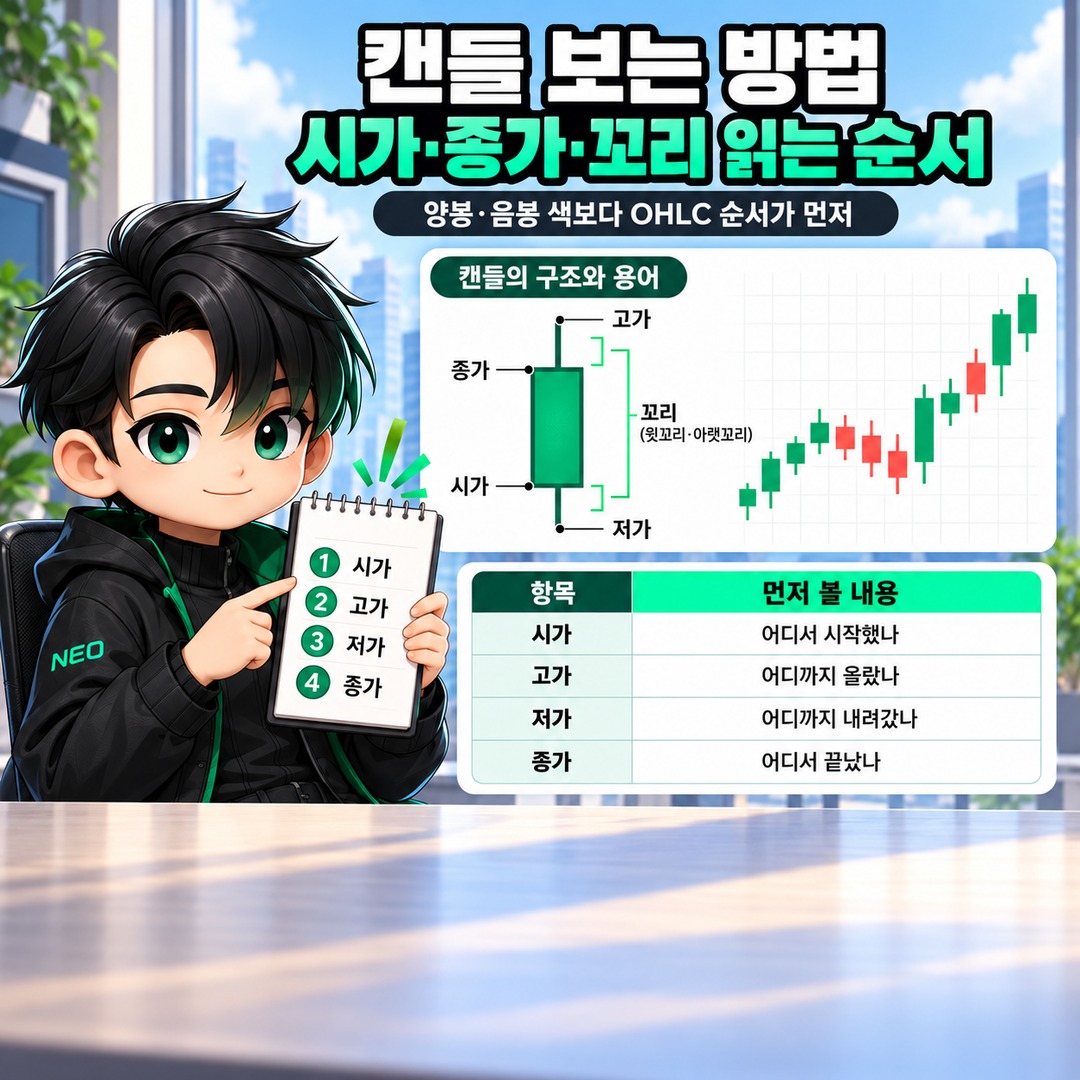
Each Candlestick Contains 4 Price Values
To read a candlestick, start by distinguishing the open, close, high, and low. The body represents the range between the opening and closing prices, while the lines extending beyond the body show how far the price moved toward its highest and lowest levels during that period.
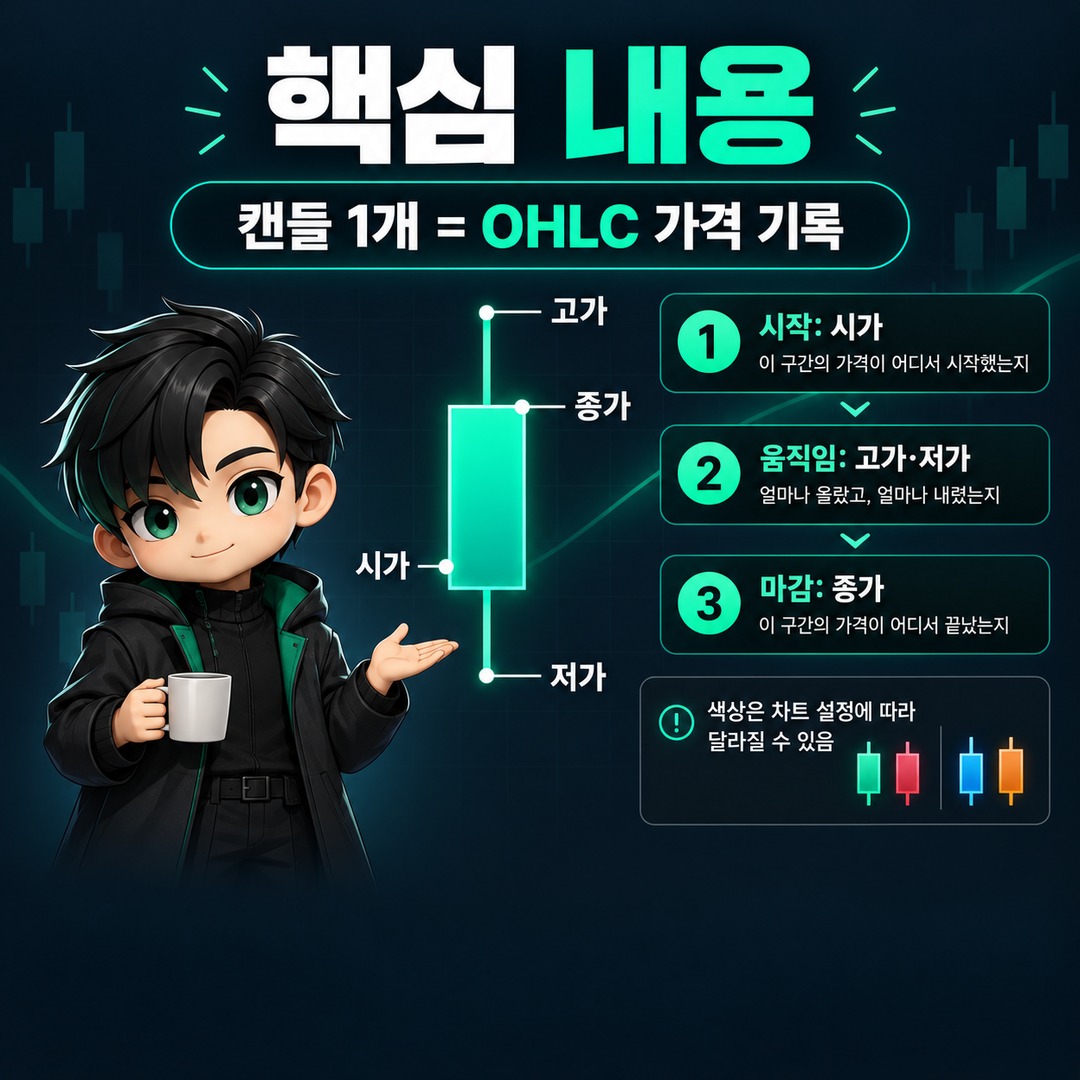
Open: The price at the beginning of the candlestick's period
High: The highest price recorded during that period
Low: The lowest price recorded during that period
Close: The price at the end of the candlestick's period
For example, if the opening price is KRW 10,000, the high is KRW 10,700, the low is KRW 9,800, and the closing price is KRW 10,500, the price started at KRW 10,000, moved within the range between KRW 9,800 and KRW 10,700, and finished at KRW 10,500.
In this case, the body extends from KRW 10,000 to KRW 10,500, the upper wick extends from KRW 10,500 to KRW 10,700, and the lower wick extends from KRW 9,800 to KRW 10,000.
Bullish and Bearish Candles Are Determined by the Open and Close, Not the Previous Day's Price
A candle is bullish when its closing price is higher than its opening price, and bearish when its closing price is lower than its opening price. This is also why you should not determine whether a stock rose compared with the previous day simply by looking at the candle's color.
For example, suppose the previous day's closing price was KRW 10,000.
If today's price opened at KRW 9,000 and closed at KRW 9,500, the closing price is KRW 500 higher than the opening price, making it a bullish candle. However, compared with the previous day's close of KRW 10,000, today's closing price of KRW 9,500 is KRW 500 lower.
Conversely, if the price opened at KRW 11,000 and closed at KRW 10,500, it would be a bearish candle, but the closing price would still be KRW 500 higher than the previous day's close of KRW 10,000.
Therefore, do not automatically interpret a bullish candle as a 'gain from the previous day' or a bearish candle as a 'decline from the previous day.' Instead, compare the current candle's opening and closing prices separately from the previous candle's closing price.
What Does the Length of a Candlestick's Body Tell You?
The length of the body shows how far apart the opening and closing prices are during the selected period. A longer body indicates a larger difference between the starting and ending prices, while a shorter body means the two prices are closer together.
For example, suppose two stocks both started the same trading day at KRW 10,000.
If Stock A closed at KRW 10,900, the difference between its opening and closing prices would be KRW 900. If Stock B closed at KRW 10,100, the difference would be KRW 100. All other factors aside, Stock A's bullish candle would have a longer body than Stock B's.
However, a single long bullish candle does not guarantee that the next candle will also rise. Candlesticks are tools that compress actual price movements during a particular period into a visual representation. Interpreting the direction of future prices is a separate matter.
Upper and Lower Wicks Show How Far Prices Moved Before Pulling Back
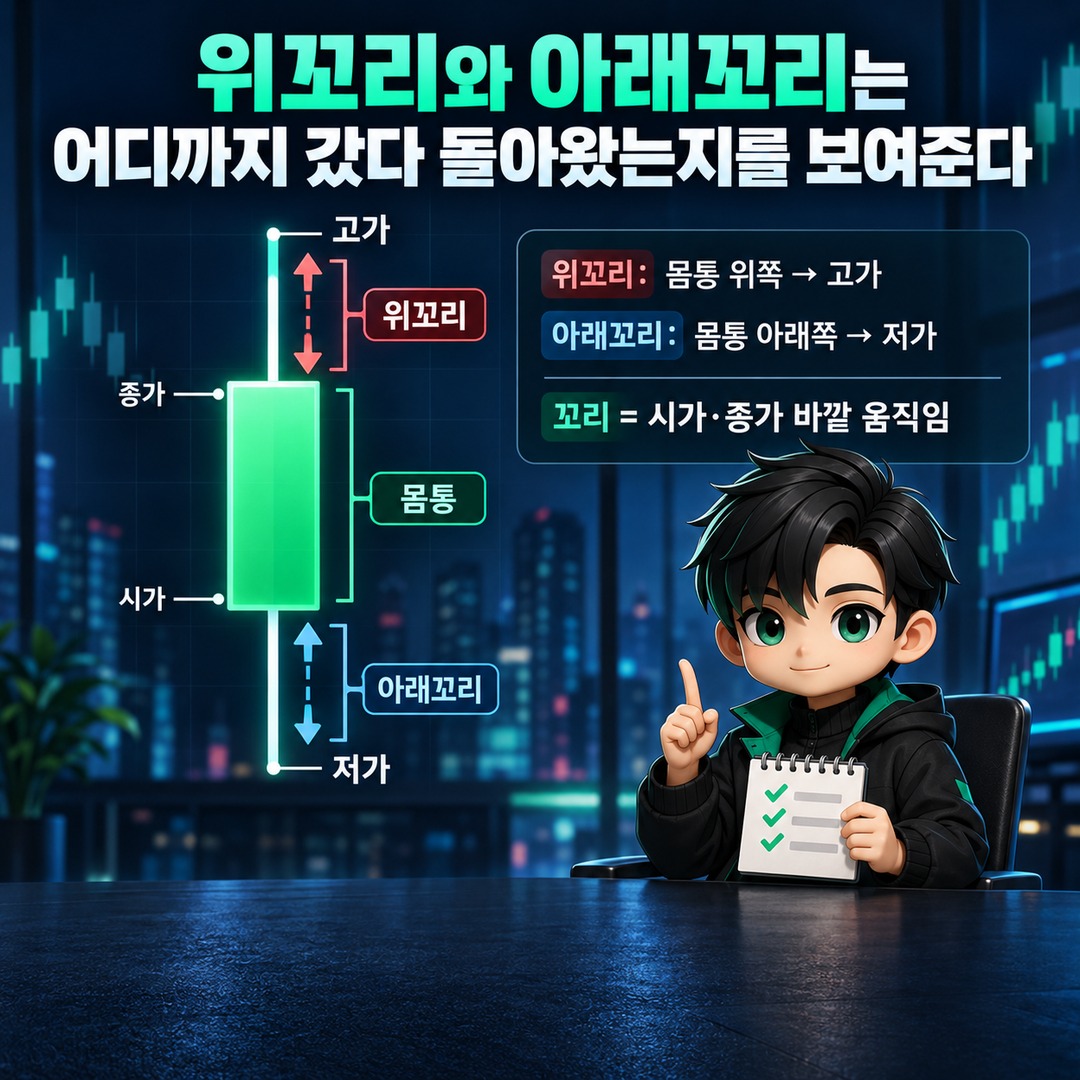
The upper wick represents the price range from the top of the body to the high, while the lower wick represents the range from the bottom of the body to the low. Looking at the wicks therefore helps you see how far prices moved beyond the opening or closing levels during that period.
For example, consider a bullish candle with an opening price of KRW 10,000, a high of KRW 11,000, a low of KRW 9,900, and a closing price of KRW 10,200. The price traded as high as KRW 11,000 during the session but closed at KRW 10,200. This leaves a relatively long upper wick between the high and the top of the body.
Conversely, if the opening price is KRW 10,000, the high is KRW 10,200, the low is KRW 9,000, and the close is KRW 10,100, the price fell as low as KRW 9,000 during the session before the closing price was established at KRW 10,100. This candle has a long lower wick.
The important point is that wicks show price movements that have already occurred. Treating a single long upper or lower wick as definitive evidence that prices will rise or fall next goes beyond the facts actually recorded in the candlestick.
Daily, Weekly, and Minute Candlesticks Apply the Same Principles to Different Timeframes
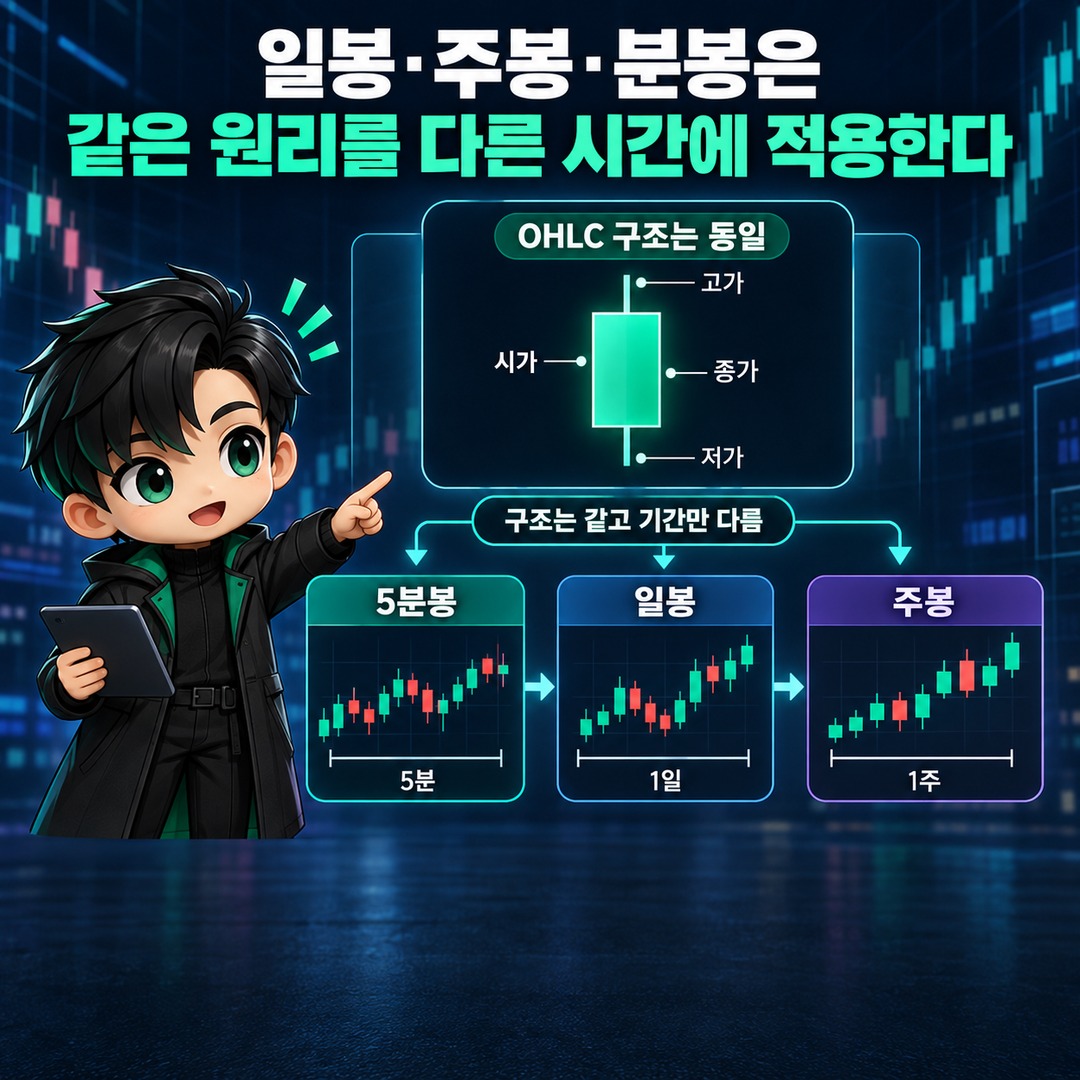
The structure of a candlestick remains the same; only the period represented by each candle changes. A 5-minute candle shows the open, high, low, and close over 5 minutes, while a daily candle shows those four prices over one day.
This is why candlesticks for the same stock can look different depending on the timeframe selected for the chart.
If you want to examine short-term price movements, you can use minute-based charts. To understand trends over longer periods, you can expand the timeframe to daily, weekly, or monthly charts. Rather than assuming candles from different timeframes have the same meaning, first check how much time each candle on your chart represents.
Read Candlesticks in This Order Instead of Relying on Colors
When looking at charts for the first time, it is helpful to read price information in the following order before trying to memorize complicated candlestick pattern names.
1. Check the candle's timeframe
First, determine whether you are looking at a 1-minute candle, a 5-minute candle, or a daily candle.
2. Compare the opening and closing prices
Identify where the price started and where it finished.
3. Check the high and low
Examine the full price range during the period.
4. Check the length of the body
Determine whether the difference between the opening and closing prices is large or small.
5. Examine the upper and lower wicks
See how far the price moved beyond the body.
6. Connect the candle with previous candles
Instead of viewing the current candle in isolation, identify its position within the preceding price movements.
Following this approach allows you to read the actual price information in candlesticks even when chart color settings, such as red and blue, differ.
Candlestick Colors May Differ Between Charts
You should not assume that all charts use the same colors to indicate rising and falling candles. Color conventions can vary between charting platforms and markets, and users may also customize these settings.
Therefore, when using an unfamiliar HTS (Home Trading System), MTS (Mobile Trading System), or exchange chart, it is safer to check the color settings for bullish and bearish candles first.
Instead of memorizing colors, check whether the closing price is higher or lower than the opening price. This lets you apply the same reading method even when switching between charts.
Why a Single Candlestick Is Not Enough to Make Buy or Sell Decisions
Candlesticks show price information recorded during the selected period, but they do not determine future prices. Even when two candlesticks have the same shape, the preceding price movements and the positions where those candles formed may differ.
Therefore, the first goal of reading candlesticks should not be to spot a particular shape and immediately trade. Instead, it is better to focus on accurately reconstructing price movements over a given period.
When you open a chart, try reading it this way first.
'It started at KRW 10,000. During the session, it reached a high of KRW 10,700 and a low of KRW 9,800. Finally, it closed at KRW 10,500.'
If you can construct this description simply by looking at a candlestick, you have correctly understood its basic structure. The next step is to examine how multiple candles develop together, along with trading volume, trends, and other factors.
No particular candlestick shape or historical price movement guarantees future returns. Actual investment decisions should also take factors beyond price information into account.
※ This article is provided for informational purposes to help readers understand market movements and does not constitute investment advice or a recommendation to invest in any particular stock or asset. Final investment decisions and responsibility rest with the individual investor.
Related Articles
What Is a Gap Up? Understanding Why a Stock Opens Higher and How to Identify Gap Filling
The Nasdaq Did Not Reach a New Record High on September 16
Nasdaq All-Time High on 27,122.09 Was 28.19 Points Above the June Record
이 포스팅은 쿠팡 파트너스 활동의 일환으로, 이에 따른 일정액의 수수료를 제공받습니다.