

Why Is the Youth Employment Rate 44.2% but the Unemployment Rate 6.8%? Understanding the Difference Using 100 People
이 포스팅은 쿠팡 파트너스 활동의 일환으로, 이에 따른 일정액의 수수료를 제공받습니다.
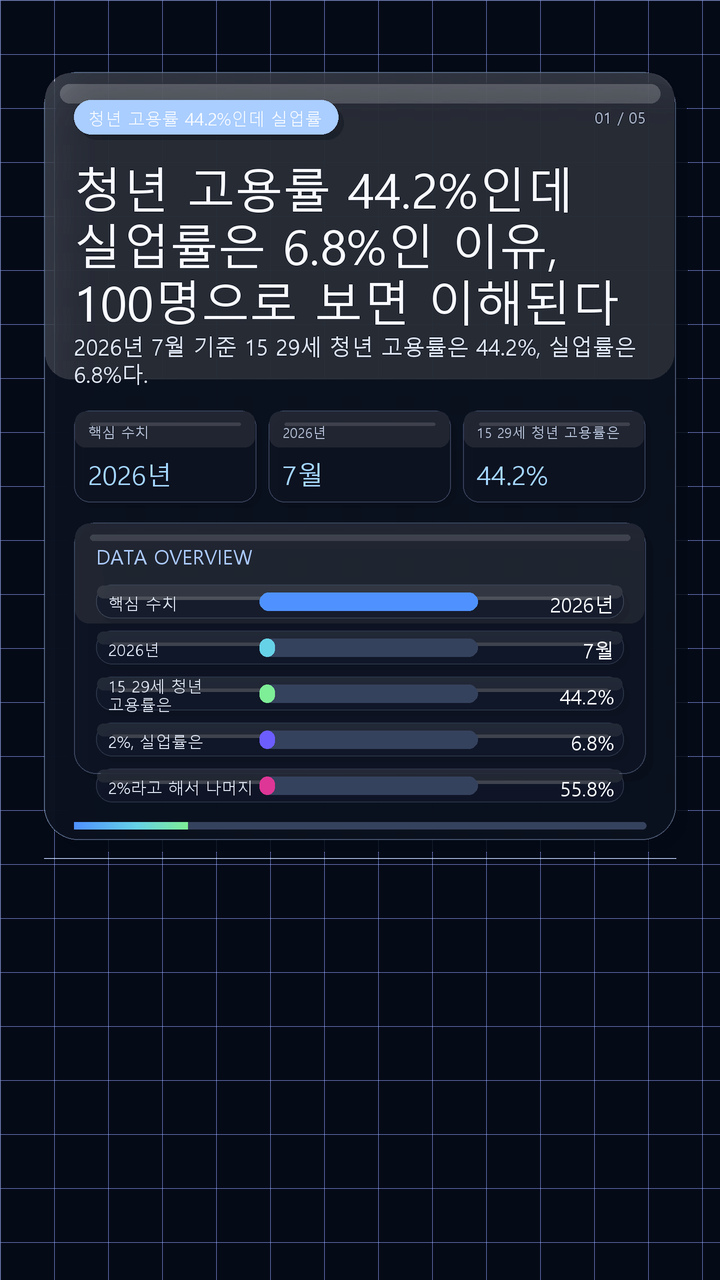
As of July 2026, the employment rate for young people aged 15–29 was 44.2%, while the unemployment rate was 6.8%. The reason these two figures differ so significantly is that they use different denominators. An employment rate of 44.2% does not mean that the remaining 55.8% are all unemployed.
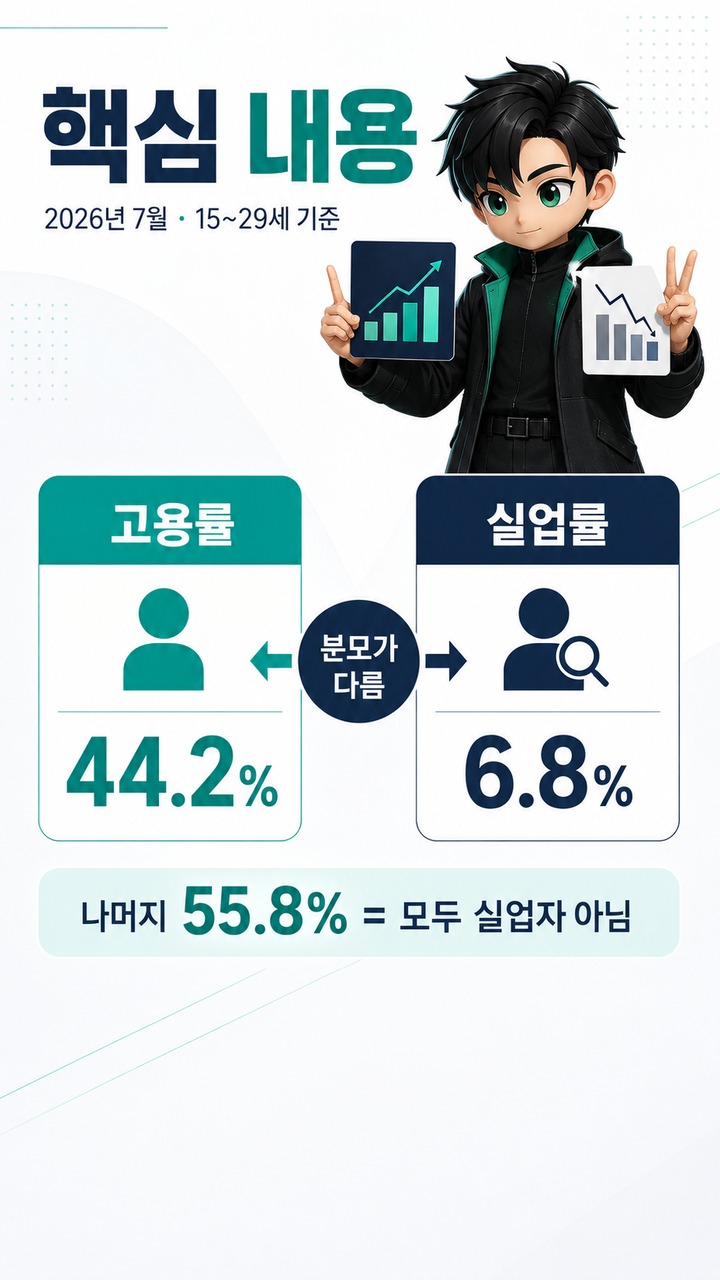
The employment rate measures how many people in the total youth population are employed. The unemployment rate, by contrast, is calculated using only the 'economically active population,' which consists of employed people and unemployed people actively seeking work. Because the youth population includes many economically inactive people, such as students and those preparing for employment, understanding the difference between these indicators is essential.
An Employment Rate of 44.2% Means Approximately 44 Out of 100 Young People Are Employed
The formula for calculating the employment rate is straightforward.
Employment rate = Employed persons ÷ Population in the relevant age group × 100
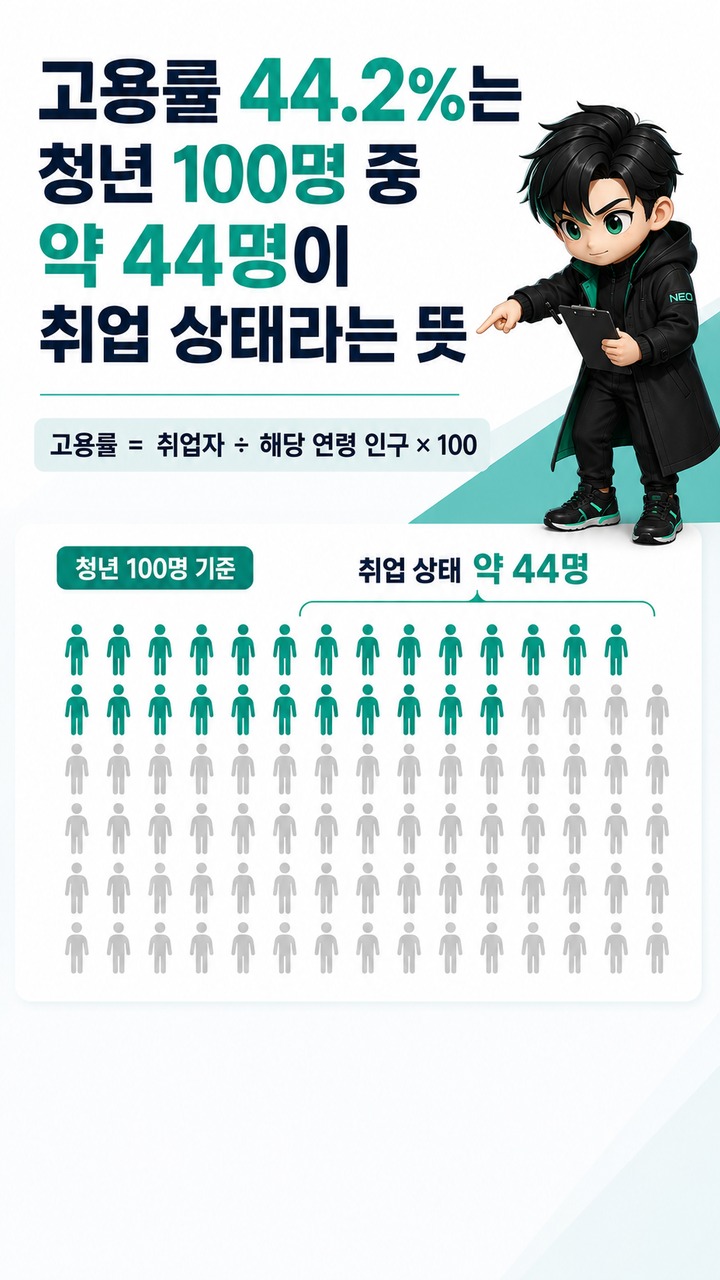
In the Economically Active Population Survey conducted by the national statistics agency, the youth population is defined as people aged 15–29. In July 2026, approximately 3441 thousand young people were employed, and the employment rate was 44.2%.
Looking at the employment rate alone, this means that approximately 44 out of every 100 young people were classified as employed under the survey's criteria.
The important point is that the remaining approximately 56 people should not all be considered 'unemployed.' People attending school or not currently looking for work may instead be classified as economically inactive.
Under the national statistics agency's criteria, someone who worked at least 1 hours for income during the survey reference week is also classified as employed. If a student worked a part-time job, they are classified as employed regardless of their student status.
The Unemployment Rate of 6.8% Is a Percentage of the Economically Active Population, Not All Young People
The unemployment rate is calculated differently from the outset.
Unemployment rate = Unemployed persons ÷ Economically active population × 100
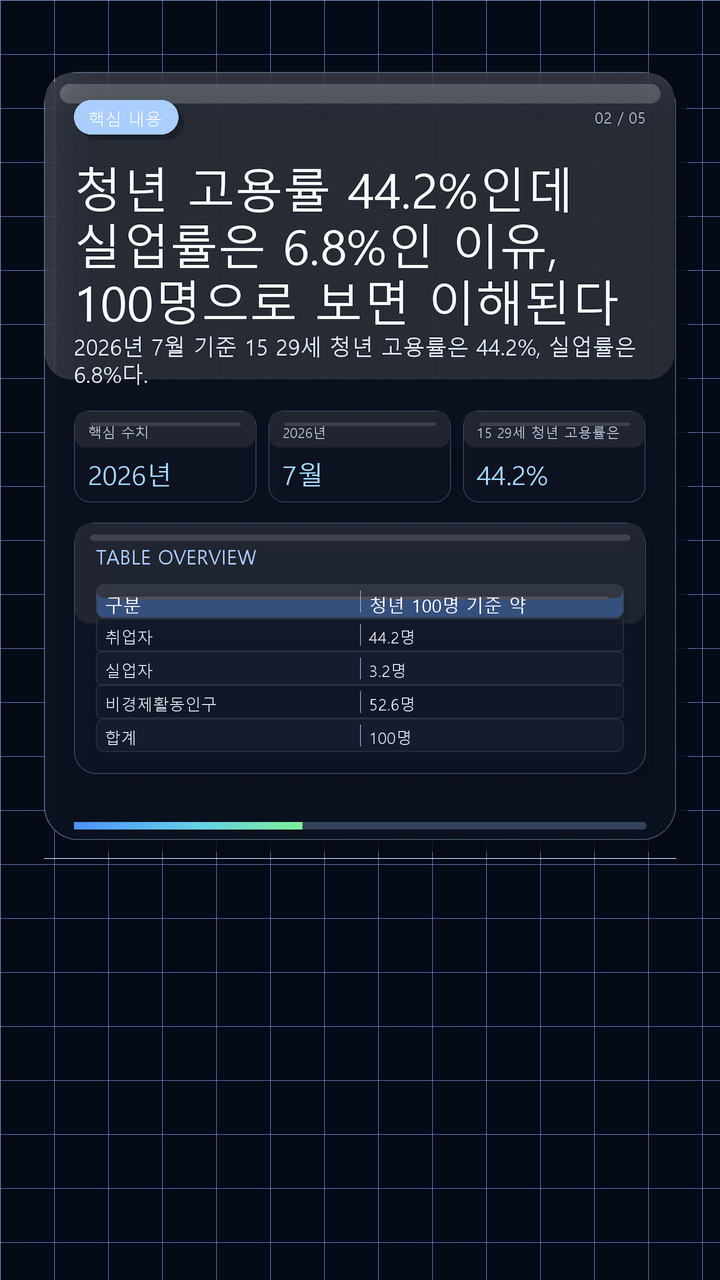
Here, the economically active population consists of employed persons + unemployed persons. Economically inactive people, including those attending school or not seeking work, are excluded from the denominator used to calculate the unemployment rate.
In the Economically Active Population Survey, simply not having a job is not enough to be classified as unemployed. A person must meet conditions such as not having worked during the survey reference period, having actively searched for a job recently, and being available to start work if offered employment.
Therefore, 'I currently do not have a job' and 'I am statistically classified as unemployed' do not mean the same thing.
Converting the Figures to 100 Young People Reveals the Difference Between 44.2% and 6.8%
According to the official youth employment indicators for July 2026, approximately 3441 thousand people were employed, 251 thousand people were unemployed, and 4096 thousand people were economically inactive. Together, these three groups totaled approximately 7788 thousand people.
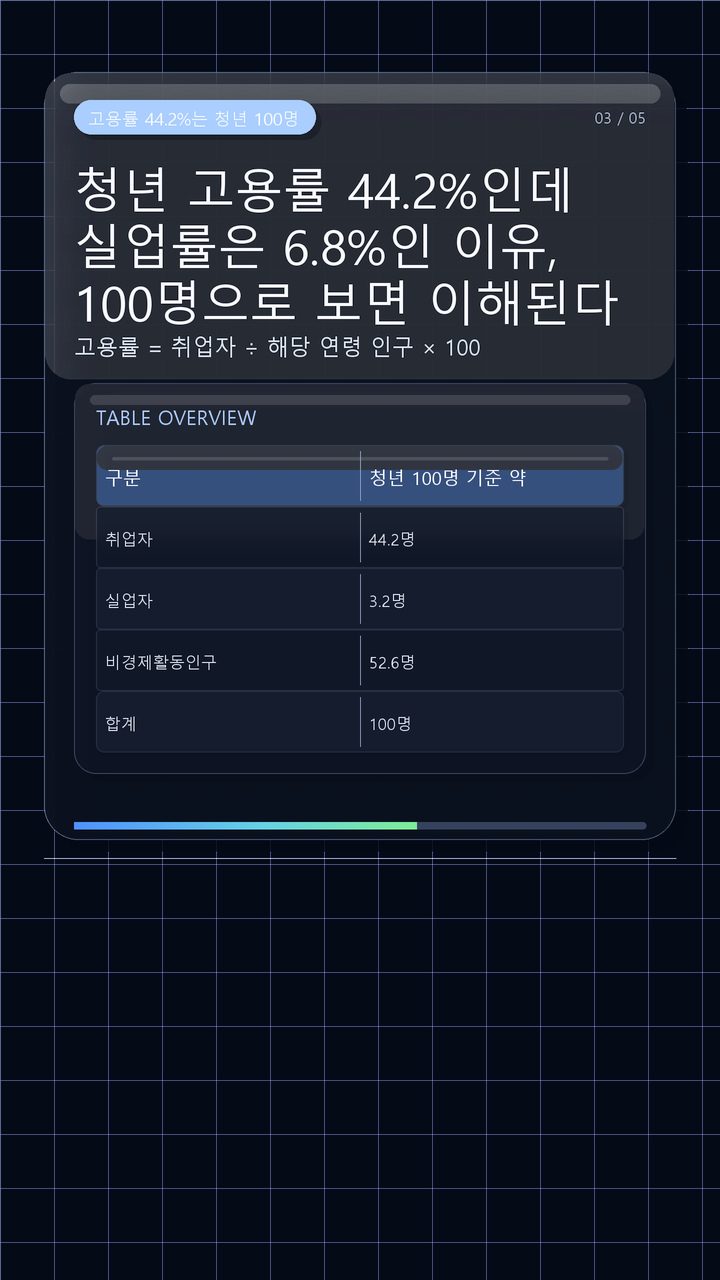
When these figures are simplified to a population of 100 people, the results are as follows. Because the calculations use published figures rounded to units of ten thousand people, there may be slight differences in the decimal places.
| Category | Approximate number out of 100 young people |
|---|---|
| Employed | 44.2 people |
| Unemployed | 3.2 people |
| Economically inactive | 52.6 people |
| Total | 100 people |
The economically active population is approximately 47.4 people, consisting of 44.2 employed people and 3.2 unemployed people.
Therefore, the unemployment rate is not 3.2%, the proportion of unemployed people among all 100 young people. Instead, it is calculated as:
3.2 ÷ 47.4 × 100 ≈ 6.8%
In other words, there is no contradiction in having a youth employment rate of 44.2% and an unemployment rate of 6.8% at the same time.
A Low Youth Employment Rate Does Not Mean Everyone Else Has Failed to Find Work
When interpreting the youth employment rate, it is also important to remember that the survey covers people aged 15–29.
The 15–29 age group includes people who are still attending high school or university. By contrast, employment rates are significantly different among people in their late 20s, when entry into the workforce becomes more common.
As of July 2026, the employment rates were 42.6% for those aged 20–24 and 71.4% for those aged 25–29. Although the employment rate for people aged 25–29 also fell by 0.6% percentage points from the same month a year earlier, it remained substantially higher than the overall employment rate of 44.2% for those aged 15–29.
Therefore, the figure 'youth employment rate 44.2%' should not be interpreted as meaning that 'more than half of young university graduates have failed to find employment.'
This is because a single youth employment statistic includes people from different age groups and with different economic activity statuses.
The 367 Thousand Young People Classified as 'Resting' Are Also Statistically Different From the Unemployed
In July 2026, the number of young people classified as 'resting' was 367 thousand. This represented a decrease of 69 thousand from the same month a year earlier, and their share of the youth population was 4.7%.
The 'resting' category must also be distinguished from unemployment.
'Resting' is one of the activity statuses included within the economically inactive population. According to the Korean Statistical Information Service, the economically inactive population includes people who were neither employed nor unemployed during the survey period. Within that population, activity statuses are further divided into categories such as childcare, housework, and resting.
Therefore, the following three statements have entirely different meanings:
A person does not have a job.
A person is statistically classified as unemployed.
A person is classified as 'resting' within the economically inactive population.
When examining youth employment difficulties, treating these three categories as equivalent can easily lead to a misunderstanding of actual labor market conditions.
The Graduate Employment Rate of 69.5% Should Not Be Directly Compared With the Youth Employment Rate of 44.2%
Another common source of confusion when examining employment difficulties among university graduates is the difference between the employment rate of university graduates and the overall youth employment rate.
According to the Ministry of Education's employment statistics for graduates of higher education institutions in 2024, the employment rate was 69.5%. However, these statistics examined the employment status as of 2024-12-31 of people who graduated from higher education institutions in February 2024 and August 2023.
The denominator is also different.
The higher education graduate employment rate does not simply use all 634,904 graduates as its denominator. Instead, it is calculated using graduates eligible for employment, excluding those pursuing further education, entering military service, unable to work, officially recognized as excluded, and international students. In 2024, there were 542,988 people eligible for employment and 377,120 employed graduates.
By contrast, the youth employment rate of 44.2% is based on the entire population aged 15–29, rather than university graduates from a particular year.
Therefore, placing 69.5% and 44.2% side by side and asking which statistic is correct is not a valid comparison. The two figures differ in their survey populations, reference dates, and calculation methods.
Four Indicators Should Be Examined Together to Understand Youth Employment Difficulties
To understand youth employment conditions in July 2026, it is more accurate to examine several indicators together rather than relying solely on the employment rate.
The employment rate of 44.2% shows the proportion of the total youth population that is actually working.
The unemployment rate of 6.8% indicates the proportion of unemployed people among those participating in the labor force and seeking employment.
The employment rate of 71.4% among people aged 25–29 provides a separate view of young people who are less likely to still be attending school and are entering the main employment stage of their lives.
In addition, examining the officially reported expanded youth unemployment rate of 16.6% alongside figures such as the 367 thousand young people classified as 'resting' can reveal employment difficulties that are not fully captured by the conventional unemployment rate.
Ultimately, a youth employment rate of 44.2% does not mean that 55.8% of young people are unemployed. When the figures for July 2026 are simplified to 100 young people, approximately 44 are employed, around 3 are unemployed, and approximately 53 are economically inactive. The unemployment rate of 6.8% is calculated using only the economically active population among these groups.
Simply remembering that the two indicators use different denominators can help you interpret youth employment statistics much more accurately.
※ This article is provided for reference to help readers understand market trends and does not constitute an investment recommendation for any particular stock or asset. Final investment decisions and responsibility rest with the individual investor.
Related Articles
이 포스팅은 쿠팡 파트너스 활동의 일환으로, 이에 따른 일정액의 수수료를 제공받습니다.