

Stock Market on September 3: KOSPI Closes at 6,579.48, Signals After a 243-Point Intraday Swing
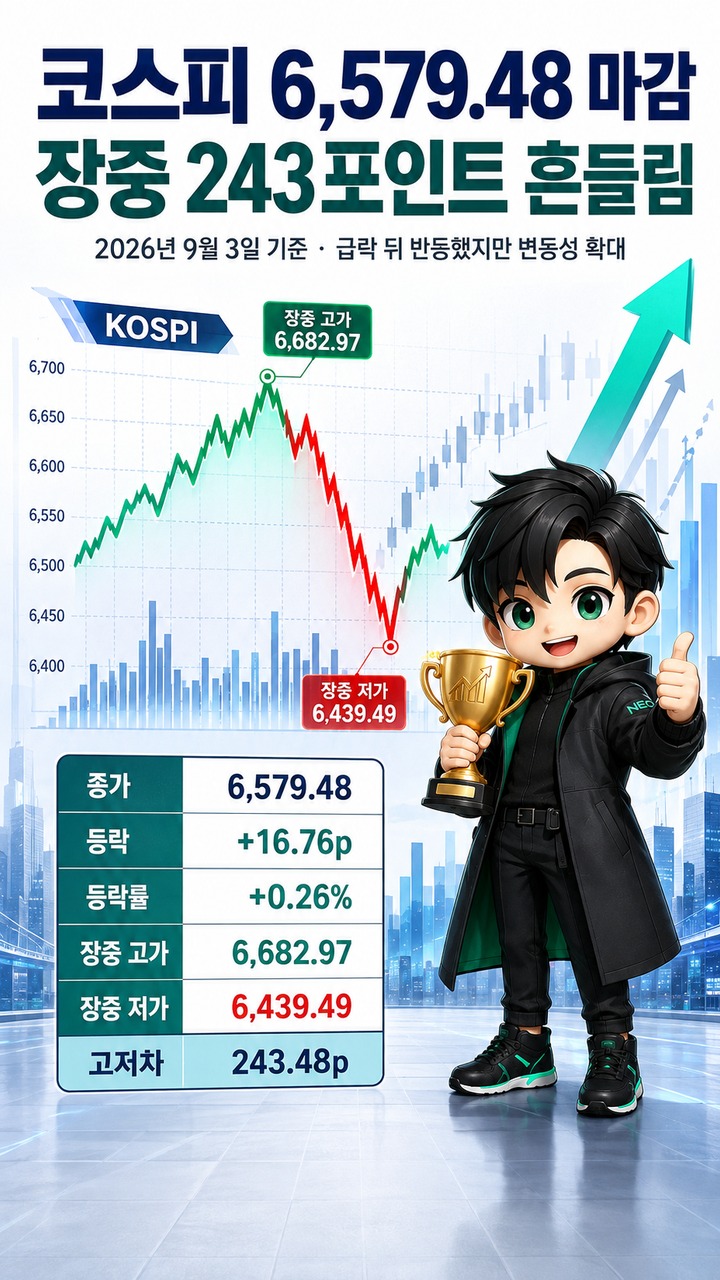
2026-09-03 saw the KOSPI close at 6,579.48, up 16.76 points, or 0.26%, from the previous trading session. Although it rebounded after the previous day's 3.99% plunge, the index experienced significant volatility, climbing to 6,682.97 intraday before falling to 6,439.49. No single new negative development was confirmed to explain the afternoon sell-off, so the day's market performance should be assessed using both intraday volatility and investor trading flows rather than the closing gain alone.
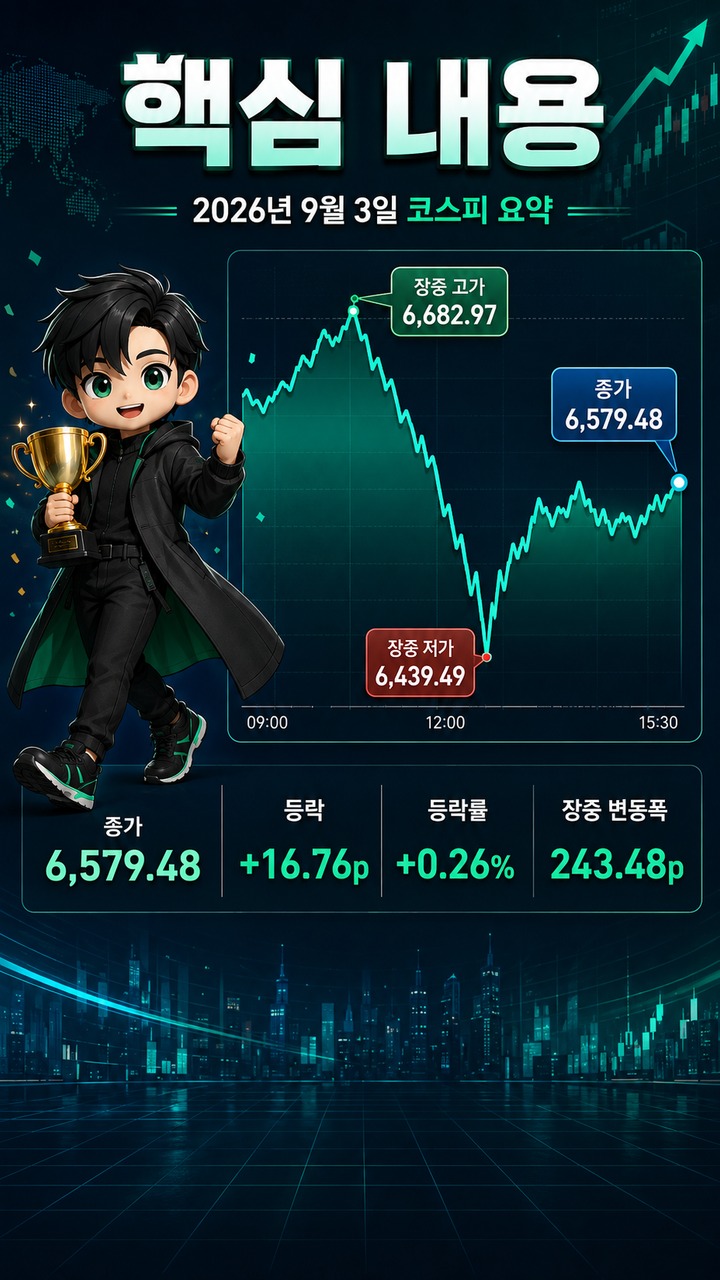
The information was verified as of 2026-09-03 at 5:4 p.m. Korea Standard Time. The figures below reflect the close of that day's regular trading session and exclude subsequent after-hours trading and prices from the following trading day.
Why Did the KOSPI's Gain Feel Different From a Strong Rebound?
The KOSPI closed at 6,579.48, higher than the previous day, but its performance throughout the session was far from a straightforward rebound. After opening at 6,650.33, it climbed to an intraday high of 6,682.97 before dropping to 6,439.49 in the afternoon. It subsequently recovered above the 6,500 level before trading ended.
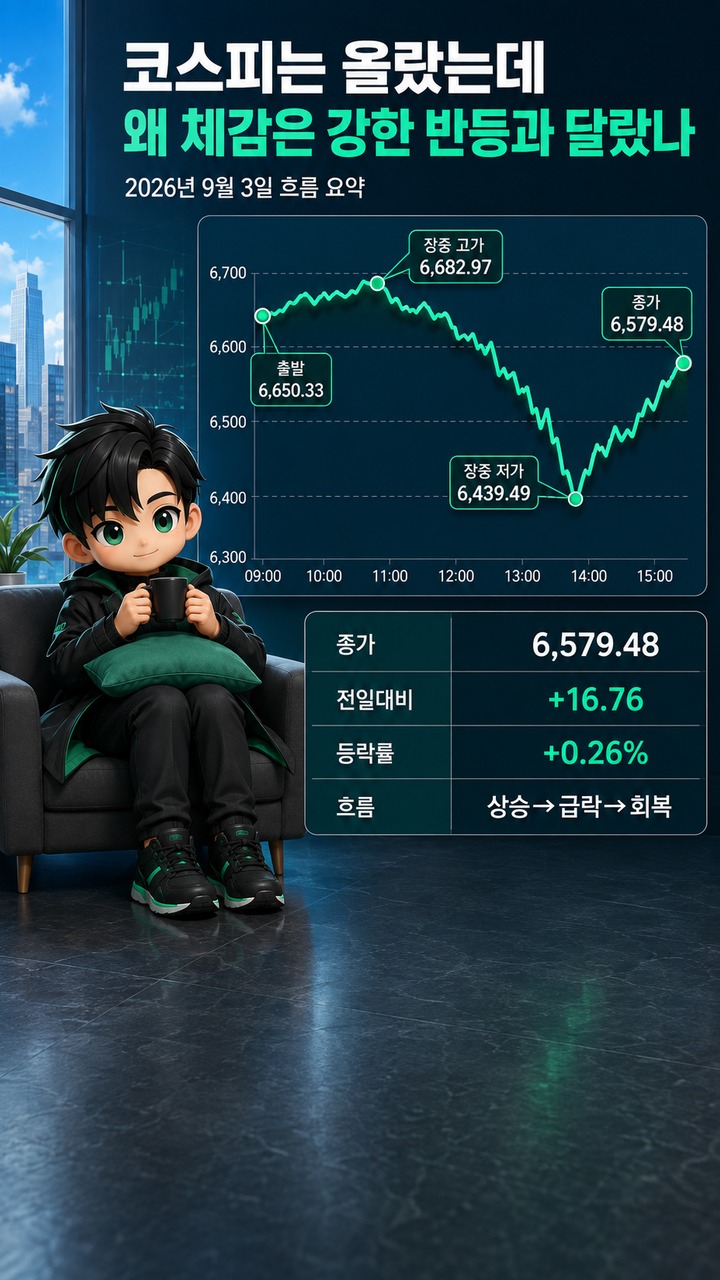
The previous day's KOSPI closing level was 6,562.72. On September 3, the index opened at 6,650.33, which was 87.61 points above the previous close. At its intraday peak, it was up 120.25 points from the previous session.
However, the difference between the intraday high of 6,682.97 and the low of 6,439.49 was 243.48 points. According to the author's calculation, the range from the intraday low to the high was approximately 3.78%.
The calculation is as follows.
243.48 ÷ 6,439.49 × 100 ≈ 3.78%
Consequently, although the closing percentage change was only +0.26%, actual intraday price movements were much larger. This is why the positive closing performance and the substantial intraday volatility need to be considered separately when assessing the market that day.
Sharp Decline Around 2 p.m.: No Clear New Negative Catalyst Was Confirmed
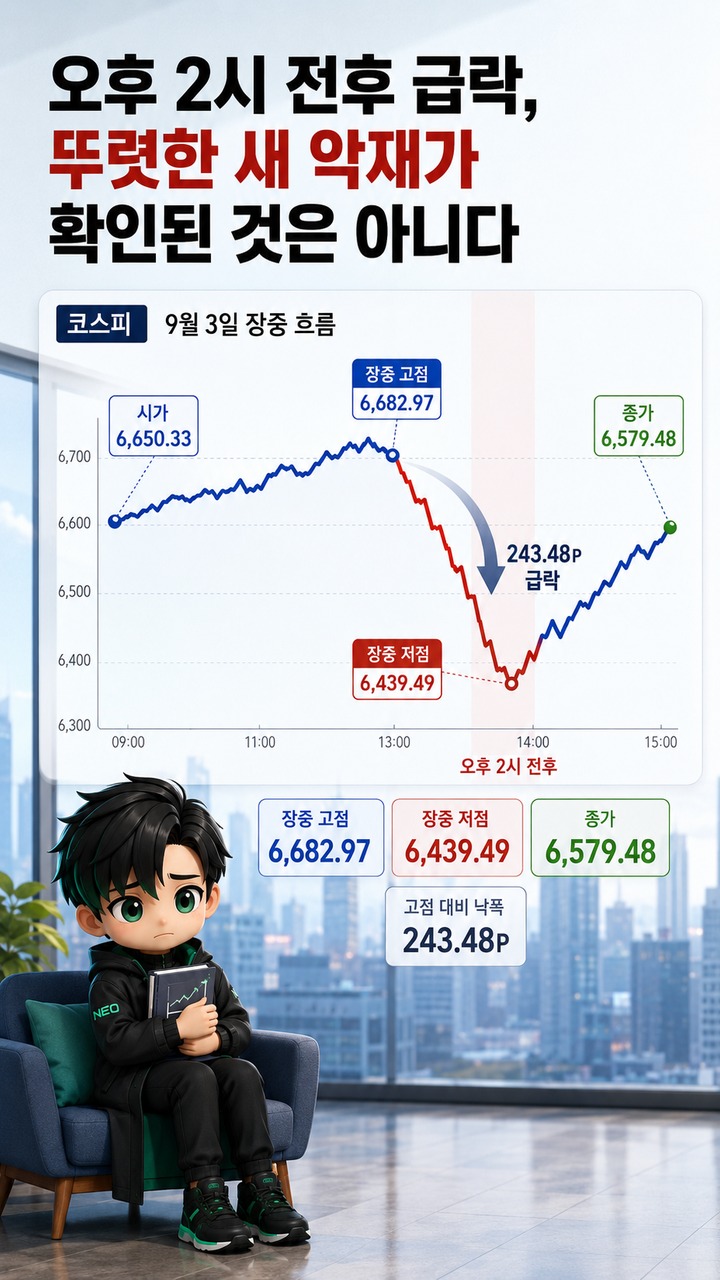
The most striking development of the session was the sudden decline around 2 p.m. The KOSPI fell rapidly from its intraday high to 6,439.49 before rebounding.
Published market-closing reports confirmed increased selling by institutional investors, including financial investment firms and pension funds, during that period. Japanese equities and certain semiconductor stocks also weakened around the same time.
However, as of the market close on September 3, no single new negative catalyst had been clearly identified as the cause of the afternoon decline. Attributing the sell-off definitively to one particular event would therefore go beyond what the available evidence supports.
The fact that stock prices moved sharply within a short period and the claim that the cause of those movements has been established are entirely different matters. Particularly on highly volatile days, it is important to distinguish between explanations offered afterward and information that actually became available to the market at the time.
How Did the KOSPI Rise When Retail, Foreign, and Institutional Investors Were All Net Sellers?
On September 3, retail, foreign, and institutional investors all recorded net selling in the KOSPI market. Retail investors sold a net KRW 1,131,600,000,000, foreign investors sold a net KRW 208,900,000,000, and institutional investors sold a net KRW 271,600,000,000. Other corporations, meanwhile, recorded net purchases of KRW 1,626,600,000,000.
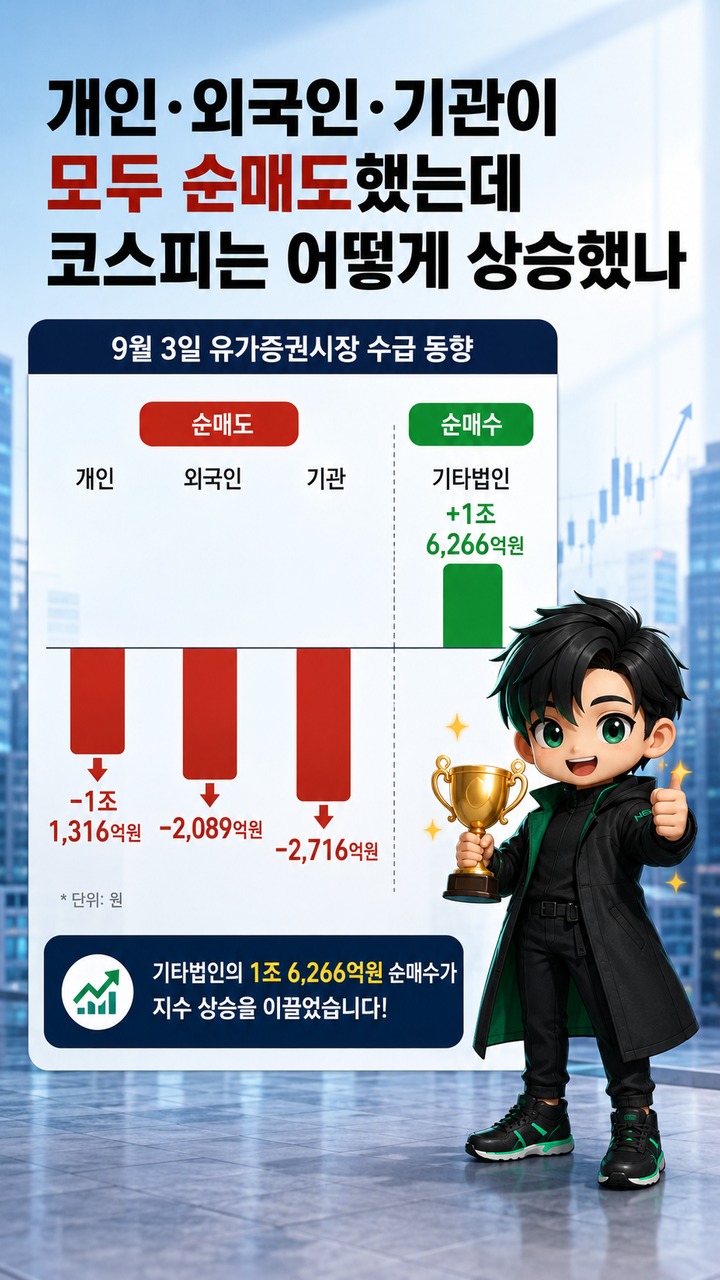
The combined net selling by the three investor groups amounted to KRW 1,612,100,000,000.
According to the author's calculation, net purchases of KRW 1,626,600,000,000 by other corporations exceeded the combined net selling by retail, foreign, and institutional investors by KRW 14,500,000,000.
KRW 1,626,600,000,000 - KRW 1,612,100,000,000 = KRW 14,500,000,000
Because marketwide net buying and selling figures are interconnected through the structure of transactions between counterparties, purchases by a single investor group cannot fully explain movements in the index. Nevertheless, a notable feature of trading on September 3 was that retail, foreign, and institutional investors were all net sellers while purchases by other corporations were substantial.
In the recent market environment, treasury share transactions involving Samsung Electronics and SK Hynix are also factors worth examining when analyzing trading flows attributed to other corporations.
At its August 21 board meeting, Samsung Electronics decided to repurchase approximately KRW 15,000,000,000,000 worth of treasury shares for employee compensation. Its 2026 shareholder return plan, announced on the same day, was presented at approximately 90 trillion to KRW 110,000,000,000,000. For the 3 quarter, the company plans cash dividends of approximately KRW 30,000,000,000,000, including regular dividends. Specific details of the 3-quarter dividend are scheduled to be decided at a board meeting in late October.
SK Hynix also decided at its August 19 board meeting to repurchase KRW 40,000,000,000,000 worth of its own shares over approximately 3 months and subsequently cancel all of them. Based on the company's figures at the time, applying the closing price from the day before the board meeting would correspond to approximately 2,407 ten-thousand shares, or around 3.3% of its total issued shares.
However, the existence of a share repurchase program does not establish the future direction of an individual stock's price. In fact, on September 3, Samsung Electronics fell 0.20% and SK Hynix declined 1.05%.
The KOSPI and KOSDAQ Moved in Opposite Directions on the Same Day
While the KOSPI rose 0.26%, the KOSDAQ closed at 790.21, down 13.77 points, or 1.71%, from the previous trading session. The KOSDAQ declined for 4 consecutive trading sessions.
Looking only at the KOSPI, the market rebounded one day after the previous session's sharp decline. However, considering the KOSDAQ as well, it would be difficult to describe the day as a broad recovery across the entire South Korean stock market.
In the KOSDAQ market, retail investors recorded net purchases of KRW 295,100,000,000, while foreign investors sold a net KRW 107,600,000,000 and institutional investors sold a net KRW 184,600,000,000. Combined net selling by foreign and institutional investors was calculated at KRW 292,200,000,000.
Given the divergence between the KOSPI, which has a relatively high concentration of large-cap stocks, and the KOSDAQ, which has a comparatively greater concentration of growth stocks and small- and mid-cap companies, relying on a single market index to judge the performance of individual holdings can produce a misleading impression.
Differences among individual stocks were also substantial. Among the KOSPI's largest companies by market capitalization, Samsung Electronics and SK Hynix declined 0.20% and 1.05%, respectively, while LG Energy Solution rose 5.18%, KB Financial Group gained 5.20%, and Hyundai Motor advanced 1.46%.
In other words, even within the KOSPI, the trading day looked entirely different depending on the industry and individual stock.
How Much of the Previous Day's 3.99% Plunge Was Recovered?
On September 2, the KOSPI closed at 6,562.72, down 273.08 points, or 3.99%. On the following day, September 3, it rose 16.76 points, or 0.26%, to 6,579.48.
Measured simply in index points, the market recovered 16.76 points of the 273.08 points lost the previous day.
According to the author's calculation, the recovery represented approximately 6.14% of the previous day's point decline.
16.76 ÷ 273.08 × 100 ≈ 6.14%
Therefore, the gain on September 3 was closer to a modest rebound immediately after a sharp sell-off than a strong recovery that reversed the previous day's losses. Although the closing index was higher than the day before, most of the previous decline remained unrecovered.
This distinction is difficult to recognize from a statement such as 'The KOSPI rose today' alone. Comparing the move with the previous day's performance is necessary to assess the actual significance of a single day's gain.
Which Figures Should Investors Watch Next When Checking Stock Prices?
It is difficult to determine the short-term market direction from September 3 alone. What was confirmed that day was that the KOSPI rebounded 0.26% after the previous session's sharp decline, traded across a wide intraday range of 243.48 points, and continued to face net selling pressure from major investor groups, including foreign and institutional investors.
During the next trading session, the first point to examine is how the KOSPI behaves relative to its September 3 closing level of 6,579.48. The intraday low of 6,439.49 and high of 6,682.97 can also serve as reference points for comparing prices with the previous session's actual trading range.
In terms of investor flows, it would be useful to watch whether foreign and institutional investors change their trading direction and whether the substantial net buying by other corporations continues. Stocks with significant market weight, such as Samsung Electronics and SK Hynix, may move independently of the broader index, so their individual price movements should also be examined separately.
With the KOSDAQ having fallen to 790.21, another factor to monitor is whether the KOSPI and KOSDAQ begin moving in the same direction again. Rather than judging the entire South Korean stock market by a rebound in just one index, comparing movements and investor flows across both markets can provide a more accurate understanding of situations like this one, when index performance differs from the experience of individual stockholders.
Judged solely by its closing level, the 2026-09-03 session represented a modest KOSPI gain of +0.26%. However, the intraday high and low were separated by 243.48 points, the KOSDAQ declined 1.71%, and Samsung Electronics and SK Hynix also weakened. During the next trading session, the priority should be to observe changes in this price range and investor trading flows rather than prematurely predicting whether the market will rise or fall.
Stock prices can change rapidly in response to interest rates, exchange rates, corporate earnings, investor trading flows, and unexpected news. The figures above are based on publicly available information as of the close of the regular trading session on 2026-09-03. They do not constitute recommendations to buy or sell specific stocks or guarantees of future returns.
※ This article is provided for reference purposes to help readers understand market trends and does not constitute investment advice regarding any particular stock or asset. Final investment decisions and responsibility rest with each individual investor.