

Why Does a Dot Plot of 4.1% Translate Into a Benchmark Interest Rate of 4.00\~4.25%?
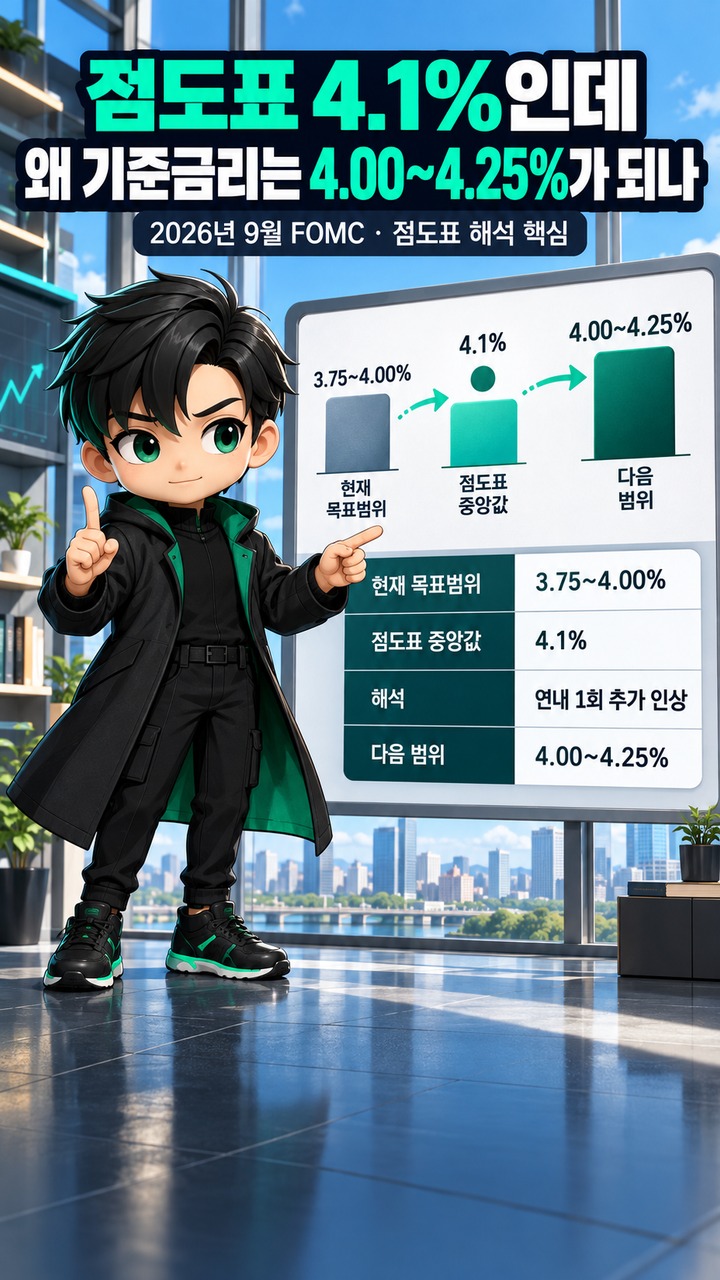
What does 4.1% in the September FOMC dot plot mean? Why is it interpreted as signaling 'one more rate hike this year'? # What does 4.1% in the September FOMC dot plot mean? Why is it interpreted as signaling 'one more rate hike this year'?

The key takeaway from the September 2026 FOMC dot plot is that the median projection places the year-end benchmark interest rate at around 4.1%. With the current federal funds rate target range at 3.75\~4.00%, a straightforward calculation using 0.25%-percentage-point increments suggests one additional rate hike before the end of the year. However, the dot plot is not a fixed schedule of rate decisions. It represents individual policymakers' projections, which can change as economic conditions evolve.
Why Does a Dot Plot of 4.1% Translate Into a Benchmark Interest Rate of 4.00\~4.25%?
It is easy to get confused when comparing the number shown in the dot plot directly with the actual benchmark interest rate target range.

The U.S. Federal Reserve (Fed) sets its benchmark interest rate as a target range, rather than a single number. The range established at the September FOMC meeting was 3.75\~4.00%. By contrast, the dot plot shows the federal funds rate level that each policymaker considers appropriate.
The midpoint of the current target range is 3.875%.
If the rate is raised once more by 0.25% percentage points, the target range becomes 4.00\~4.25%, with a midpoint of 4.125%. The dot plot's median value of 4.1% can be understood as the rounded representation of 4.125%.
Author's calculation
Current: (3.75% + 4.00%) ÷ 2 = 3.875%
After one additional rate hike: (4.00% + 4.25%) ÷ 2 = 4.125% ≈ 4.1%
In fact, among the 18 participants who submitted interest rate projections in the September outlook, 16 expected at least one additional rate hike by the end of 2026, while 2 projected that rates would remain at their current level.
Whose Forecast Does Each Dot in the Dot Plot Represent?
A single dot does not represent an interest rate collectively agreed upon at an FOMC meeting. It represents the rate level proposed by an individual Federal Reserve policy participant based on their economic outlook and the monetary policy path they consider appropriate.

That is why the most important information in the dot plot is not any individual dot, but where the dots are concentrated and how the median has shifted compared with previous projections.
According to the September data, the projections for 2026 showed 12 participants in the 4.13\~4.37% range, 4 in the 4.38\~4.62% range, and 2 in the 3.88\~4.12% range. This distribution indicates that expectations within the Fed had shifted toward further monetary tightening.
An even more important change concerns 2027. In the Fed's June projections, the median outlook reflected a path in which interest rates would rise in 2026 and then decline again in 2027. In the September projections, however, that outlook changed to a path in which interest rates would remain elevated even in 2027.
A Dot Plot Reading of 4.1% Does Not Mean the Fed Will Raise Rates at the Next FOMC Meeting
It does not.
The year-end projection of 4.1% in the dot plot is an estimate of the interest rate level considered appropriate at the end of 2026, not a decision to raise rates by 0.25% percentage points at the next meeting.
In the September 17 market, the probability of an additional 0.25%-percentage-point increase at the next meeting was priced at 53.1%. In other words, the market at that time did not treat a rate hike at the next meeting as a certainty either.
It is also not unusual for the dot plot and market expectations to differ. A 2026 study by the Federal Reserve Bank of New York found that financial markets incorporate information from the dot plot but do not treat it as a binding commitment. Instead, market participants gradually adjust their expectations as new information emerges.
Therefore, if future inflation and employment data differ from expectations, the actual interest rate path could change as well.
What Actually Changed Between the June and September Dot Plots?
The most noteworthy aspect of the latest dot plot is not simply the signal that rates may rise one more time. More importantly, the period during which interest rates are expected to remain elevated has become longer.
A comparison of Federal Reserve data and the September projections shows that interest rate forecasts moved higher not only for the end of 2026 but also for 2027. At the same time, the median projection for PCE inflation in 2026 rose to 3.7%, up from 3.6% in June. The forecast for real GDP growth in 2026 increased from 2.2% to 2.3%, while the unemployment rate projection declined from 4.3% to 4.1%.
In other words, the economic conditions facing the Fed are not straightforward.
The economy and labor market are holding up better than expected, but inflation is also not declining quickly enough. This combination reduces the urgency of cutting interest rates to prevent an economic slowdown while increasing the scope for keeping rates elevated to bring inflation under control.
The Fed projected PCE inflation at 3.7% in 2026, 2.3% in 2027, and 2.1% in 2028. It indicated that inflation would return to the 2% level in 2029.
What Should Technology Stock Investors Watch Alongside the Benchmark Interest Rate?
It is difficult to determine the direction of technology stocks from the dot plot alone. Actual stock prices simultaneously reflect factors such as long-term Treasury yields, oil prices and inflation expectations, corporate earnings, and expectations surrounding AI investment.
On September 17, technology stocks rebounded as oil prices and U.S. Treasury yields declined, even though the Fed continued to signal the possibility of further tightening. That day, the Nasdaq Composite Index recorded 1.69%, while the S&P500 rose 1.14%, with technology stocks leading gains among major sectors.
By contrast, on September 18, market attention shifted back to the future interest rate path and the 10-year Treasury yield. At the time, market participants cited a U.S. 10-year Treasury yield of 5% and international oil prices near 100 dollars per barrel as key levels for assessing pressure on the stock market.
For this reason, it is easier to understand developments after an FOMC meeting by examining three figures separately.
The Fed's policy rate shows the current stance of monetary policy, the dot plot shows the future policy path envisioned by Fed participants, and U.S. Treasury yields show how markets price those expectations and new economic data in real time.
These three figures sometimes move in the same direction, but they do not always align.
What Should Investors Monitor Before the Next FOMC Meeting?
Rather than remembering only the 4.1% figure from the September dot plot, it is important to monitor the economic indicators that could change that projection.
In particular, investors should watch whether inflation remains higher than expected, how strong the labor market continues to be, whether rising international oil prices spread into broader inflation, and which direction U.S. Treasury yields take.
Immediately after the September FOMC meeting, uncertainty remained in the market over the timing of the next interest rate hike. Investors were looking for additional clues in subsequent comments from Fed officials and indicators related to inflation and economic activity.
In conclusion, a dot plot reading of 4.1% does not mean 'the Fed has definitively decided to raise rates one more time this year.' Rather, it means that the median projection among policy participants considers a rate level equivalent to one additional hike from the current 3.75\~4.00% range appropriate by the end of 2026.
For the stock market, investors should look beyond a single dot plot figure and examine how those expectations are reflected in actual Treasury yields, corporate borrowing costs, and growth stock valuations.
※ This article is provided for informational purposes to help readers understand market developments and does not constitute an investment recommendation regarding any particular stock or asset. Readers are responsible for their own final decisions and investment outcomes.