

How to Read the Ichimoku Cloud: 5 Things to Check Before Focusing on the Cloud
이 포스팅은 쿠팡 파트너스 활동의 일환으로, 이에 따른 일정액의 수수료를 제공받습니다.

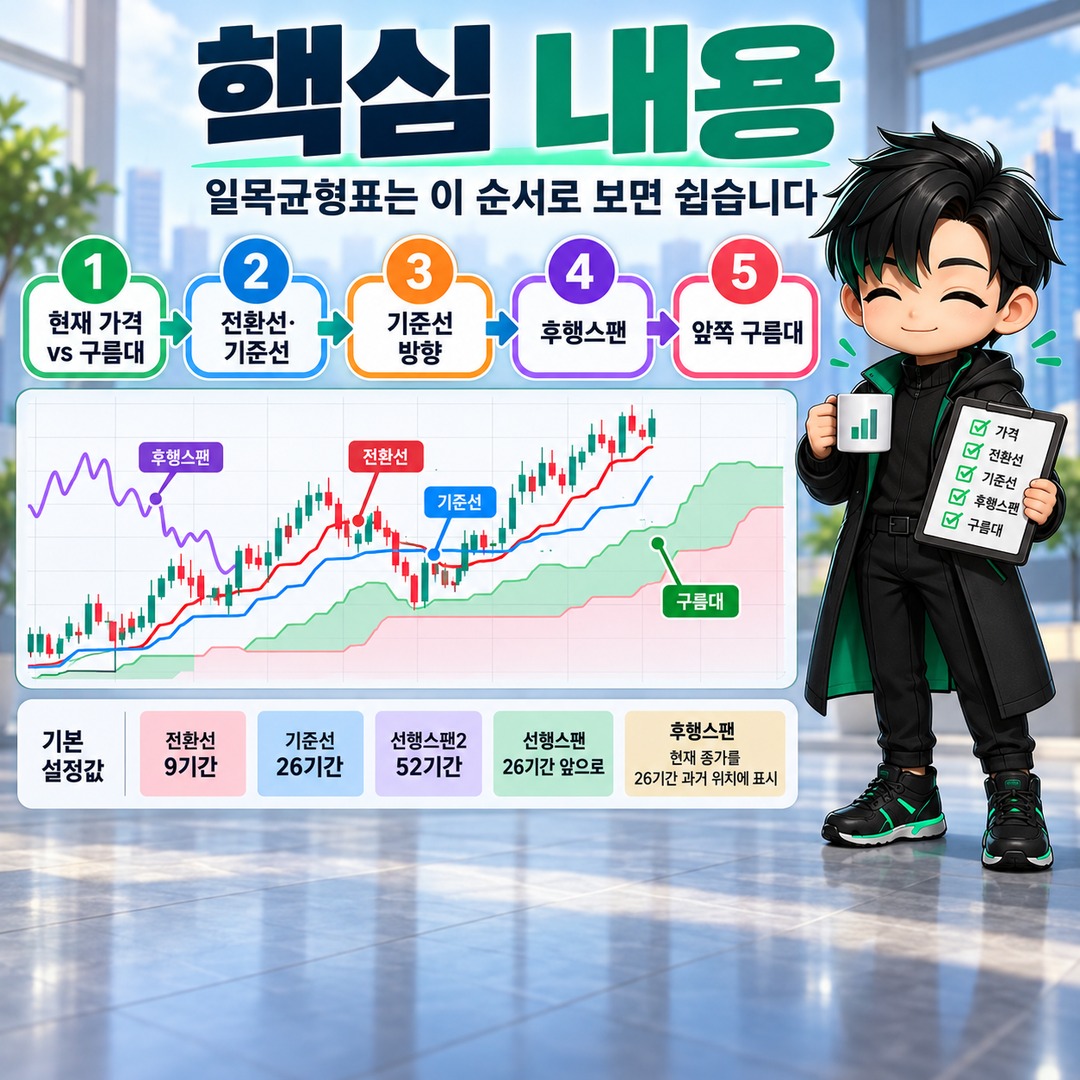
The Ichimoku Cloud is much easier to understand when you examine it in this order: whether the current price is above or below the cloud → the positions of the Conversion Line and Base Line → the direction of the Base Line → the Lagging Span → the leading cloud. The default settings are 9 periods for the Conversion Line, 26 periods for the Base Line, and 52 periods for Leading Span 2. The Leading Spans are plotted 26 periods ahead, while the Lagging Span plots the current closing price 26 periods in the past.
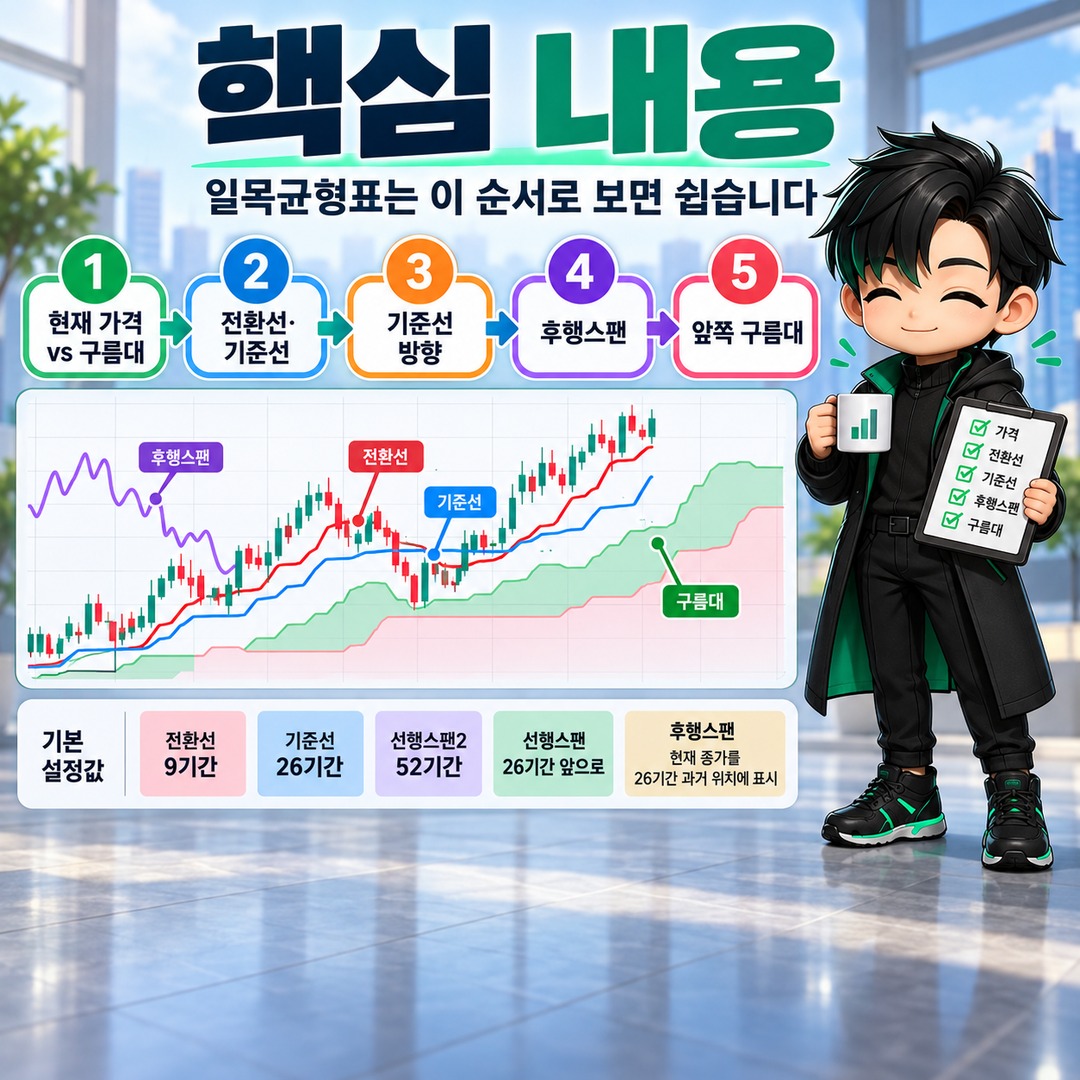
When you first open a chart, it is important not to try to interpret every line simultaneously. Instead, understand what each line calculates and then check whether they point in the same direction.
What Do the 5 Lines of the Ichimoku Cloud Represent?
The Ichimoku Cloud consists of the Conversion Line, Base Line, Lagging Span, Leading Span 1, and Leading Span 2. The shaded area between Leading Span 1 and Leading Span 2 is commonly called the cloud.

The Conversion Line is the midpoint between the highest high and lowest low over the most recent 9 periods.
Conversion Line = (Highest High Over the Last 9 Periods + Lowest Low Over the Last 9 Periods) ÷ 2

The Base Line is the midpoint between the highest high and lowest low over the most recent 26 periods.
Base Line = (Highest High Over the Last 26 Periods + Lowest Low Over the Last 26 Periods) ÷ 2
Leading Span 1 calculates the midpoint between the Conversion Line and Base Line and plots it 26 periods ahead.
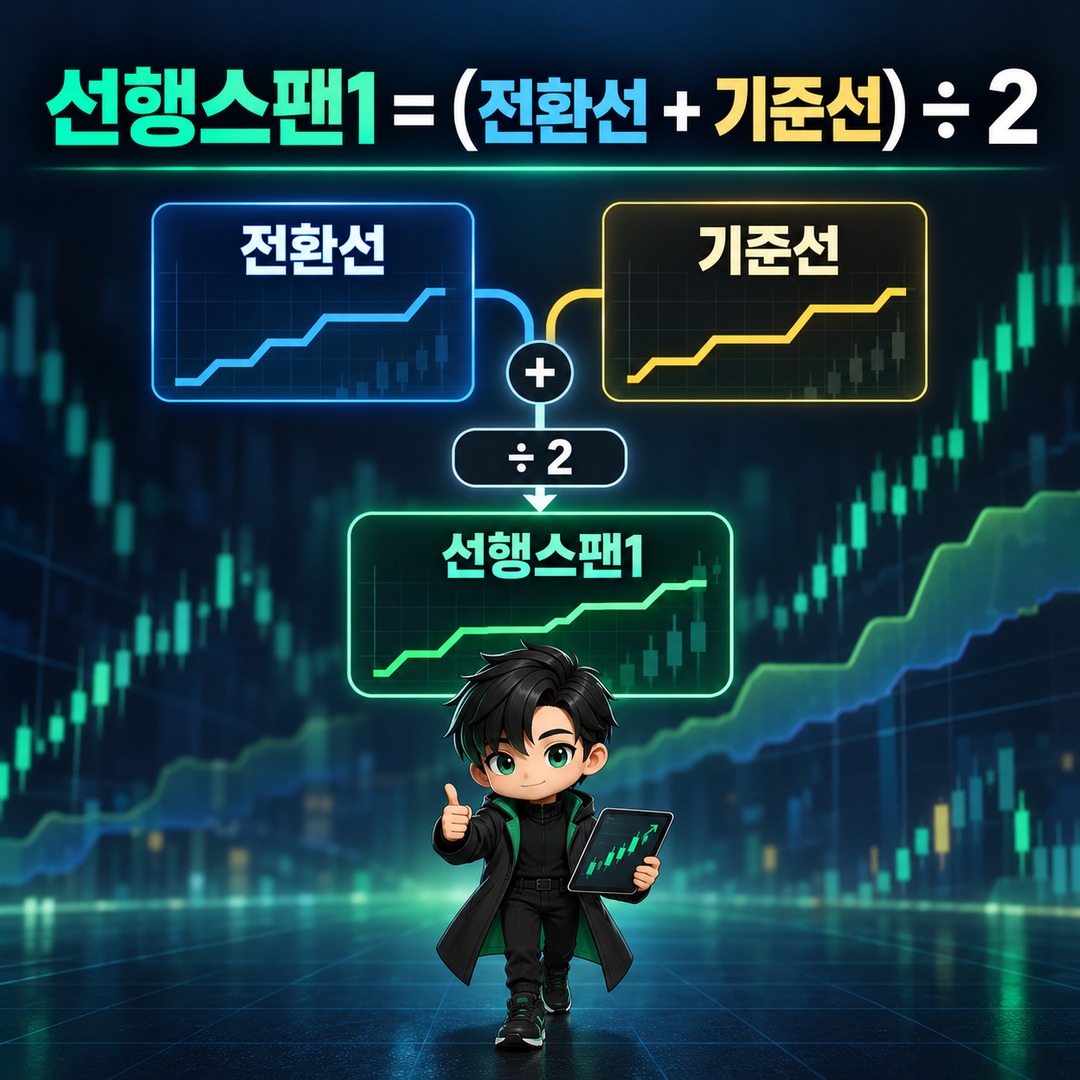
Leading Span 1 = (Conversion Line + Base Line) ÷ 2
Leading Span 2 calculates the midpoint between the highest high and lowest low over the most recent 52 periods and plots it 26 periods ahead.
Leading Span 2 = (Highest High Over the Last 52 Periods + Lowest Low Over the Last 52 Periods) ÷ 2
The Lagging Span plots the current closing price 26 periods in the past.
A common misunderstanding arises here. The Conversion Line and Base Line are not simple moving averages calculated from closing prices over 9 days and 26 days, respectively. They use the midpoint between the highest and lowest prices within their respective periods.
On a daily chart, one period corresponds to one trading day. However, the same numbers have different meanings on weekly or intraday charts. Therefore, 9, 26, and 52 should not always be interpreted as 9, 26, and 52 calendar days.
1. First, Check the Position of the Current Price Relative to the Cloud
The simplest starting point is to check whether the candlesticks are above, inside, or below the cloud.
In conventional interpretation, a price above the cloud suggests an upward trend, while a price below the cloud suggests a downward trend. If the price is inside the cloud, it is more appropriate to regard the market as being in a phase where the direction is difficult to classify clearly.
Because the cloud is the area between Leading Span 1 and Leading Span 2, it represents a price zone rather than a single precise price line.
Therefore, instead of making a buying or selling decision solely because the price has moved slightly beyond the cloud, you should also check whether the other components indicate the same direction.
2. Look Beyond Crossovers Between the Conversion Line and Base Line
When the Conversion Line is above the Base Line, the midpoint of the short-term price range is higher than that of the medium-term price range. Conversely, when the Conversion Line is below the Base Line, the short-term midpoint is lower than the medium-term midpoint.
In technical analysis, an upward crossover of the Conversion Line above the Base Line is widely interpreted as a positive signal, while a downward crossover is interpreted as a negative signal.
However, examining the crossover alone does not provide enough information.
For example, even if the Conversion Line crosses above the Base Line, the price and both lines may still be below the cloud. Conversely, if the Conversion Line, Base Line, and price are all moving above the cloud when the Conversion Line crosses above the Base Line, several components are pointing in the same direction.
In other words, it is important to consider where the crossover occurs, rather than focusing only on the crossover itself.
3. Also Check the Direction of the Base Line
Because the Base Line is the midpoint between the highest high and lowest low over the most recent 26 periods, it can remain horizontal if the price range over those 26 periods does not change.
For example, if the highest high over the most recent 26 periods is KRW 70,000 and the lowest low is KRW 60,000, the Base Line is calculated as follows.
(KRW 70,000 + KRW 60,000) ÷ 2 = KRW 65,000
If the highest high and lowest low over the 26-period range remain unchanged on the next trading day, the calculated Base Line may stay at KRW 65,000 even if the closing price moves.
Therefore, a horizontal Base Line should not simply be interpreted as meaning that the price has not moved. You need to examine whether the highest-high and lowest-low range used to calculate the Base Line has changed.
4. Do Not Compare the Lagging Span Directly With the Current Price
The Lagging Span is the current closing price shifted backward by 26 periods.
Therefore, rather than comparing the Lagging Span shown on the left side of the chart directly with the current candlestick, you should compare it with the historical price action at the point where the Lagging Span is plotted.
By checking whether the Lagging Span is above or below the historical price at that position, you can visually determine where the current price stands relative to the price 26 periods earlier.
Beginners often overlook the Lagging Span when studying the Ichimoku Cloud. However, checking whether the Lagging Span also confirms the same direction provides more information than relying on a single crossover signal.
5. The Cloud Plotted to the Right Is Not a Guaranteed Future Price
This is one of the easiest aspects of the Ichimoku Cloud to misunderstand.
Because Leading Span 1 and Leading Span 2 are displayed to the right of the current candlestick, they may appear to calculate future prices in advance. However, the leading cloud is created using price data available up to the present, with the calculated values shifted forward by 26 periods.
Leading Span 1 is the midpoint between the current Conversion Line and Base Line, while Leading Span 2 is the midpoint between the highest high and lowest low over the most recent 52 periods.
Therefore, the cloud on the right does not mean that the price 26 periods later has been predicted with certainty.
When examining the leading cloud, it is easier to understand its purpose as a way to observe the relative positions of Leading Span 1 and Leading Span 2, along with the cloud area projected ahead.
Follow This Order When Reading a Real Chart
If the Ichimoku Cloud looks complicated, you can understand its basic structure by repeatedly following this sequence.
1. Price and Cloud
Check whether the current price is above, inside, or below the cloud.
2. Conversion Line and Base Line
Check whether the Conversion Line is above or below the Base Line.
3. Direction of the Base Line
Determine whether the Base Line is rising, horizontal, or falling.
4. Position of the Lagging Span
Compare the Lagging Span with the historical price at the point where it is plotted.
5. Leading Cloud
Examine the cloud area projected ahead by Leading Span 1 and Leading Span 2.
For example, if the price is above the cloud, the Conversion Line is above the Base Line, and both lines are also above the cloud, several components are indicating the same direction.
Conversely, if the price is above the cloud but the Conversion Line falls below the Base Line, or the price moves into the cloud, the signals conflict. In such situations, rather than drawing a firm conclusion about the direction based on a single condition, you need to observe additional price movements.
Check How Your Brokerage Platform Displays Cloud Colors
It is best to avoid judging upward or downward trends simply by memorizing the cloud's colors.
The Ichimoku Cloud is the shaded area between Leading Span 1 and Leading Span 2, but some charting services allow users to customize its colors. Therefore, rather than assigning meaning solely because the cloud is red or blue, it is more accurate to check which line is higher: Leading Span 1 or Leading Span 2.
For the same reason, the colors of the Conversion Line and Base Line may differ between charts, so it is a good habit to check the line names first.
The Biggest Difference From Moving Averages
It is easy to think of the Ichimoku Conversion Line and Base Line as moving averages, but their calculation methods are fundamentally different.
A simple moving average adds the closing prices over a specified period and divides the total by the number of periods. In contrast, the Ichimoku Conversion Line and Base Line calculate the midpoint between the single highest high and single lowest low within the specified period.
As a result, even if the price continues to move, the Conversion Line or Base Line may remain horizontal if the highest high and lowest low within the relevant period do not change.
Understanding this difference also makes it easier to see why horizontal lines frequently appear in the Ichimoku Cloud.
Should You Make Buying and Selling Decisions Based on the Ichimoku Cloud Alone?
The Ichimoku Cloud is a technical analysis tool that allows you to examine trends, price positioning, and support and resistance zones on a single chart. However, no particular signal guarantees that prices will subsequently rise or fall.
In particular, when markets move sideways or frequently change direction, crossovers between the Conversion Line and Base Line may occur repeatedly. A price that breaks through the cloud may also move back inside it afterward.
Therefore, when making actual investment decisions, rather than treating a single Ichimoku signal as a definitive condition for buying or selling, you should also consider trading volume, price structure, other technical indicators, and your own risk management criteria.
If you are just beginning to study the Ichimoku Cloud, repeatedly analyzing the same chart in the order of price and cloud → Conversion Line and Base Line → Base Line direction → Lagging Span → leading cloud can help you understand its structure better than memorizing complicated trading formulas.
※ This article is provided for informational purposes to help readers understand market movements and does not constitute an investment recommendation for any particular security or asset. You are responsible for your final investment decisions and their outcomes.
Related Articles
How to Identify a Stock Market Bottom: 4 Signals to Check Before RSI 30
이 포스팅은 쿠팡 파트너스 활동의 일환으로, 이에 따른 일정액의 수수료를 제공받습니다.