

How to Read Uptrends and Downtrends Using Ichimoku Cloud, Trading Volume, and RSI: What to Look for When All Three Indicators Point in the Same Direction
이 포스팅은 쿠팡 파트너스 활동의 일환으로, 이에 따른 일정액의 수수료를 제공받습니다.
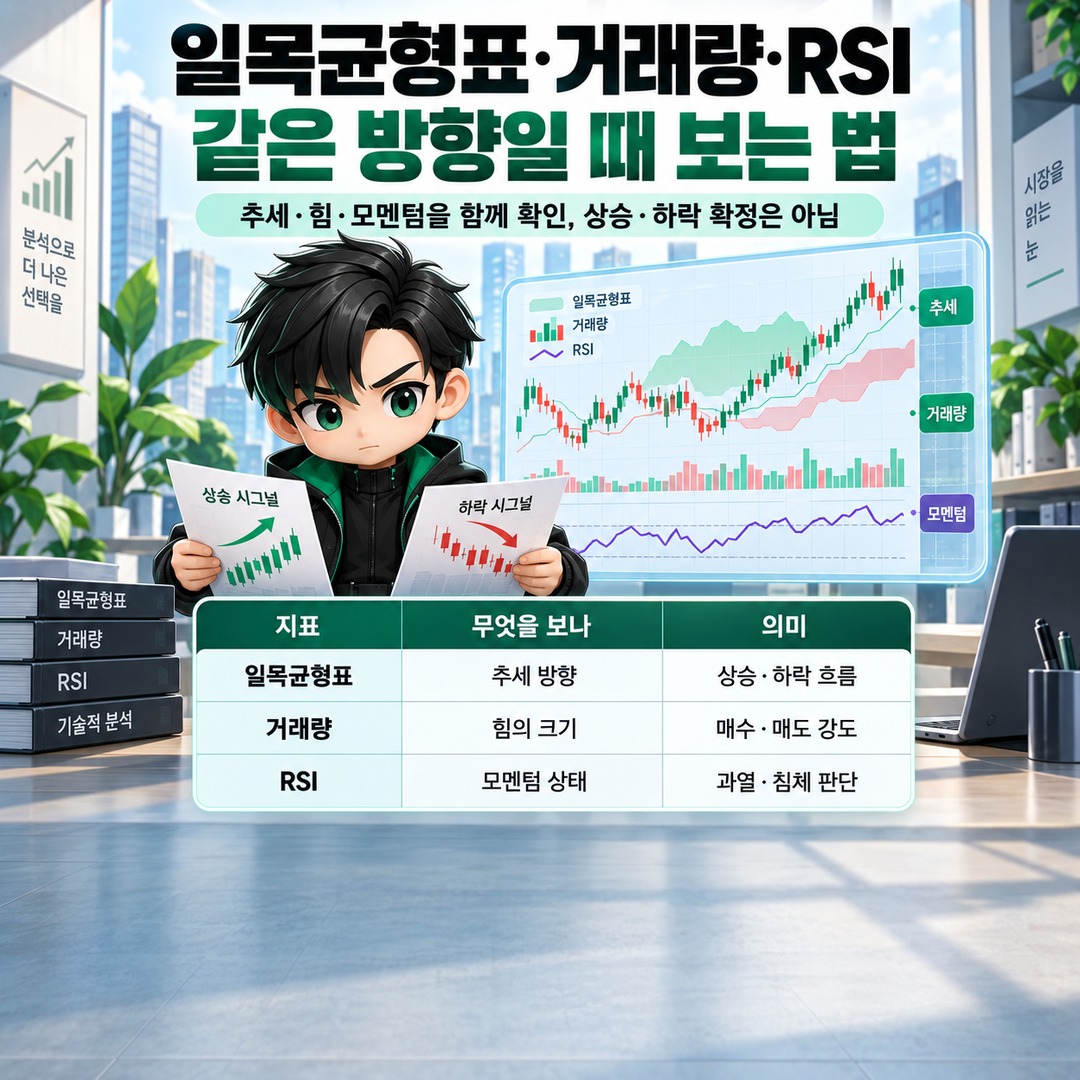
Using Ichimoku Cloud, trading volume, and RSI together allows you to assess the direction of the current trend, the strength behind price movements, and momentum conditions from different perspectives. However, even when all three indicators point upward, that does not guarantee that prices will rise next. It is more accurate to regard technical indicators as tools for interpreting price and trading data accumulated so far rather than predictors that guarantee future prices.
As of 2026-09-26, the most practical approach is to first identify the trend direction using Ichimoku Cloud → assess the strength of the move through trading volume → evaluate momentum and overbought or oversold conditions using RSI.
Ichimoku Cloud: Start by Identifying the Overall Trend Direction
Ichimoku Cloud is a technical analysis indicator designed to display support, resistance, momentum, and trends on a single chart.

Its basic components are the Conversion Line (Tenkan-sen), Base Line (Kijun-sen), Leading Span A (Senkou Span A), Leading Span B (Senkou Span B), and Lagging Span (Chikou Span). The area between Leading Spans A and B is commonly called the cloud.
The first step is to compare the price position with the cloud.
When the price is above the cloud, it is generally interpreted as indicating an upward trend. When the price is below the cloud, it is generally interpreted as indicating a downward trend. If the price is inside the cloud, it is better to view the market as an area where the direction has not been sufficiently confirmed rather than simply classifying it as bullish or bearish.
The Conversion Line and Base Line can also be examined together. When the Conversion Line moves above the Base Line and the price and both lines are positioned above the cloud, additional conditions supporting a bullish interpretation are present. Conversely, when the Conversion Line falls below the Base Line and the price and both lines are below the cloud, additional conditions supporting a bearish interpretation are present.
There is one important point to remember.
The fact that Leading Spans A and B are displayed in the future portion of the chart does not mean that future prices have already been calculated. The basic Ichimoku calculations use historical and current high, low, and closing price information.
Trading Volume: Assess How Much Strength Is Behind Price Movements
There is a reason to examine trading volume separately, even when Ichimoku Cloud indicates an upward trend. Trading volume represents how many shares were actually traded during a given period and can serve as supporting information when assessing the strength of price movements.
Rather than simply checking whether trading volume is higher than the previous day, it is useful to examine whether volume has increased significantly compared with its recent average.
For example, if the price breaks above an important resistance area while trading volume also increases noticeably above its usual level, that provides additional evidence supporting the price movement. Conversely, if the price breaks through resistance without a clear increase in trading volume, there is reason to interpret the same breakout more cautiously.
The same principle applies to declines. If the price breaks below a support area with higher-than-usual trading volume, that provides information for assessing whether the downward movement has significant strength behind it.
However, high trading volume alone should not be interpreted as a bullish signal. A surge in trading volume may accompany a strong price movement, but it can also occur when a trend is becoming exhausted. Volume may also spike for other reasons, such as market openings, closings, or major announcements.
Therefore, the role of trading volume is not to determine direction independently, but rather to examine whether the price direction indicated by Ichimoku Cloud is also supported by actual trading activity.
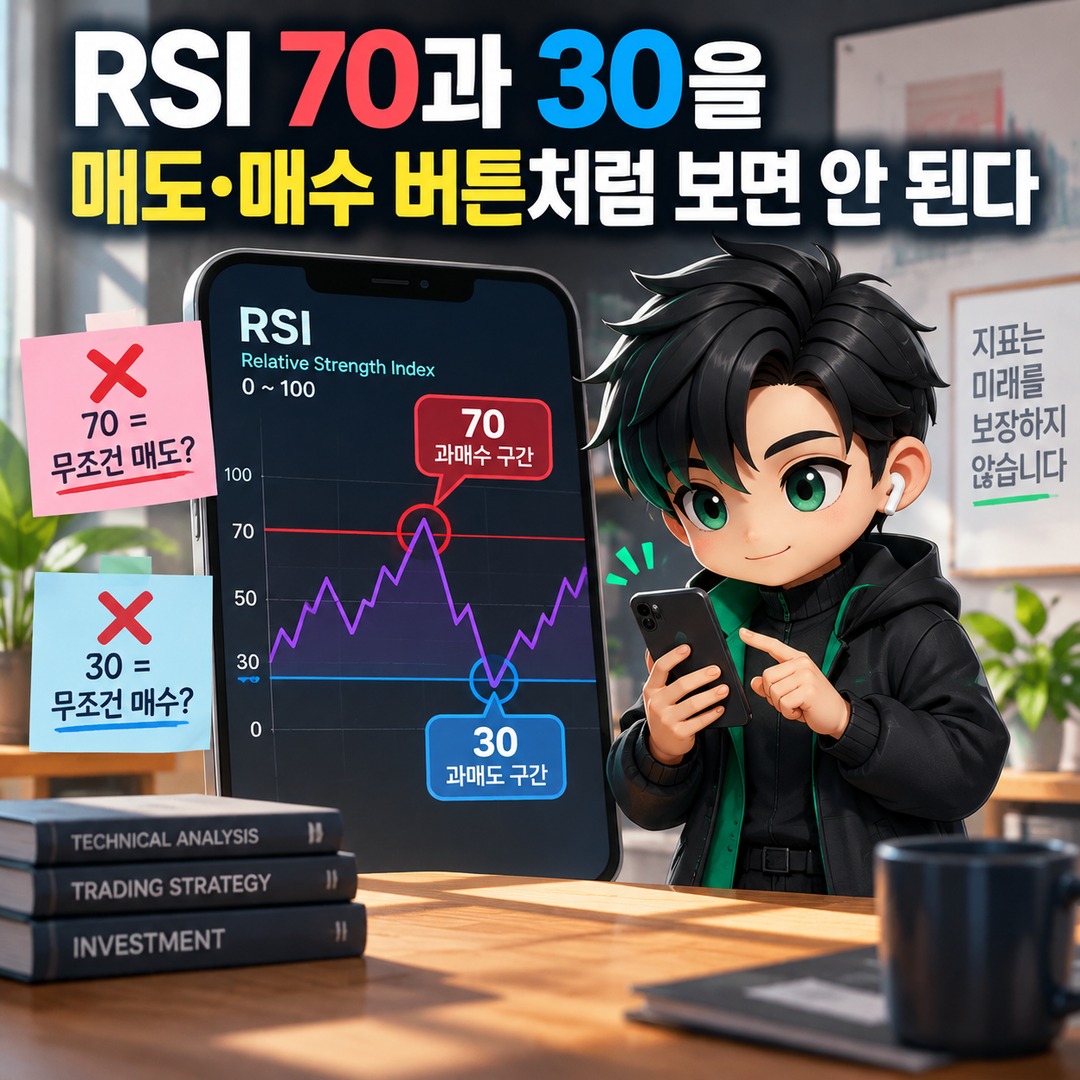
Do Not Treat RSI 70 and 30 as Automatic Sell or Buy Signals
The Relative Strength Index (RSI) is a momentum oscillator that measures the speed and change of price movements. It fluctuates between 0 and 100.

Traditionally, an RSI above 70 is interpreted as overbought, while an RSI below 30 is interpreted as oversold.
This is where a common mistake occurs.
An RSI reading above 70 does not mean that prices will immediately fall, and a reading below 30 does not mean that prices will immediately rise. During strong trends, RSI can remain in overbought or oversold territory for a considerable period.
That is why it is important to interpret RSI alongside the prevailing trend rather than relying on a single RSI value.
During an uptrend, RSI may remain in a relatively high range, while during a downtrend, it may remain in a lower range. Divergences are also used to identify potential signs of a directional change. These include situations where the price reaches a new high but RSI fails to exceed its previous high, or where the price reaches a new low while RSI forms a higher low.
The Three Indicators Become Easier to Interpret in the Order of Direction → Strength → Momentum
Displaying all three indicators simultaneously and trying to interpret every line at once can actually make analysis more difficult.
First, use Ichimoku Cloud to determine whether the price is above, inside, or below the cloud. This establishes the overall direction of the current trend.
Next, examine trading volume. Compare the volume accompanying a price breakout or breakdown with its recent typical level to see whether it has increased.
Finally, check RSI. Examine whether RSI is moving in the same direction as the price, whether it has entered overbought or oversold territory, and whether the price and RSI are moving in different directions.
By separating the roles of these three indicators, you are combining different types of information rather than checking the same information three times.
How Should Overlapping Bullish Signals Be Interpreted?
Consider the following example.
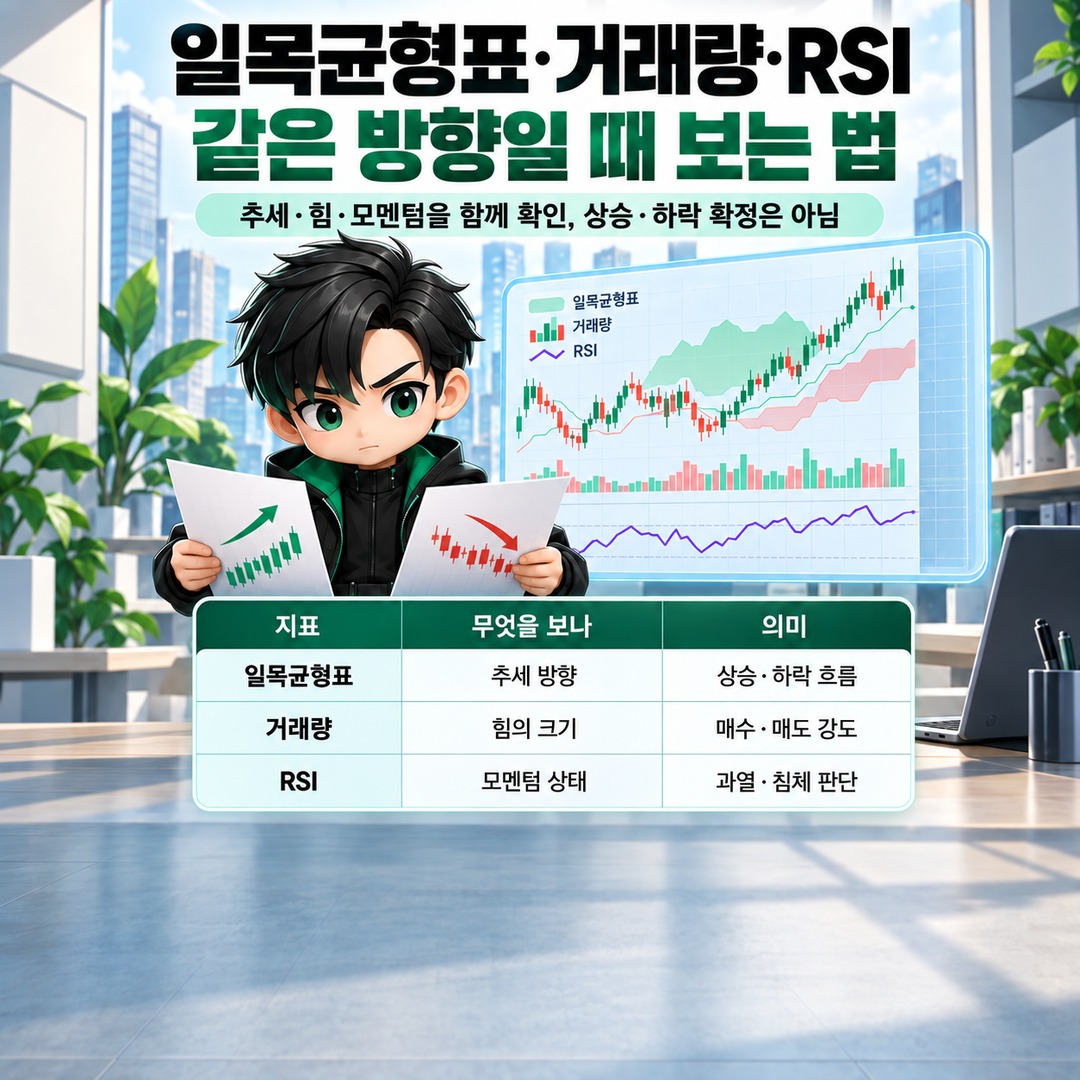
The price is above the cloud, and the Conversion Line is above the Base Line. As the price breaks through a resistance area, trading volume increases above its usual level. RSI also moves in the same direction as the rising price.
In this situation, Ichimoku Cloud confirms an upward trend, trading volume supports the strength of the price movement, and RSI indicates bullish momentum.
However, even this combination is not a definitive signal that prices will rise in the future.
In particular, a high RSI reading alone should not be taken as confirmation that the uptrend will continue. Conversely, an RSI reading above 70 should not automatically be interpreted as an immediate signal of a decline. What matters is not simply adding up the readings of the three indicators, but determining whether the different roles of each indicator produce conflicting signals.
Bearish Signals Can Be Assessed Using the Same Principles
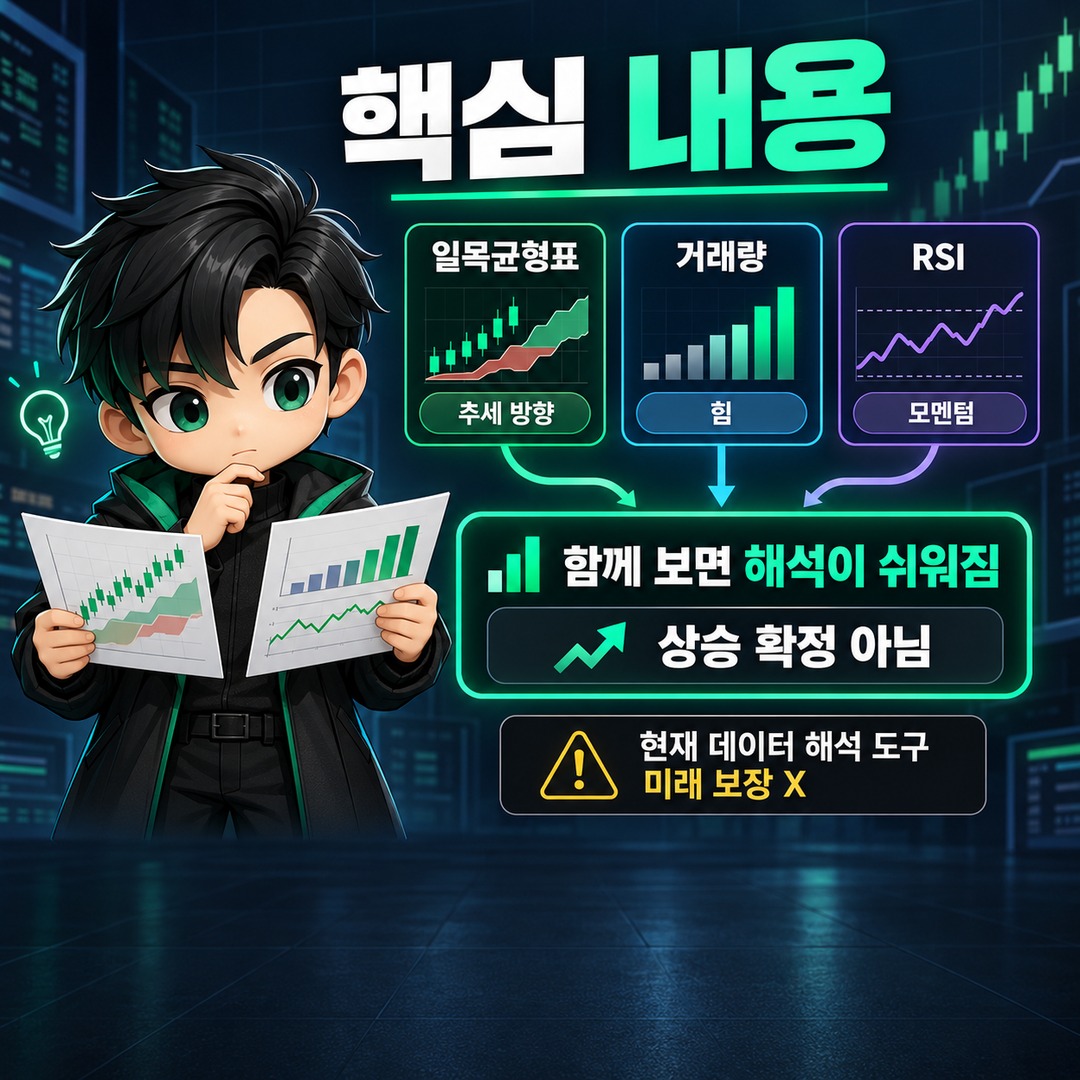
Consider a situation where the price is below the cloud and the Conversion Line is below the Base Line.
If the price also breaks below a major support area with increasing trading volume, while RSI indicates weak momentum, the conditions supporting a bearish interpretation overlap across different indicators.
Conversely, if the price is falling but trading volume is declining and RSI is showing a different pattern from the price, it becomes difficult to predict the next movement based solely on the downward trend.
In other words, the purpose of using these three indicators together is not to count signals and make buy or sell decisions. Instead, it is to distinguish whether different types of signals confirm the same direction or contradict one another.
The Most Caution Is Needed When Signals Conflict
On actual charts, the three indicators do not always point neatly in the same direction.
The price may be above the cloud while trading volume is declining. Ichimoku Cloud may indicate an uptrend while RSI shows weakening momentum. Conversely, even when RSI is in oversold territory, the price may continue falling below the cloud.
There is no need to force these combinations into either a bullish or bearish category.
The fact that signals conflict can itself provide useful information, indicating that the current chart does not offer sufficient confirmation of a single direction.
In particular, during sideways markets, signals from trend indicators and momentum indicators can repeatedly reverse. It is therefore important not to rely on a single crossover or one RSI reading.
How to Apply This Approach to an Actual Chart
Rather than performing complicated calculations, a simple method is to apply the following sequence repeatedly to the same chart.
1. Check whether the price is above, inside, or below the Ichimoku cloud.
2. Examine the relative positions of the Conversion Line and Base Line.
3. Check whether the price has broken above important resistance or below important support.
4. Determine whether trading volume during that movement increased above its recent average.
5. Check whether RSI is moving in the same direction as the price.
6. Do not assume a reversal is certain based solely on RSI overbought or oversold readings.
7. If the three indicators conflict, do not force a directional conclusion.
The key to this approach is not using as many indicators as possible. It is assigning distinct roles: Ichimoku Cloud for the trend, trading volume for the strength of the movement, and RSI for momentum.
Even when all three indicators point in the same direction, future prices cannot be determined with certainty. Technical analysis uses historical and current market data to assess present conditions and possible scenarios. New information, including corporate earnings, regulatory disclosures, market conditions, and news, can change price direction.
Therefore, the combination of Ichimoku Cloud, trading volume, and RSI is best used as a way to assess how much supporting confirmation exists for a current upward or downward price movement, rather than as a formula for identifying stocks that will rise tomorrow. Investing involves the risk of losing principal, and technical analysis should not be the sole basis for investment decisions.
※ This article is provided for informational purposes to help readers understand market trends and does not constitute an investment recommendation for any particular stock or asset. All final investment decisions and responsibilities rest with the individual investor.
Related Articles
How to Read Ichimoku Cloud: 5 Things to Check Before Looking at the Cloud
How to Identify a Stock Market Bottom: 4 Signals to Check Before RSI 30
이 포스팅은 쿠팡 파트너스 활동의 일환으로, 이에 따른 일정액의 수수료를 제공받습니다.