

William O’Neil’s Breakout Trading: A Beginner’s Guide to Buying at $100 and Planning Both Exits
William J. O’Neil’s approach to growth stocks asks three connected questions: where might a purchase make sense, where should a failed trade be closed, and what should be reviewed when a position becomes profitable? A buy signal alone is not a complete trading plan.
For a hypothetical purchase at $100, $92–$93 illustrates a loss-limit reference and $120–$125 illustrates a profit-taking review range. Neither a profitable outcome nor execution at an intended exit price is guaranteed.
This lesson uses a fictional growth stock and three original educational diagrams. They are not a current stock recommendation, a historical performance record, or a price forecast.
1. What is William O’Neil’s breakout approach?
O’Neil’s CAN SLIM framework combines company growth with price and volume behavior. It considers earnings and sales growth, a sound price base, trading volume, institutional demand, and the direction of the broader market. It also requires a selling plan.
A breakout is a move above an important reference level after a stock has formed a price structure. Crossing a line on a chart does not, by itself, establish a good buying opportunity. The surrounding conditions matter.
| Term | Plain-English meaning | What to examine |
|---|---|---|
| Growth stock | Shares in a company expected to increase earnings and sales | Evidence of actual business growth |
| Base | A price structure formed during consolidation or correction | Whether the structure is sound |
| Breakout | A move above an important resistance level | The price move and its context |
| Volume | The number of shares traded over a period | Whether activity expands with the breakout |
| Pivot | A reference price used to assess a chart setup | The difference between a reference and an actual fill |
| Stop loss | An exit intended to limit a losing trade | Loss measured from the actual purchase price |
| Profit taking | Selling to realize a gain | The gain and other selling signals |
| Institutional demand | Buying and selling by large investors | Price and volume evidence, with appropriate limits |
The public principles emphasize checking the overall market trend before buying. An attractive company can still face a difficult environment when the broader market is falling. Growing earnings, a sound base, increased volume, institutional support, and an uptrending market should be considered together.
A rising stock and a well-timed entry are different things. Chasing a stock after a large advance can make risk management harder, even if the stock later moves in the anticipated direction.
2. Chart 1: Read price and volume together
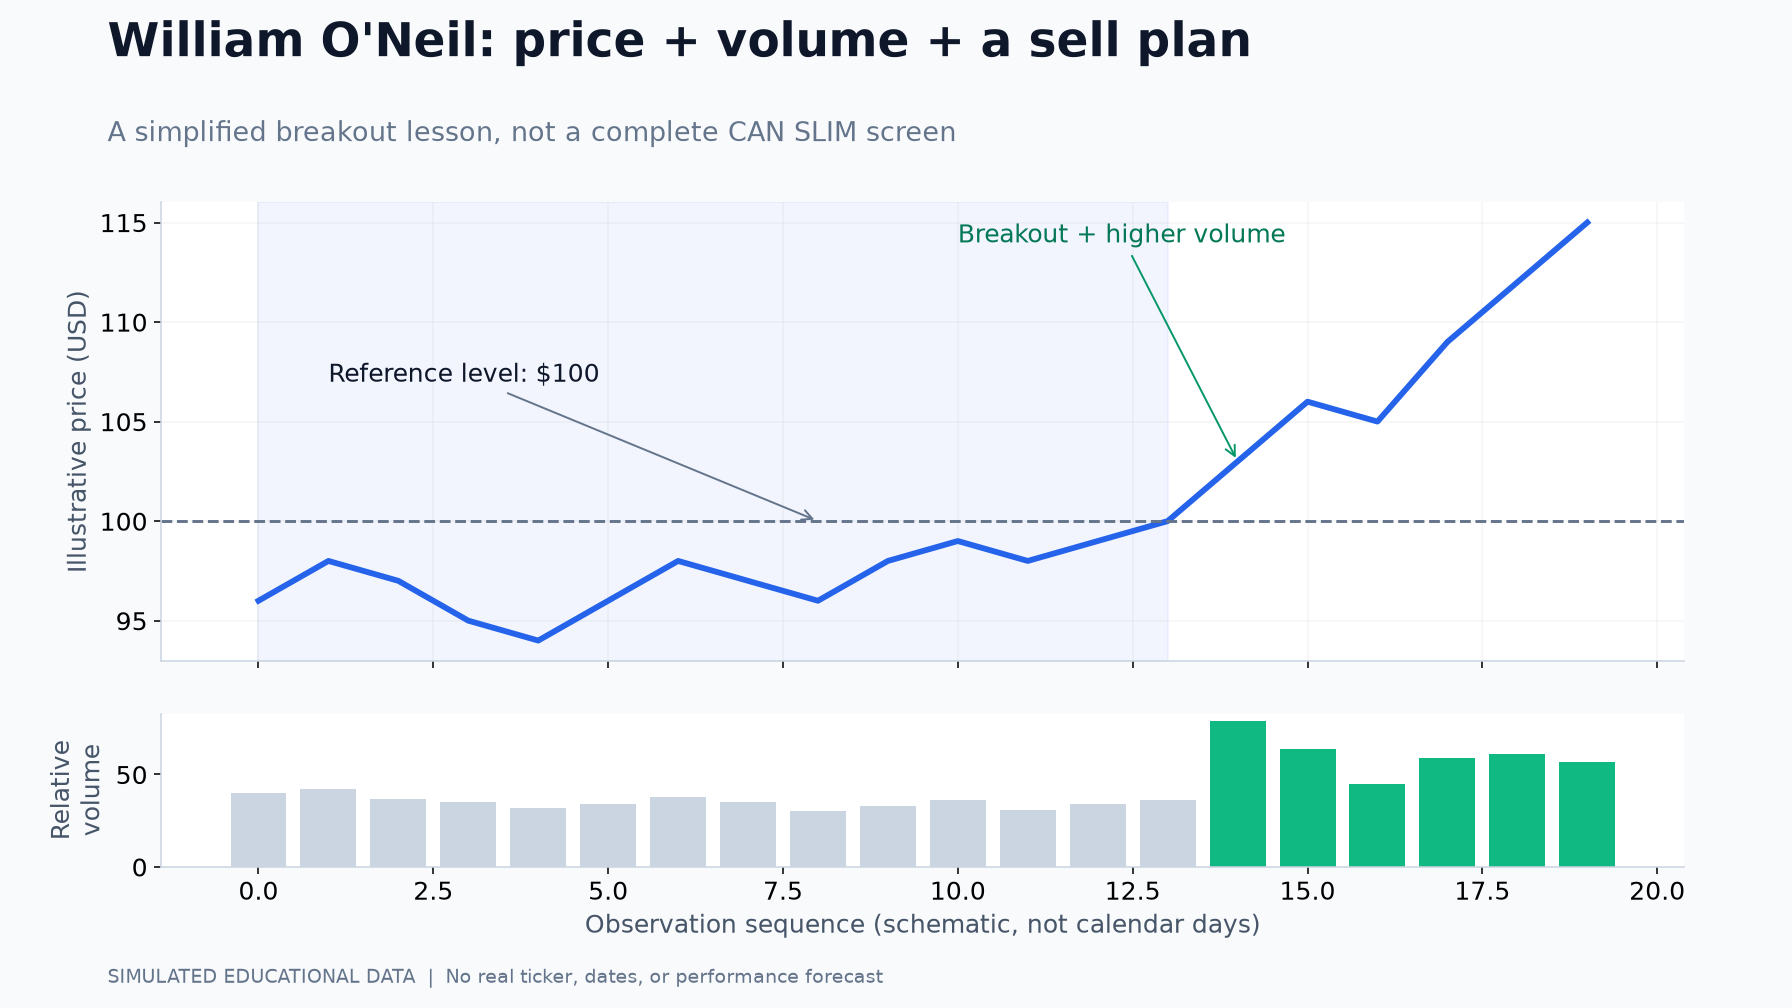
The first diagram shows an imaginary price approaching and crossing a $100 reference. The upper panel displays price; the lower panel displays relative volume. The illustration explains the relationship between the two, rather than validating a complete trading setup.
What the labels mean
“Reference level: $100” marks the fictional reference price. The blue line initially fluctuates below that level, then approaches it and rises above it. The level was chosen for teaching; it is not an identified buy point in a real security.
“Breakout + higher volume” highlights the move above the reference alongside greater trading activity. Gray bars represent the earlier observations and green bars represent the later observations. Volume expansion during an upward breakout can provide evidence of demand. It cannot, on its own, prove that institutions were net buyers.
The line does not rise without interruption. A pullback after a breakout is possible. When price fluctuates, review whether the original reasons for buying remain valid instead of assuming that every dip is either harmless or a decisive failure.
What this diagram cannot establish
“Observation sequence” means a series of illustrative observations, not actual trading dates. “Illustrative price” is an example price, and “Relative volume” is a simplified measure of activity.
The picture is not a record of daily candles and does not establish a formally valid cup-with-handle pattern over a particular number of days. It supplies no verified company earnings, sales, institutional ownership history, or broad-market trend. It therefore cannot validate the full CAN SLIM framework.
3. Chart 2: Calculate both exits from the actual purchase
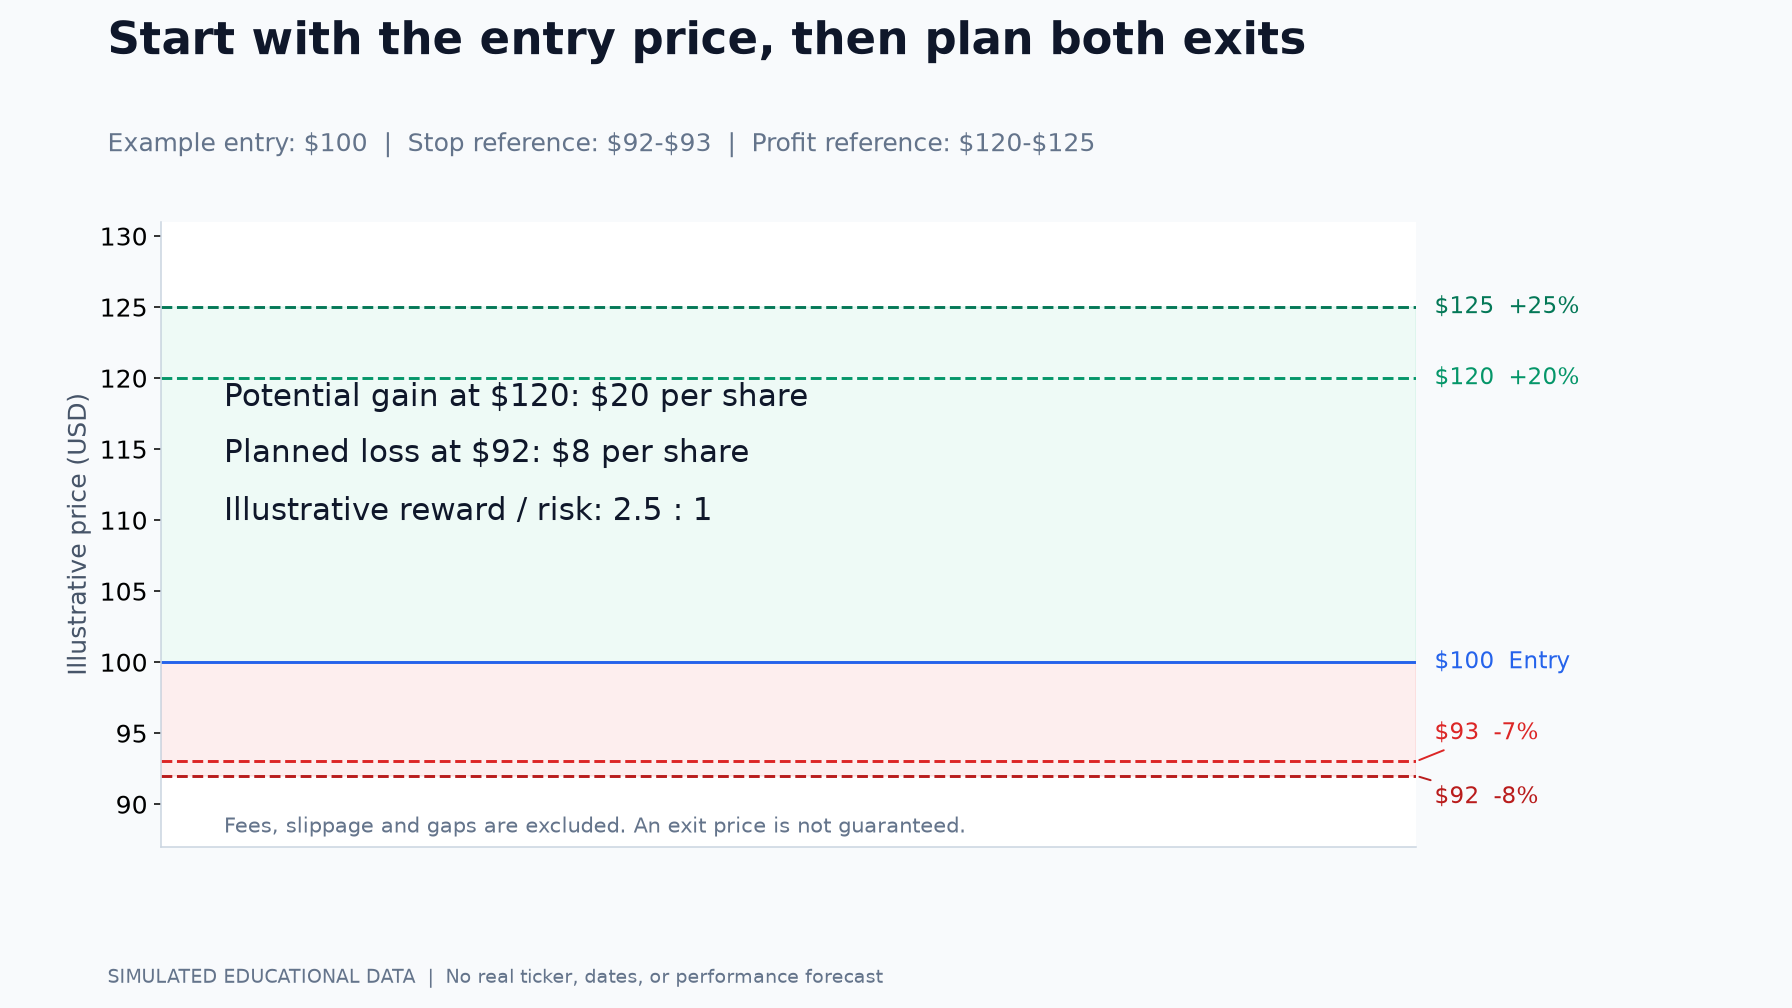
O’Neil’s published approach emphasizes limiting a loss at approximately 7–8% below the purchase price. It also discusses reviewing profit taking after a typical advance of approximately 20–25%, while recognizing exceptions for particularly strong leaders.
The loss reference is the actual original purchase price. It is not the chart’s high, and it is not automatically the pivot or breakout reference.
| Item | Calculation from a $100 purchase | Reference price |
|---|---|---|
| Actual purchase | Starting price | $100 |
| Loss of 7% | 100 × 0.93 | $93 |
| Loss of 8% | 100 × 0.92 | $92 |
| Gain of 20% | 100 × 1.20 | $120 |
| Gain of 25% | 100 × 1.25 | $125 |
These are educational calculations for a fictional purchase. The blue “Entry” line is $100. The red area shows loss references; the green area shows profit references.
The two loss references are alternatives for understanding the published range. They do not mean that a trader should move a previously chosen loss limit from $93 down to $92 after the trade begins losing money. Choose a plan in advance and do not make it more permissive simply because a loss has occurred.
What if the actual purchase price is different?
The diagram’s $100 breakout reference and an investor’s actual execution price can differ. If an investor enters later at another price, loss calculations must start from that actual original purchase price. Otherwise, the planned percentage and the actual loss can diverge.
The pivot helps assess the setup. The purchase price measures the investor’s exposure. Keeping those two roles separate is essential.
What does a 2.5:1 reward-to-risk example mean?
| Item | Amount per share | Interpretation |
|---|---|---|
| Purchase | $100 | Initial entry |
| Planned loss exit | $92 | Planned loss of $8 |
| Hypothetical profit exit | $120 | Potential gain of $20 |
| Reward / risk | 2.5:1 | $20 ÷ $8 |
Buying at $100 and selling at $92 would mean an $8 loss per share before costs. Selling at $120 would mean a $20 gain per share before costs. The author’s illustrative calculation is:
20 ÷ 8 = 2.5, or a planned reward-to-risk ratio of 2.5:1.
This describes a plan, not a realized return, a success rate, or the probability of winning. Fees, taxes, and slippage are excluded. Slippage is the difference between an anticipated execution price and the actual fill. A sharp decline or a price gap can produce a sale below $92 and a larger loss. A stop order does not guarantee execution at its trigger price.
Must every position be sold in full at $120–$125?
No. The public principles discuss profit taking in the 20–25% area for typical advances, but also recognize that unusually strong leaders can warrant different treatment. A rapidly advancing stock with continuing institutional demand may require review of additional selling signals.
Treating $120 or $125 as an automatic full-position sale for every stock would oversimplify the method. The example explains reference points; it does not replace judgment about the stock, the market, or an appropriate selling plan.
4. Chart 3: Distinguish a holding case from a failed breakout
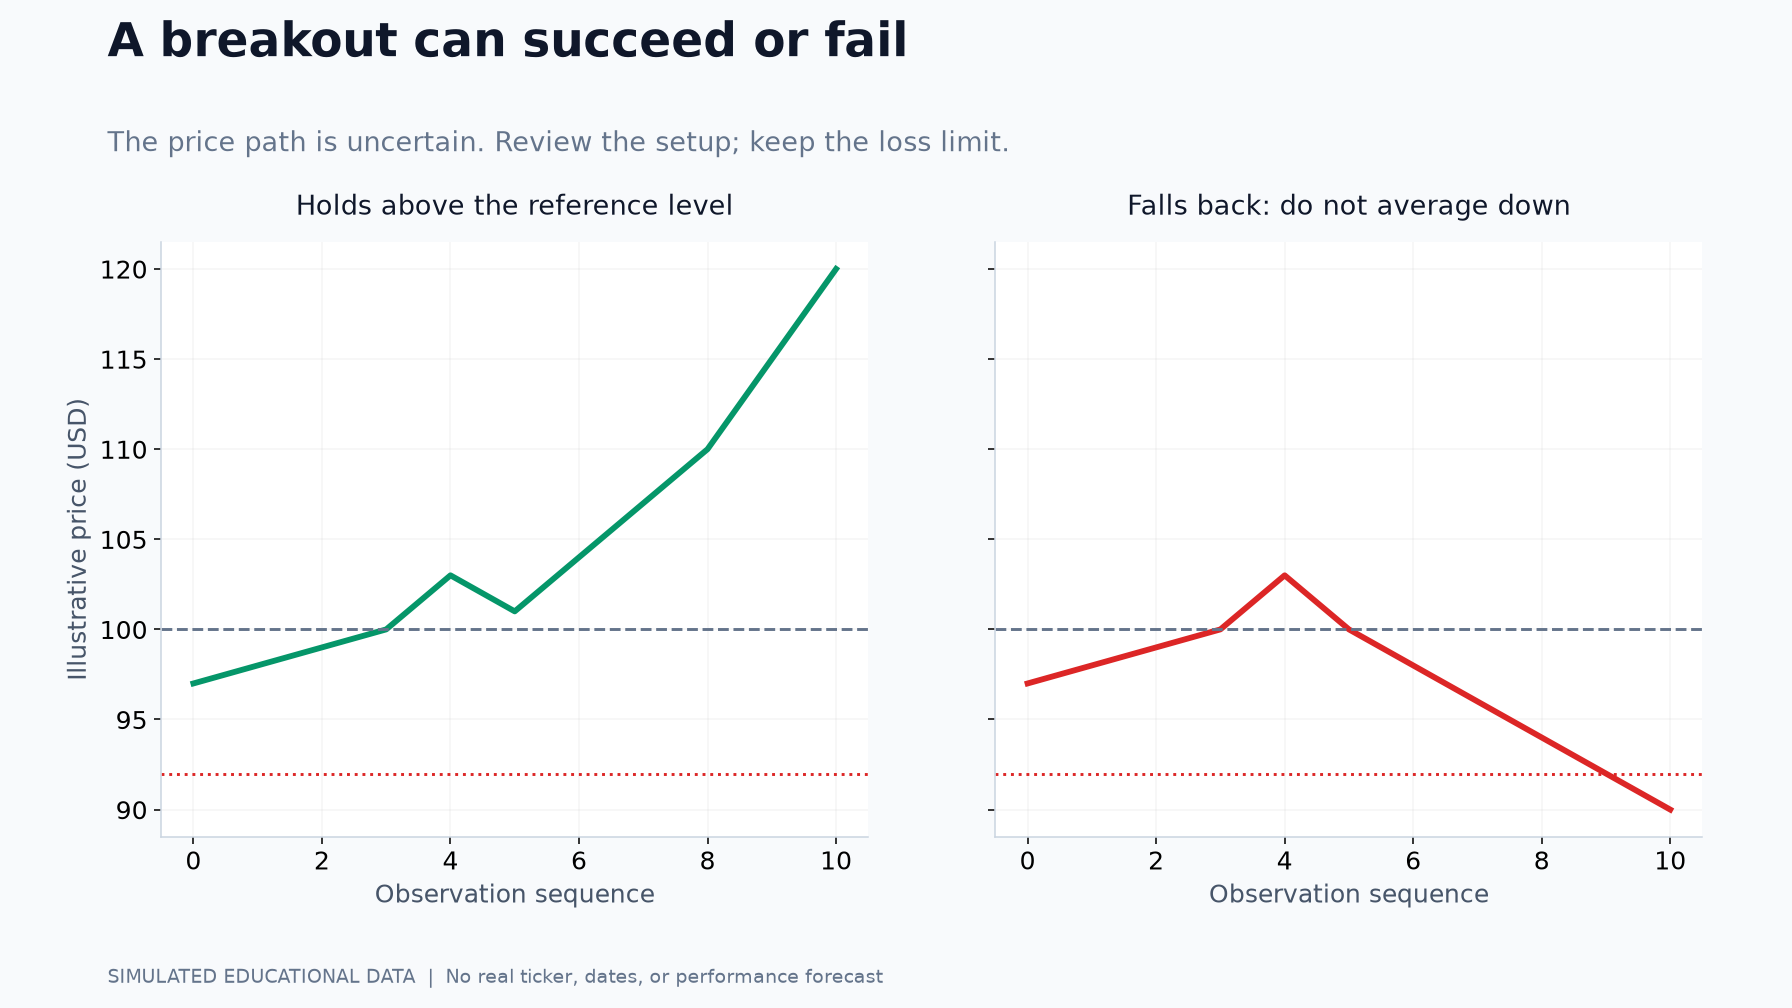
The third diagram compares two possible paths after a breakout. The outcome is uncertain at entry.
Left panel: the reference holds
“Holds above the reference level” describes the green path. Price crosses approximately $100, fluctuates, and eventually reaches $120 in this fictional sequence.
The lesson is to review the original investment case during normal fluctuations. Check company growth, the price structure, volume, and the broad market. Mere frustration that a position has not risen quickly is not a complete selling rationale. That does not mean holding indefinitely: the important question is whether the original reasons for the purchase remain valid.
Right panel: the breakout fails
“Falls back: do not average down” describes the red path. The fictional price rises above $100, falls back below the reference, crosses the $92 loss reference, and continues toward $90.
Two mistakes are particularly relevant: buying more simply to reduce the average cost of a losing position, and postponing a planned loss exit because the position has already been held for a long time. The published principles emphasize loss control and avoiding averaging down.
| Price situation | Evidence to review | Response to consider |
|---|---|---|
| Breakout from a sound base | Volume, business growth, and market trend | Assess whether the purchase conditions are met |
| Sharp advance after the breakout | Distance from the original entry area | Avoid an emotional chase |
| Temporary sideways movement | Whether price, volume, and market conditions still support the case | Review the evidence rather than impatience alone |
| Return below the reference | Signs of failure and changing demand | Reassess the original buying assumptions |
| Predetermined loss limit reached | Loss from the actual purchase price | Apply the planned loss-control decision |
| Gain reaches the 20–25% review area | Strength of the advance and other selling signals | Review profit taking, including a partial sale where appropriate |
The $92 loss reference is shown as a red dotted line. The continuation below it illustrates the risk of delay or adverse price movement; it is not an instruction to ignore the planned exit.
Both horizontal axes show observations rather than calendar days. Neither path predicts how many days an advance will last or when a decline will start.
5. Keep a record before, during, and after the trade
Looking only for buy signals leaves out much of the process. Check entry conditions before buying, reassess the evidence while holding, and review the decision afterward.
| Stage | Question | What to record |
|---|---|---|
| Before buying | Are earnings and sales growing? | Changes in operating results |
| Before buying | Has a sound base formed? | The price structure |
| Before buying | Does volume expand on the breakout? | Trading activity |
| Before buying | Is the market in an uptrend? | Broad-market direction |
| Before buying | Are both exits planned? | Purchase price and selling references |
| While holding | Does the breakout thesis still hold? | Changes in price and volume |
| While holding | Has the loss limit been reached? | Loss from the actual purchase |
| While holding | Has the profit review area been reached? | Gain and additional selling signals |
| After selling | Was the plan followed? | Actual execution prices |
| After selling | What was missed in the decision? | Mistakes and possible improvements |
Before buying: start with conditions, not just a price
A price reaching the reference level does not settle the decision. Review business growth and the market environment, then examine whether the move is supported by volume. Entering after an already substantial advance can create a different risk from the original setup. Feeling that an opportunity has been missed is not a reason to chase it.
While holding: separate impatience from invalidation
Review the original evidence rather than selling solely because waiting feels frustrating. Conversely, having waited a long time is not a reason to extend a loss limit that has been reached.
| Observation | First check | Direction of review |
|---|---|---|
| Sideways above the reference | Price, volume, and market conditions | Revisit the original case rather than emotion alone |
| Loss limit reached | Original purchase price and predetermined limit | Do not postpone the exit or widen the limit |
| Gain in the 20–25% area | Leadership and other selling signals | Review profit taking without assuming every position must be sold in full |
This is an educational checklist. It does not invent an official rule requiring a sale after a particular number of flat days. No one can establish the exact date of the next advance in advance.
After selling: review the process as well as the outcome
A stock rising immediately after a sale does not prove that the decision was wrong. Evaluate it using the information available at the time and the plan that was in place. Recording the buying rationale, execution price, loss limit, and selling rationale can help distinguish impatience from a genuinely damaged thesis.
If a new setup appears after a loss exit, assess its conditions afresh. A desire to recover the previous loss is not itself a new buying condition.
6. Can the same rules be transferred directly to crypto?
O’Neil’s framework was developed around growth stocks, including company results and institutional demand. Earnings and sales conditions for a company cannot simply be copied into a market that trades crypto assets 24 hours a day. Liquidity, exchange-specific prices, volatility, and leverage structures also differ.
The practice of reading price with volume and planning loss exposure before entry can be studied more broadly. The 7–8% and 20–25% figures, however, should not be presented as universally validated optimal settings for every coin.
The charts and prices in this lesson are educational examples, not a forecast, backtest result, or recommendation to buy a particular asset. Fees, taxes, and slippage are excluded from the calculations, and a gap can lead to a worse execution than the planned loss reference.
7. Public primary sources
MarketSmith Hong Kong: market direction, institutional demand, and selling discipline
Investor’s Business Daily: the 20 Rules educational guide
MarketSmith Stock Guide: loss control measured from the original purchase price
This lesson is educational information, not a recommendation to buy a particular security or asset. Each investor remains responsible for their own decisions.