

Bitcoin ETF Net Outflows of USD 500,000,000—Why Is the Price Rebounding? Why Fund Flows and Market Prices Diverge
Bitcoin’s price can rebound even when hundreds of millions of dollars flow out of spot Bitcoin ETFs. ETF net outflows reflect fund flows on a particular trading day, while Bitcoin’s price is determined by buying and selling across global spot and futures markets. The outflow amount alone makes it difficult to predict a decline the next day. In fact, November 2026 U.S. spot Bitcoin ETFs

Bitcoin’s price can rebound even when hundreds of millions of dollars flow out of spot Bitcoin ETFs. That’s because ETF net outflows reflect fund flows on a particular trading day, while Bitcoin’s price is determined by buying and selling across global spot and futures markets. The outflow amount alone makes it difficult to predict a decline the next day.
In fact, large outflows have occurred several times at November 2026 U.S. spot Bitcoin ETFs. But the fact that money is flowing out of ETFs and how much Bitcoin will fall in the future are separate questions.
Let’s look at the difference using actual ETF aggregate figures and a calculation example.
1. Does an ETF net outflow of USD 500,000,000 mean that USD 500,000,000 worth of Bitcoin was immediately sold?
Not exactly.
A net outflow from a spot Bitcoin ETF means that redemptions exceeded new creations of ETF shares over a given period. Trading ETF shares among investors on an exchange is different from a reduction in the total number of shares issued by the ETF itself.

Let’s assume the following situation:
New ETF creations: USD 200,000,000
ETF redemptions: USD 700,000,000
ETF net outflow: USD 500,000,000
The calculation is as follows.
USD 200,000,000 - USD 700,000,000 = -USD 500,000,000
This figure means that a net outflow of funds occurred from the ETF.

However, there is an important distinction here.
First, when an investor sells existing ETF shares to another investor, that transaction does not necessarily result in an ETF redemption.
Second, the method and timing of trading or transferring the underlying asset, Bitcoin, depend on the fund’s creation and redemption structure.
Third, even if Bitcoin is sold in connection with ETF redemptions, other market participants may absorb that supply.
Therefore, ETF net outflows should not be interpreted as equivalent to the actual value of sell orders entering the global Bitcoin market that day.
2. About USD 582,300,000 flowed out of the November 19 Bitcoin ETF
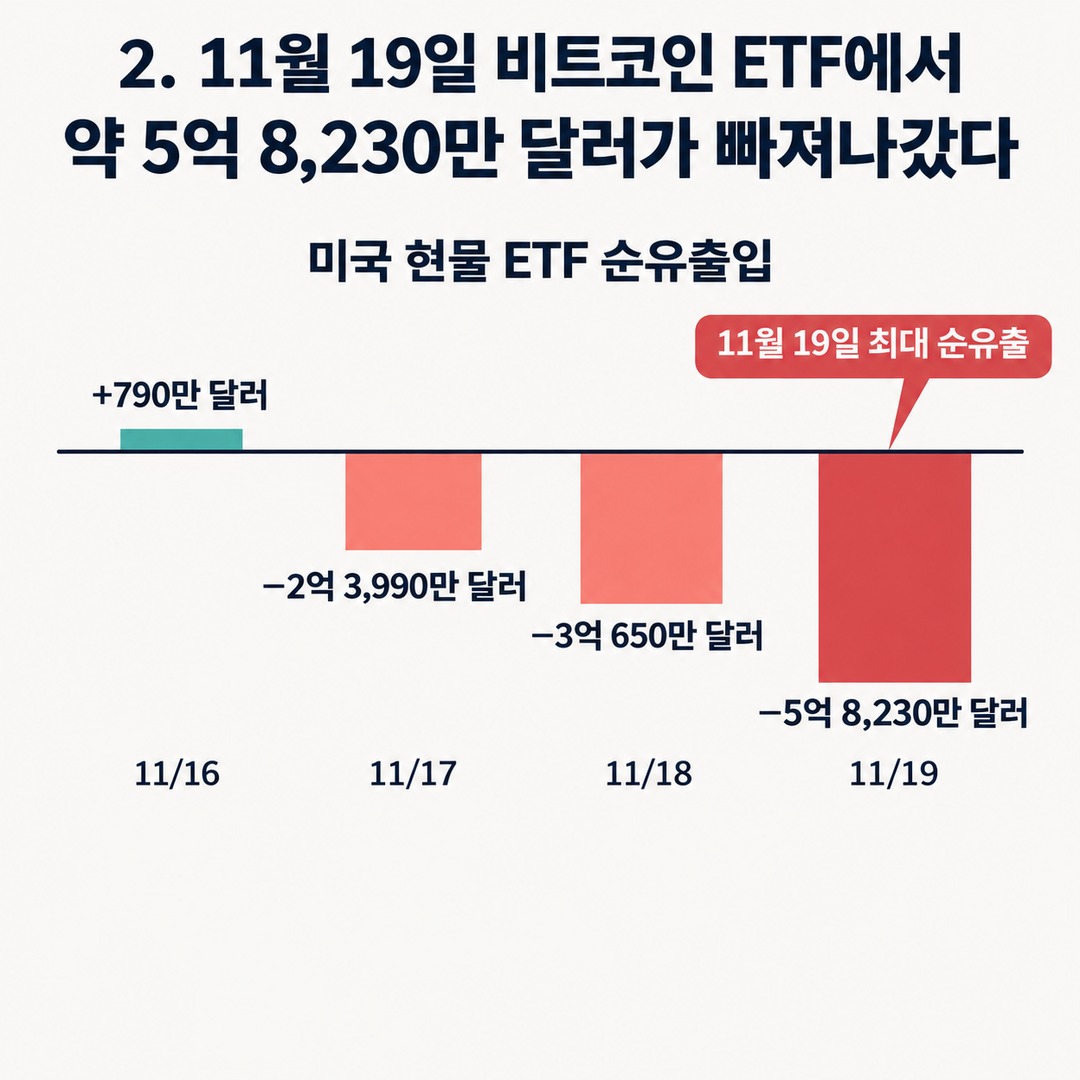
Data from November 2026, published by Farside Investors, which tracks U.S. ETF fund flows, shows trading days with substantial outflows.
| U.S. trading date | Total ETF net inflows/outflows |
|---|---|
| November 16 | +USD 7,900,000 |
| November 17 | -USD 239,900,000 |
| November 18 | -USD 306,500,000 |
| November 19 | -USD 582,300,000 |
Adding up the net outflows over 3 trading days, from November 17 through 19, gives the following:
2 hundred million + 3,990 ten thousand + 3 hundred million + 650 ten thousand + 5 hundred million + 8,230 ten thousand = USD 1,128,700,000 net outflow
This is the author’s calculation.
A net outflow of about USD 1,128,700,000 over 3 trading days shows the flow of funds from ETF investors.
However, this figure alone does not establish that ETFs were the sole cause of Bitcoin’s price decline over the same period.
To identify the causes of price movements, spot-market trading, derivatives position liquidations, market liquidity, and macroeconomic factors should also be examined.
Official data source: Farside Investors Bitcoin ETF Fund Flows
3. Three reasons Bitcoin’s price can rise while money flows out of ETFs
Buying pressure may be stronger outside ETFs
ETFs are just one of several ways to trade Bitcoin.
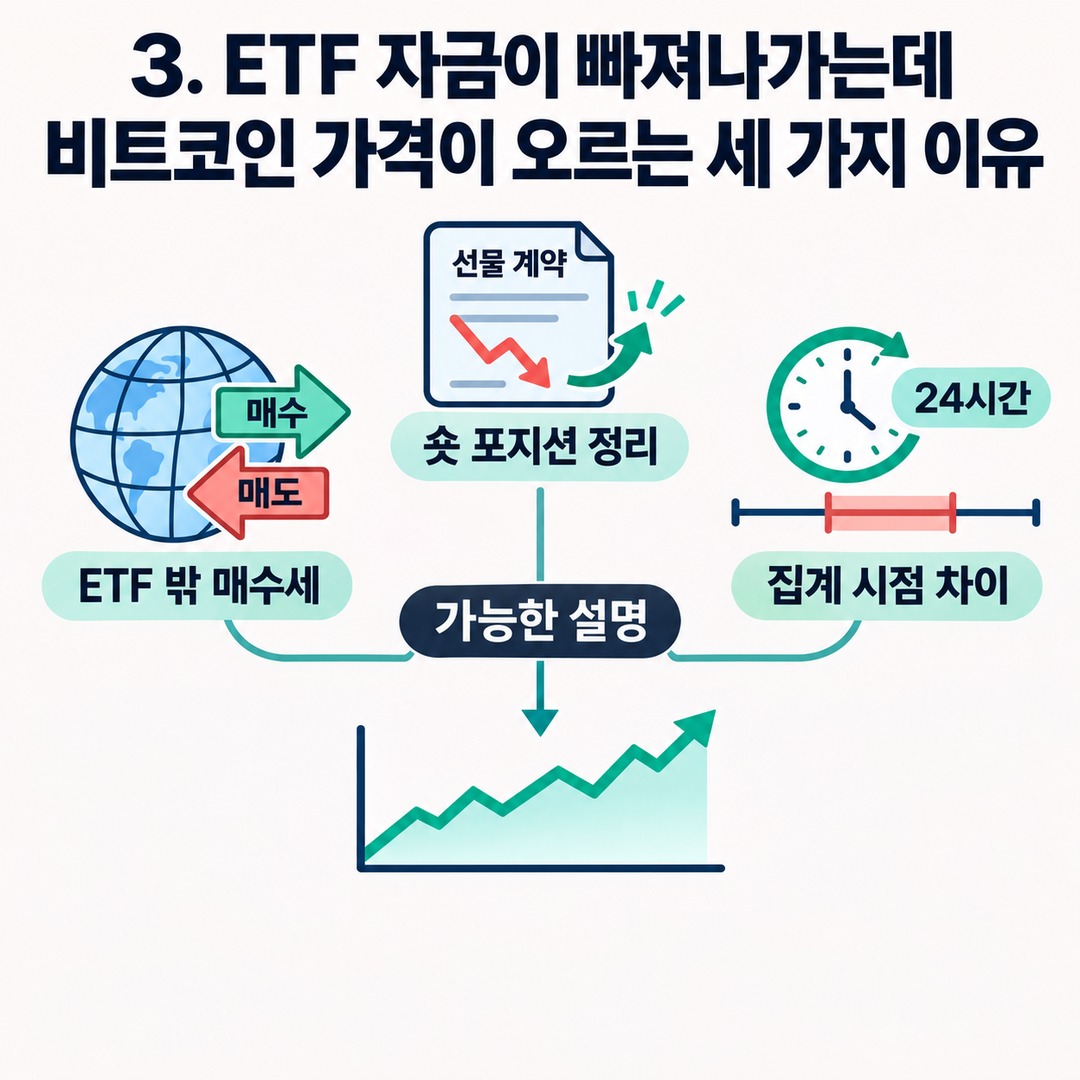
Bitcoin trades through various channels, including global spot exchanges, over-the-counter (OTC) transactions between institutions, and derivatives markets.
Even if ETF redemptions create selling pressure, the price can rise if demand from other buyers is strong enough.
Suppose, for example, that net outflows of USD 500,000,000 occur in connection with ETFs.
If strong buying demand arises through other trading channels during the same period, the price does not necessarily have to fall.
However, you cannot calculate whether the price will rise by simply subtracting ETF net outflows from the amount bought in other markets. The trading channels and aggregation criteria differ.
Closing short positions in futures markets can amplify a rally
When Bitcoin’s price rises, futures traders who had bet on a decline may close their short positions.
In particular, if leveraged short positions are forcibly liquidated, an exchange’s liquidation system may generate buy orders to close those positions.
This process can temporarily amplify the price increase.
However, a rebound caused by short liquidations does not mean that long-term spot buying demand has increased.
Whether buying pressure continues after short liquidations decline needs to be assessed separately.
ETF fund flows may show up later than price movements
Bitcoin trades 24 hours a day, while U.S. spot Bitcoin ETFs trade during U.S. stock market hours.
ETF fund flows are also aggregated by U.S. trading day.
So when Bitcoin’s price is rebounding in Korea, the ETF net outflow figure available at that time may actually reflect the previous U.S. trading day.
Comparing figures from different time periods can make fund flows and prices seem to contradict each other.
4. Do ETF net outflows signal a price drop the next day?
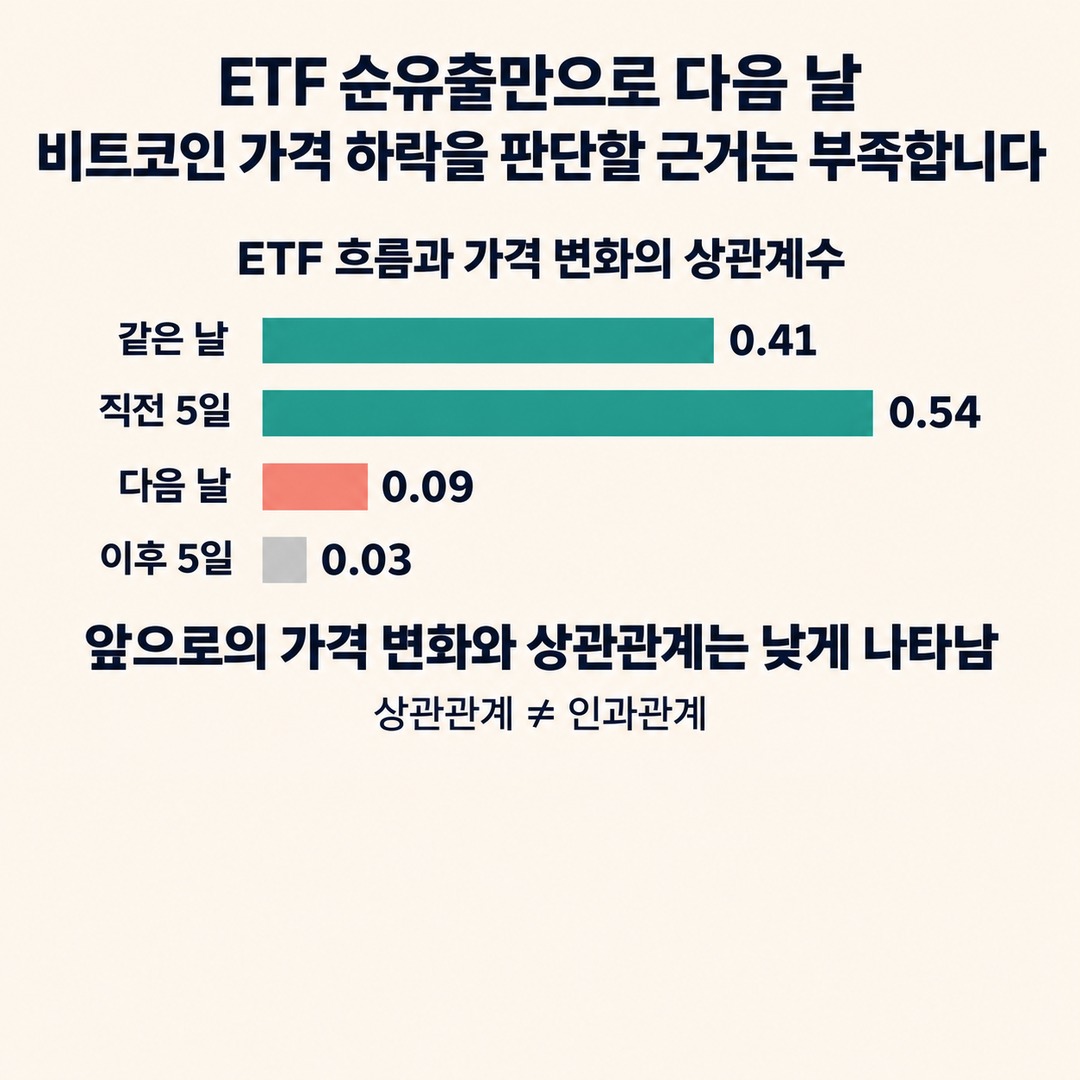
There is not enough evidence to conclude from ETF net outflows alone that Bitcoin’s price will fall the next day.
Research published by 2026-10-22 DWF Labs analyzed the relationship between U.S. spot Bitcoin ETF fund flows and Bitcoin’s price.
The study reported the following correlation coefficients:
| Comparison | Correlation coefficient |
|---|---|
| Bitcoin price movement on the same day as ETF flows | 0.41 |
| Bitcoin price movement in the 5 days before ETF flows | 0.54 |
| Bitcoin price movement the day after ETF flows | 0.09 |
| Bitcoin price movement in the 5 days after ETF flows | 0.03 |
A correlation coefficient is a statistical measure showing how closely two variables move together.
The closer it is to 1, the stronger the positive correlation; the closer it is to 0, the weaker the linear relationship.
In this study, ETF fund flows had a stronger relationship with price movements that had already occurred than with future price movements.
In particular, the correlation coefficient with price movements over the following 5 days was very low, at 0.03.
This supports the interpretation that it is difficult to predict future price direction based on ETF net outflows alone.
However, the study analyzed historical data from a specific period. Results may vary depending on the analysis period, sample, and market conditions, and correlation does not prove causation.
5. Four figures to distinguish when checking Bitcoin ETF net outflows
The figures most often confused in ETF news are net outflows, trading volume, assets under management, and the actual amount of Bitcoin held.
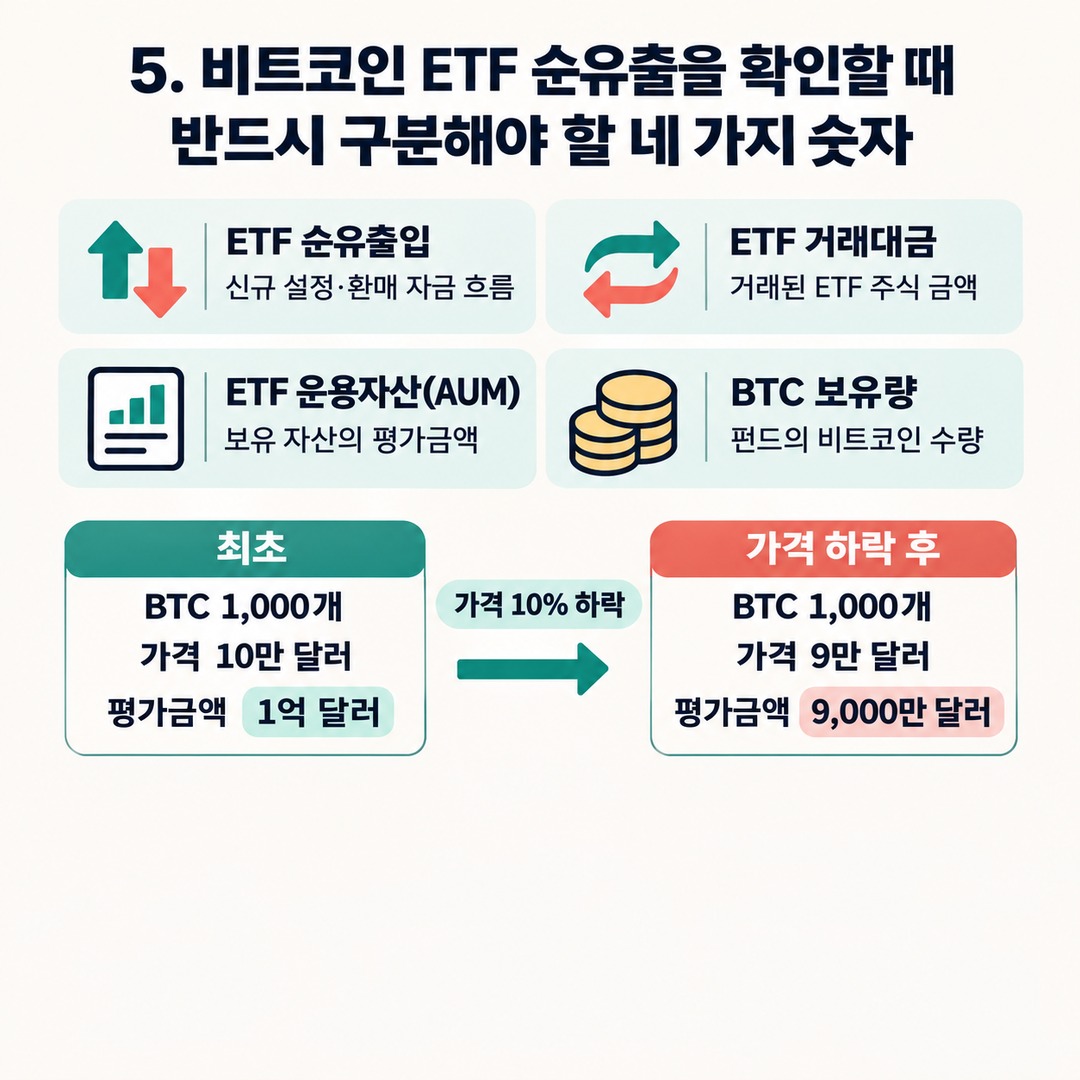
| Metric | What it shows |
|---|---|
| ETF net inflows/outflows | Fund flows from new creations and redemptions |
| ETF trading volume | The value of ETF shares traded in the market |
| ETF assets under management (AUM) | The assessed value of the assets held by the fund |
| BTC holdings | The amount of Bitcoin held by the fund |
For example, suppose Bitcoin’s price fell by 10%.
If an ETF holds 1,000 Bitcoin and the initial price was USD 100,000 per coin, its holdings are valued at USD 100,000,000.
If the price falls to USD 90,000, the holdings are valued at USD 90,000,000.
Initial BTC holdings: 1,000 BTC
Subsequent BTC holdings: 1,000 BTC

Initial holdings value: USD 100,000,000
Subsequent holdings value: USD 90,000,000
Assets under management fell by USD 10,000,000, but Bitcoin holdings remained unchanged.
This is the author’s calculation and a simplified example that excludes fees, cash holdings, and changes in other assets.
Therefore, a decrease in ETF assets under management alone does not mean that investors withdrew that amount of money.
Conversely, even if assets under management increase, you need to distinguish between gains in valuation due to a rise in Bitcoin’s price and actual new inflows.
6. Where and how can you check Bitcoin ETF net outflow data?
The simplest way is to check an aggregate table showing daily fund flows for U.S. spot Bitcoin ETFs.
One prominent public source is Farside Investors’ Bitcoin ETF Flow.
Follow these steps:
1. Open Farside Investors’ Bitcoin ETF fund flows page.
2. Check the most recent U.S. trading day for which aggregation is complete.
3. Check total net inflows and outflows in the “Total” column on the right side of the table.
4. Compare fund flows for individual ETFs such as IBIT, FBTC, and GBTC.
5. Look at cumulative flows over the most recent 3–5 trading days, not just the daily figure.
6. Compare these figures with Bitcoin’s price over the same period, aligning the time zones and reference times.
One point to watch is that an individual ETF’s net outflow does not mean the ETF market as a whole experienced a net outflow.
In fact, 2026-11-04 Farside data showed that about USD 201,200,000 flowed out of BlackRock’s IBIT, while about USD 236,700,000 flowed into Fidelity’s FBTC.
After adding the other ETFs, the overall result was a net inflow of about USD 74,600,000.
Money flowed out of IBIT alone that day, but money flowed into U.S. spot Bitcoin ETFs as a whole.
Therefore, it is important not to treat the outflow from a particular ETF as an outflow from the entire market.
Also, if a figure is blank in the aggregate table, check whether it means the actual fund flow was 0 or whether the data has not yet been posted.
7. When ETF net outflows and a price rebound occur at the same time, what should you check first?
When the two indicators diverge, first check that you are comparing the same measures and time periods instead of automatically trusting one over the other.
Distinguishing among the following four points can help with interpretation.
First, did the outflow last only one day?
A large outflow on a single day should be distinguished from persistent outflows over several trading days.
Second, did money flow out of ETFs as a whole?
Even if an individual ETF saw outflows, inflows into other ETFs may offset them.
Third, did spot-market trading accompany the price rebound?
Checking spot trading volume and market liquidity can help you see whether the rebound was concentrated in specific derivatives trades. However, increased trading volume alone cannot confirm that new buying pressure will persist.
Fourth, are ETF figures and prices being compared over the same time period?
The interpretation may differ if you compare fund flows for U.S. ETF trading days directly with Bitcoin’s 24-hour price movements measured in Korea Standard Time.
Bitcoin’s price continues to move over the weekend, but no new daily fund flow figures arise from U.S. spot ETF trading days.
Therefore, it is not appropriate to explain a weekend rebound using only Friday’s ETF fund flows.
8. If ETF net outflows continue, will Bitcoin’s price eventually fall too?
Sustained ETF net outflows can weigh on the Bitcoin market.
Spot ETFs are one of the main channels for generating demand for Bitcoin, so prolonged outflows may affect market supply and demand.
However, the persistence of outflows alone cannot establish when or how sharply prices will fall in the future.
Conversely, the resumption of net inflows into ETFs does not guarantee that Bitcoin’s price will rise.
The most important principle for interpreting Bitcoin ETF fund flows as of 2026-11-22 is:
ETF net outflows are confirmed fund flows; a future price decline is an outcome that has not yet occurred.
Distinguishing between the two can help you avoid treating every net outflow report as a sell signal or, when prices rebound, ignoring the risks of fund outflows.
The Bitcoin market is highly volatile and is affected by many factors besides ETF fund flows, including leveraged position liquidations, global liquidity, and shifts in investor sentiment. Rather than deciding whether to buy or sell based on a single indicator, it is important to first understand what that indicator actually measures.
※ This article is for informational purposes to help readers understand market trends and is not a recommendation to invest in any specific security or asset. You are responsible for your own final decisions and investments.