

Why Bitcoin Rebounded After a Sharp Drop: Distinguishing ETF Net Outflows from Futures Liquidations

As of 2026-11-22 morning, 11:05, when assessing Bitcoin’s rebound after a sharp drop, U.S. spot ETF net outflows and forced futures liquidations should be considered separately. ETF net outflows reflect fund creation and redemption flows, while futures liquidations measure positions forcibly closed because of insufficient margin. A price rebound alone is not enough to conclude that buying pressure has recovered.
U.S. spot Bitcoin ETFs recorded net outflows of USD 582,300,000 on November 19. Meanwhile, in the futures market, about USD 331,850,000 worth of Bitcoin long positions were liquidated in a single day, November 20.
Both figures are related to selling pressure, but they measure different things. To assess whether the rebound will continue, consider ETF fund flows, spot buying pressure, futures open interest (OI), and funding rates together.
What Do ETF Net Outflows Actually Represent?
Net outflows from a spot Bitcoin ETF mean that the amount redeemed exceeded the amount newly created. They do not represent the total amount that ordinary investors sold in ETF shares on exchanges.

Individual investors cannot submit redemption requests directly to the trust. Instead, authorized participants create or redeem baskets through a prescribed process.
Therefore, ETF net outflows should be understood as an indicator of fund-level outflows.
The creation and redemption structure can be found in the IBIT report for 2026 year, 3 quarter, filed with the SEC.
November U.S. Spot Bitcoin ETF Fund Flows
Daily U.S. Bitcoin ETF fund flows from Farside Investors show the recent scale of outflows clearly.
Unit: millions of dollars; based on U.S. trading days
| Trading date | Net inflow/outflow |
|---|---|
| November 16 | +7.9 |
| November 17 | -239.9 |
| November 18 | -306.5 |
| November 19 | -582.3 |
| November 20 | -124.5* |
The November 20 figure is a preliminary estimate, as reporting from some funds is not yet complete.
The period to watch here is November 17 through 19.
The author’s calculation of cumulative net outflows over 3 trading days is as follows:
November 17: -USD 239,900,000
November 18: -USD 306,500,000
November 19: -USD 582,300,000
The total was USD 1,128,700,000 in net outflows.
On November 19 in particular, USD 541,100,000 flowed out of BlackRock’s IBIT alone. That was about 92.9% of the day’s total ETF net outflows, USD 582,300,000.
The calculation is as follows:
USD 541,100,000 ÷ USD 582,300,000 × 100 = about 92.9%
This means ETF fund flows on that trading day were heavily concentrated in one fund. However, this figure alone cannot establish why all investors sold or how fund flows will develop in the future.
The November 20 figure also requires caution. Some funds had not yet reported in the Farside data, so -USD 124,500,000 should not be treated as a final confirmed figure.
How Do Futures Liquidations Differ from ETF Redemptions?
A futures liquidation occurs when the margin on a leveraged position falls below the maintenance margin requirement and the exchange forcibly closes the position.
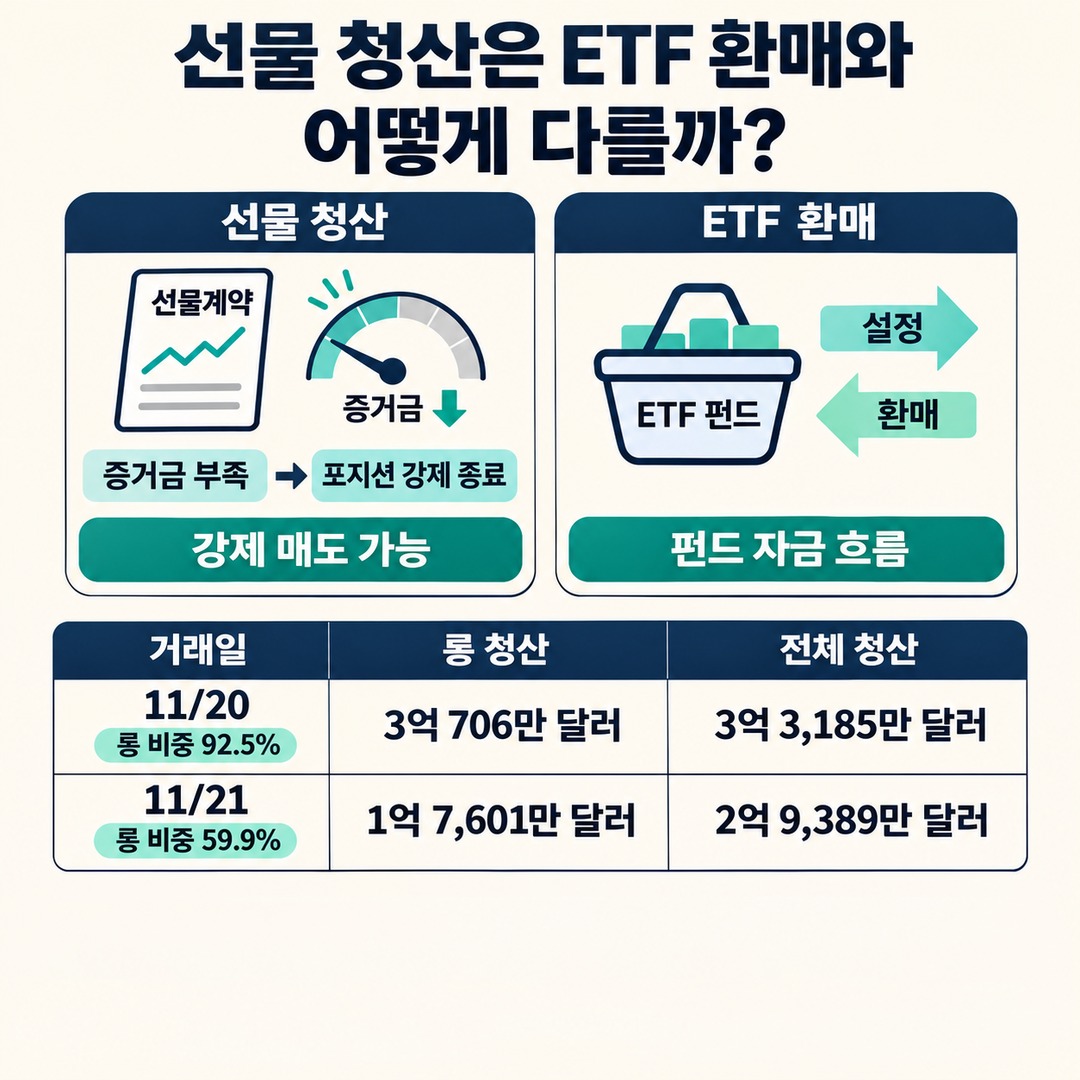
When Bitcoin’s price falls, losses grow on long positions betting on a rise. If margin becomes insufficient, the exchange liquidates the position.
This process can trigger forced sell orders.
Conversely, when the price surges, short positions betting on a decline may be liquidated, triggering forced buying.
According to Binance Futures’ official guidance, liquidations are determined using the mark price, not the ordinary last traded price.
The mark price is calculated using price data from multiple spot exchanges and funding-related data.
November 20–21 Bitcoin Liquidation Volumes
Sharpe Terminal’s data on Bitcoin perpetual futures liquidations on Binance, Bybit, and Deribit show the following:
| Trading date (UTC) | Long liquidations | Total liquidations |
|---|---|---|
| November 20 | USD 307,060,000 | USD 331,850,000 |
| November 21 | USD 176,010,000 | USD 293,890,000 |
On November 20, long positions accounted for 92.5% of all liquidations.
On November 21, the share of long positions fell to 59.9%.
This data is an exchange-by-exchange tally updated through 14 UTC on November 21.
There is an important distinction here.
Long liquidations accounted for a substantial share on November 20. This means that large numbers of leveraged positions betting on a price rise were closed during the decline.
However, a large liquidation figure should not be interpreted to mean that spot investors also sold in the same amount.
That is because futures liquidation amounts represent the notional value of forcibly closed positions, while ETF net outflows are fund flows calculated from creations and redemptions.
Has Bitcoin’s Rebound After the Sharp Drop Really Begun?
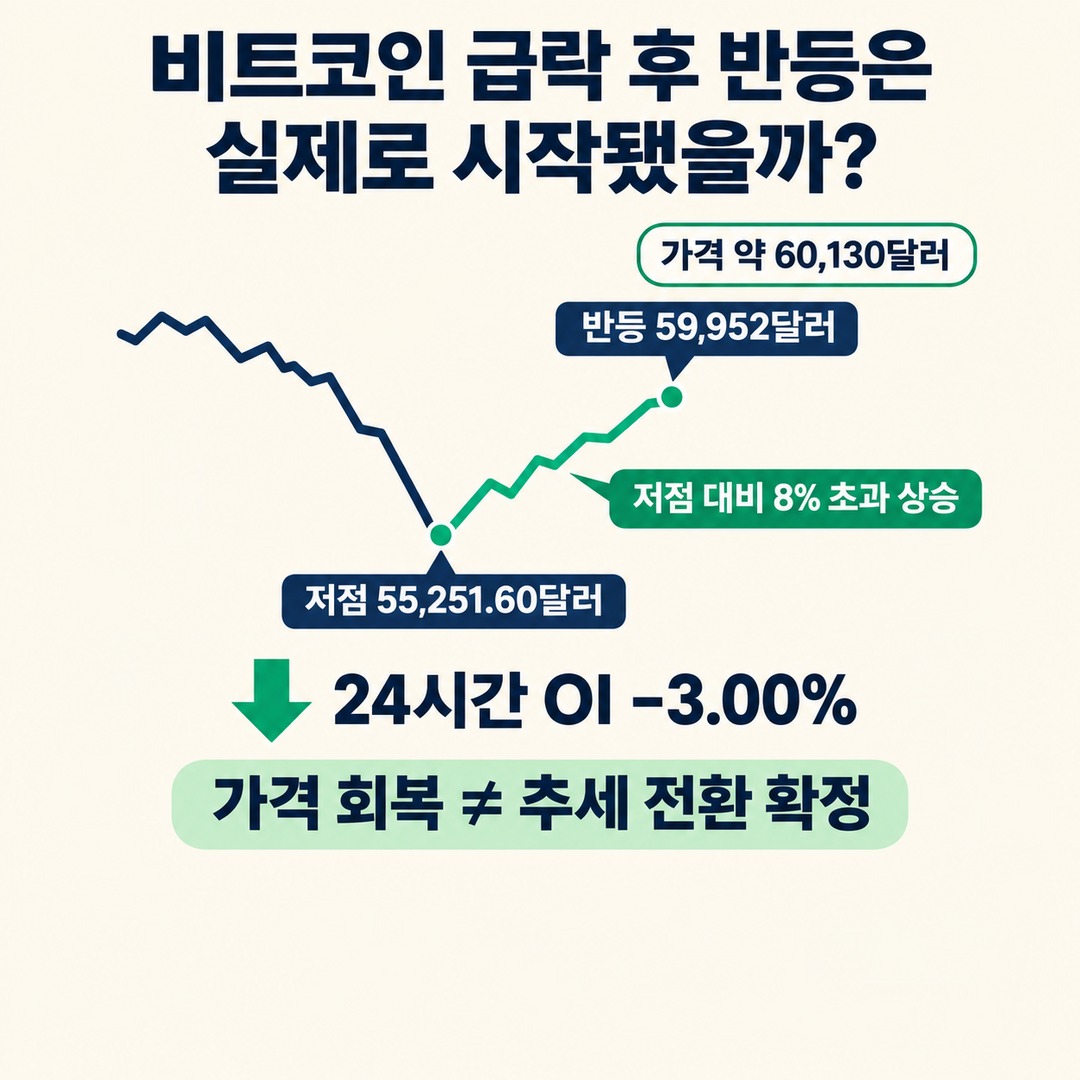
According to a Reuters report on November 21, Bitcoin fell intraday to USD 55,251.60 before rebounding to about USD 59,952. The rise from the low exceeded 8%.
It also briefly recovered USD 60,000 intraday.
This rebound is a confirmed price movement.
However, a price recovery and a trend reversal are two different things.
After liquidations build up in the futures market, prices can recover quickly as short positions are closed. But whether new spot buying is continuing to flow in needs to be checked separately.
Why Open Interest (OI) Matters
Open interest (OI) is the total amount of futures contracts that have not yet been closed.
According to CME Group, open interest increases when new contracts are created and decreases when existing contracts are closed.
Looking at price and OI together can help distinguish market conditions more specifically.
| Price change | OI change | General interpretation |
|---|---|---|
| Rising | Increasing | New positions entering the market |
| Rising | Decreasing | Possible short liquidations |
| Falling | Increasing | More new positions |
| Falling | Decreasing | Existing positions being closed |
This is a basic guide to interpreting position changes, not a formula that definitively identifies market participants’ direction.
In particular, if prices rebound while OI continues to fall, consider whether the rebound may have been influenced by existing short positions being liquidated or reduced.
By contrast, if prices rise as OI increases again and spot buying volume also picks up, there is more reason to check whether new positions are being formed.
November 22 Morning Futures Market Data
The CoinGlass Bitcoin futures page checked at 2026-11-22 morning, 11:05, showed the following figures.
Bitcoin price: about USD 60,130
Open interest over 24 hours: about USD 38,880,000,000
OI change over 24 hours: -3.00%
Futures liquidations over 24 hours: about USD 657,870,000
Share of long liquidations: about 64%
Funding rate: about +0.0031% over 8 hours
These figures are live aggregates and change in real time.
The fact that prices recovered while OI fell over 24 hours makes it difficult to explain the rebound solely as an aggressive increase in new leveraged positions.
However, OI can vary depending on the exchanges included in the data and the types of contracts covered.
What Should You Watch to See Whether the Rebound Will Continue?
To assess whether Bitcoin’s rebound is sustainable, check whether signals from different markets point in the same direction rather than relying on a single indicator.

A practical approach is to examine the following four factors in order.

First, look at spot trading volume and buying and selling pressure.
Check whether spot trading volume rises as prices climb and market buy orders remain dominant.
If futures volume surges while spot buying remains weak, the quality of the rebound should be assessed differently.
Second, check whether ETF net outflows have stopped.
Do not conclude that fund flows have completely reversed based on a single day of net inflows.
Compare confirmed net inflows and outflows across several trading days, based on U.S. trading days.
In particular, distinguish preliminary figures that include funds yet to report from confirmed figures.
Third, see whether prices and OI are rising together.
If prices rise while OI continues to fall, the move may be influenced by existing positions being closed.
Check whether OI is increasing steadily alongside rising prices, and whether spot trading volume also supports the move.
Fourth, check that funding rates are not becoming excessively high.
In perpetual futures markets, funding rates are payments exchanged between long and short positions.
When the rate is positive, longs generally pay shorts; when it is negative, shorts pay longs.
A gradual recovery in the funding rate from negative territory may indicate that position imbalances are easing.
Conversely, if the funding rate rises sharply along with prices, check whether positions are becoming heavily skewed toward longs again.
These indicators are independent points of reference. No specific threshold guarantees that a rebound will continue.
What to Watch When ETF Net Outflows and Futures Liquidations Occur at the Same Time
Even if both indicators deteriorate at the same time, you cannot conclude that they share the same cause.
ETF net outflows reflect fund creations and redemptions, while futures liquidations reflect derivatives positions forcibly closed when they fall below margin requirements.
Therefore, do not simply add the two figures together or treat them as a single measure of selling.
Also, liquidation data may not capture every position on every exchange perfectly. For example, Sharpe Terminal’s tally covers Binance, Bybit, and Deribit, while CoinGlass aggregates data from 30 or more exchanges.
Because their coverage differs, take care when comparing liquidation amounts from the two services directly.
The following facts can be established in this case:
As of November 17–19, cumulative net outflows from U.S. spot ETFs were USD 1,128,700,000.
On November 20, Bitcoin long position liquidations were about USD 307,060,000.
On November 21, Bitcoin recovered more than 8% from its intraday low.
The CoinGlass screen at November 22 morning showed a decline in OI over 24 hours alongside the price recovery.
These facts show that prices rebounded after the sharp drop and that leveraged positions were closed. However, they do not confirm a complete recovery in ETF fund flows or sustained new spot buying.
Ultimately, the most important factor in assessing Bitcoin’s rebound is not how quickly the price rose.
It is whether ETF net outflows ease and futures OI recovers steadily alongside rising prices while spot buying remains firm.
Until you confirm that all three are improving together, distinguish a rebound after a sharp drop from a trend reversal.
※ This article is for informational purposes to help readers understand market trends and is not investment advice for any specific security or asset. You are responsible for your own final decisions and investments.