

Wall Street Rebounds After 3 Days of Declines, S&P500 Gains 0.46%…How Much of the Loss Remains Unrecovered?

U.S. stocks rebounded on September 2 local time, ending a 3-session losing streak. The S&P500 rose 0.46%, the Dow gained 0.56%, and the Nasdaq Composite advanced 0.45%, but the indexes did not fully recover their losses from the previous day. As of the morning of September 3 Korea time, the figures suggest that this rebound was more of a partial recovery from the recent sharp selloff than a complete reversal of the market trend.

How Far Did the 3 Major U.S. Stock Indexes Rise on September 2?
On September 2, the Dow Jones 30 Industrial Average, S&P500, and Nasdaq Composite all advanced. The small-cap-focused Russell 2000 gained 1.1%, outperforming the large-cap indexes. The 3-session losing streak that had continued through the previous trading day also ended.

The S&P500 closed at 7,666.60, up 35.13 points from the previous session, representing a gain of 0.46%. The Dow rose 295.07 points to 53,061.95, gaining 0.56%, while the Nasdaq Composite advanced 118.05 points to 26,217.83, an increase of 0.45%. The Russell 2000 finished at 2,953.17, up 33.03 points, or 1.1%.
The most notable aspect of this rebound was not simply the size of the gains, but the fact that the broader market moved higher together. On the New York Stock Exchange, advancing stocks outnumbered declining stocks by 1.78 times. On the Nasdaq, advancing stocks outnumbered decliners by 1.85 times. These figures suggest that the rally was not driven solely by one or two mega-cap stocks.
How Much of the Previous Day's Sharp Decline Was Recovered?
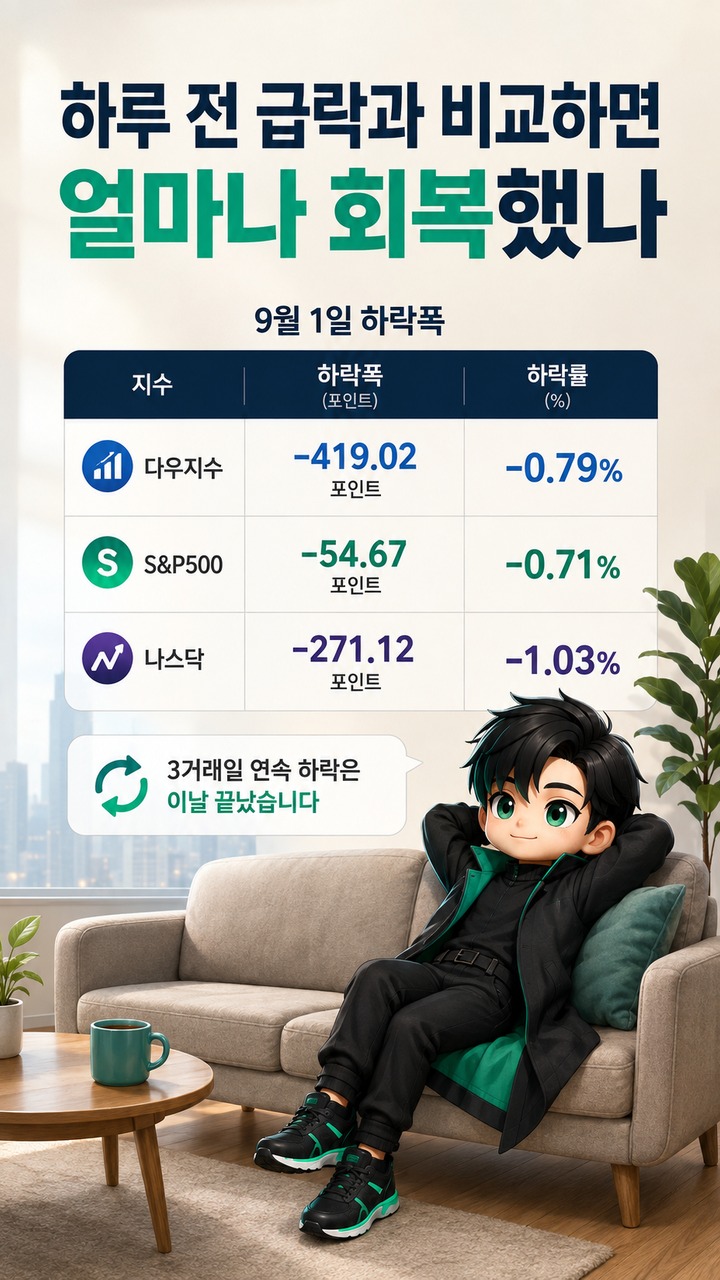
Looking only at the rebound, market sentiment might appear to have changed significantly. However, the interpretation changes when the gains are compared with the losses recorded on September 1. On September 1, the Dow fell 419.02 points, the S&P500 declined 54.67 points, and the Nasdaq lost 271.12 points. Their respective percentage changes were -0.79%, -0.71%, and -1.03%.
Comparing the rebound on September 2 with the previous day's losses, the Dow recovered approximately 70.4%, the S&P500 recovered about 64.3%, and the Nasdaq regained roughly 43.5% of their respective declines.
The author's calculations are as follows.
For the Dow: 295.07 ÷ 419.02 × 100 = approximately 70.4%.
For the S&P500: 35.13 ÷ 54.67 × 100 = approximately 64.3%.
For the Nasdaq: 118.05 ÷ 271.12 × 100 = approximately 43.5%.
It is therefore important to distinguish between all three indexes rising and the market fully recovering from its recent correction. In particular, the Nasdaq recovered less than half of its decline from the previous day.
Losses also remained on a weekly basis. As of the close on September 2, the S&P500 was down 0.6% for the week, the Dow had declined 0.9%, the Nasdaq was lower by 0.7%, and the Russell 2000 had fallen 0.6%. A single day of gains had not yet turned the week's overall performance positive.
Technology Stocks Helped Drive the Rebound, but Not All Tech Shares Rose
Large technology companies and semiconductor stocks contributed to the index rebound. Nvidia gained 3.2% on September 2, Micron rose 2.4%, and Qualcomm advanced 2.0%. Buying interest appeared to return to some semiconductor stocks that had declined during the recent period of risk aversion.

Individual stock performance also varied significantly according to corporate earnings and outlooks. Dell gained 15.8% after raising its annual revenue and profit forecasts. However, the broader market's advance did not mean that technology stocks were uniformly strong. Among S&P500 sectors, materials recorded the largest gain, while real estate was the only major sector to decline.
For this reason, it would be difficult to explain the market movement on September 2 simply by saying that AI stocks were rising again. The small-cap Russell 2000 gained 1.1%, outperforming large-cap indexes, while regional banks and some economically sensitive sectors also recorded advances. The broader participation in buying compared with the previous session is another important factor to consider.
Why Do Treasury Yields and Oil Prices Still Matter?
On September 2, the yield on the 10-year U.S. Treasury note edged down from 4.79% the previous day to 4.78%. Brent crude rose 1% to close at USD 95.63 per barrel. Although oil prices increased again, Treasury yields did not surge significantly further. Combined with gains in major technology stocks, this created room for the stock market to rebound.
However, pressure from the bond market had not disappeared. Global bond selling, elevated energy prices, and tensions in the Middle East continued to be cited as risk factors during trading on September 2. Interpreting a single day's stock market gains as evidence that interest-rate and oil-price pressures have been resolved would therefore go beyond what current market conditions support.
The Federal Reserve's Beige Book released on September 2 also indicated that inflation-related uncertainty had not completely disappeared. For example, economic activity expanded modestly in the Boston Federal Reserve District, but businesses cited uncertainty related to energy prices, the conflict in the Middle East, tariffs, and long-term interest rates. This regional information does not explain why the entire U.S. stock market rose. Rather, it illustrates that inflation and interest-rate pressures remain part of the economic conditions businesses are experiencing.
The Most Important Figure in This Rebound Is the Recovery Rate, Not the Daily Gain
Looking only at the index gains on September 2, the differences may appear relatively small: 0.56% for the Dow, 0.46% for the S&P500, and 0.45% for the Nasdaq. However, calculating how much of the previous day's losses each index recovered reveals a wider gap: approximately 70% for the Dow, 64% for the S&P500, and 44% for the Nasdaq.
In particular, the Nasdaq fell 1.03% on September 1 but gained only 0.45% the following day. Despite a strong rebound in semiconductor stocks, the overall index failed to recover even half of its previous day's losses. By contrast, the Dow recovered approximately 70% of its decline from the preceding session.
This explains why the phrase 'Wall Street rebound' can represent different experiences depending on the index. When assessing U.S. stocks, examining not only the day's percentage gain but also the preceding decline and cumulative weekly performance can provide a more useful picture of the market's current position.
The Next Potential Turning Point: The September 4 U.S. Employment Report
The next major scheduled event to watch is the August employment report from the U.S. Bureau of Labor Statistics. The official release is scheduled for September 4 at 8:30 a.m. local time, with the results due that same night in Korea.
Data released on September 2 also showed that private-sector employment growth was weaker than expected. With concerns about the bond market and energy prices continuing on the same day, the upcoming employment figures will provide another opportunity to assess both economic conditions and the direction of interest rates. However, strong or weak employment numbers alone cannot determine the direction of stock prices in advance. The actual market response will reflect the difference between reported figures and market expectations, changes in Treasury yields, oil prices, and geopolitical developments simultaneously.
Three Things to Check When Evaluating a One-Day Rebound
First, although the 3 major indexes rose on September 2, all remained in negative territory for the week. Second, their recovery rates relative to the previous day's losses differed: approximately 70% for the Dow, 64% for the S&P500, and 44% for the Nasdaq. Third, pressure from Treasury yields and energy prices had not completely disappeared.
Therefore, the description that most closely matches the currently available figures is 'a partial recovery following 3 days of declines.' The market's subsequent direction should be assessed by monitoring the September 4 U.S. employment report alongside bond yields and international oil prices.
Stock markets can move rapidly in response not only to published economic indicators and corporate earnings, but also to differences between expectations and actual results, interest rates, commodity prices, and geopolitical developments. A rebound on any single day does not guarantee future returns or additional gains.
※ This article is provided for informational purposes to help readers understand market developments and does not constitute an investment recommendation for any particular stock or asset. All investment decisions and associated responsibilities rest with the individual investor.